Worksheet for Assignment 22: Break-even analysis
Using the format on the break-even analysis sheet (Table 22.1):
Table 22.1
|
1 |
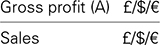
Calculate your gross profit |
||
|
Projected sales |
£/$/€ |
||
|
– Direct costs: |
|||
|
Purchases (material costs) |
£/$/€ |
||
|
Labour costs |
£/$/€ |
||
|
= Gross profits |
£/$/€ |
(A) |
|
|
2 |
Calculate your gross profit margin |
||
|
|
× 100 |
||
|
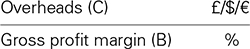
= Gross profit margin |
% (B) |
||
|
Notes: |
|||
|
3 |
Calculate your overheads |
||
|
Indirect costs: |
|||
|
Business salaries |
|||
|
(including your own drawings) |
£/$/€ |
||
|
+ Rent |
£/$/€ |
||
|
+ Rates |
£/$/€ |
||
|
+ Light/heating |
£/$/€ |
||
|
+ Telephone/postage |
£/$/€ |
||
|
+ Insurance |
£/$/€ |
||
|
+ Repairs |
£/$/€ |
||
|
+ Advertising |
£/$/€ |
||
|
+ Bank interest/HP |
£/$/€ |
||
|
+ Other expenses |
|||
|
(eg depreciation of fixed assets) |
£/$/€ |
||
|
£/$/€ |
|||
|
£/$/€ |
|||
|
£/$/€ |
|||
|
£/$/€ |
|||
|
= Overheads |
£/$/€ |
(C) |
|
|
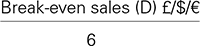
4 |
Calculate your actual turnover required to break even |
||
|
|
× 100 |
||
|
= Break-even sales £/$/€(D) |
|||
|
5 |
Calculate the monthly target to break even |
||
|
|
|||
|
= Monthly break-even sales £/$/€ ——————— |
|||
|
6 |
Calculate your estimated profit |
||
|
Projected sales |
£/$/€ |
||
|
– Break-even sales (D) |
£/$/€ |
||
|
+ Gross profit margin (B) |
% |
||
|
= Profit (for 12 months) |
£/$/€ |
||
- Construct a break-even analysis for year 1 of your business from the figures calculated in the last three chapters. You can use the Wavendon example below as a guide, or use a spreadsheet as given above.
- Estimate the effect of the following events on your break-even point for each year:
- a 10 per cent rise/fall in sales volume;
- a 10 per cent rise/fall in unit selling price;
- a 10 per cent rise/fall in variable costs per unit of sale, eg a meal;
- a 10 per cent rise/fall in fixed costs;
- a requirement for achieving your profit objective by year 1 – now what ‘volume’ of product must you sell to break even?
- Look back to Assignment 8 on Pricing, and review your proposed selling price in the light of work/research carried out during this assignment.