Assignment 22
Break-even analysis
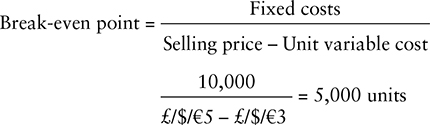
Calculating your break-even point
While some businesses have difficulty raising start-up capital, paradoxically one of the main reasons small businesses fail in the early stages is that too much start-up capital is used to buy fixed assets. While some equipment is clearly essential at the start, other purchases could be postponed. This may mean that ‘desirable’ and labour-saving devices have to be borrowed or hired for a specific period. This is obviously not as nice as having them to hand all the time, but if, for example, computers, word processors, photocopiers and even delivery vans are brought into the business, they become part of the fixed costs.
The higher the fixed-cost plateau, the longer it usually takes to reach break-even and then profitability. And time is not usually on the side of the small new business: it has to become profitable relatively quickly or it will simply run out of money and die. The break-even analysis is an important tool to be used both in preparing a business plan and in the day-to-day running of a business.
Difficulties usually begin when people become confused by the different characteristics of costs. Some costs, for instance, do not change however much you sell. If you are running a shop, the rent and the rates are relatively constant figures, quite independent of the volume of sales. On the other hand, the cost of the products sold from the shop is completely dependent on volume. The more you sell, the more it ‘costs’ to buy stock. The former of these costs are called ‘fixed’ and the latter ‘variable’, and you cannot add them together to arrive at total costs until you have made some assumptions about sales.
Breaking even
Let’s take an elementary example: a business plans to sell only one product and has only one fixed cost, the rent.
In Figure 22.1 the vertical axis shows the value of sales and costs in thousands of pounds, and the horizontal axis the number of ‘units’ sold. The second horizontal line represents the fixed costs, those that do not change as volume increases. In this case it is the rent of £/$/€10,000. The angled line running from the top of the fixed costs line is the variable costs. In this example the business plans to buy in at £/$/€3 per unit, so every unit it sells adds that much to its fixed costs.
Figure 22.1 Graph showing break-even point
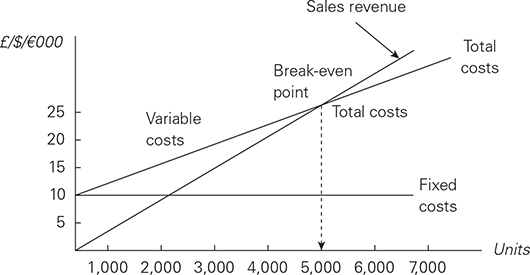
Only one element is needed to calculate the break-even point – the sales line. That is the line moving up at an angle from the bottom left-hand corner of the chart. The business plans to sell out at £/$/€5 per unit, so this line is calculated by multiplying the units sold by that price.
The break-even point is the stage at which a business starts to make a profit. That is when the sales revenue begins to exceed both the fixed and variable costs. Figure 22.1 shows the example’s break-even point is 5,000 units.
A formula, deduced from the figure, will save time for your own calculations.
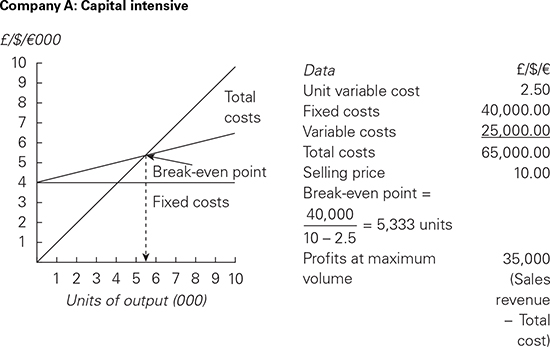
Capital intensive versus ‘lean and mean’
Look at two hypothetical new small businesses. They are both making and selling identical products at the same price, £/$/€10. They plan to sell 10,000 units each in the first year.
The owner of Company A plans to get fully equipped at the start. His fixed costs will be £/$/€40,000, double those of Company B. This is largely because, as well as his own car, he has bought such things as a delivery van, new equipment and a photocopier. Much of this will not be fully used for some time, but by buying it he will save some money now. This extra expenditure will result in a lower unit variable cost than Company B can achieve, a typical capital-intensive result. Its break-even chart will look like Figure 22.2.
Figure 22.2 Example break-even chart for a capital-intensive company
Company B’s owner, on the other hand, proposes to start up on a shoestring. Only £/$/€20,000 will go into fixed costs, but of course his unit variable cost will be higher, at £/$/€4.50. The variable cost is higher because, for example, he has to pay an outside carrier to deliver, while A uses his own van and pays only for petrol. So the break-even chart will look like Figure 22.3.
Figure 22.3 Example break-even chart for a ‘lean and mean’ company
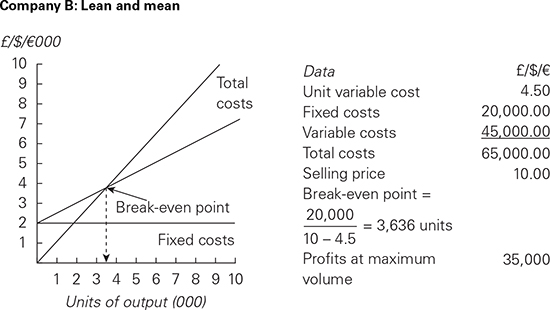
From the data on each company you can see that total costs for 10,000 units are the same, so total possible profits, if 10,000 units are sold, are also the same. The key difference is that Company B starts making profits after 3,636 units have been sold. Company A has to wait until 5,333 units have been sold, and it may not be able to wait that long.
This was only a hypothetical case, but the real world is littered with the corpses of businesses that spend too much too soon. The marketplace dictates the selling price, and your costs have to fall in line with that for you to have any hope of survival.
Profitable pricing
To complete the break-even picture we need to add one further dimension – profit. It is a mistake to think that profit is an accident of arithmetic calculated only at the end of the year. It is a specific and quantifiable target that you need at the outset.
Let’s go back to our previous example. You plan to invest £/$/€10,000 in fixed assets in a business, and you will need to hold another £/$/€5,000 worth of stock too – in all say £/$/€15,000. You could get £/$/€1,500 profit just leaving that money in a bank or building society, so you will expect a return of say £/$/€4,000 (equal to 27 per cent) for taking the risks of setting up on your own. Now let’s see when you will break even.
The new equation must include your ‘desired’ profit, so it will look like this:
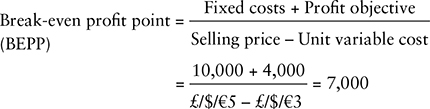
We know that to reach our target we must sell 7,000 units at £/$/€5 each and have no more than £/$/€10,000 tied up in fixed costs. The great strength of this equation is that each element can be changed in turn on an experimental basis to arrive at a satisfactory and achievable result. For instance, suppose you decide that it is unlikely that you can sell 7,000 units, but that 6,500 is achievable. What would your selling price have to be to make the same profit?
Using the BEPP equation you can calculate the answer:
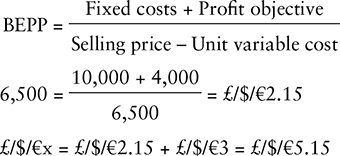
If your market will bear a selling price of £/$/€5.15 as opposed to £/$/€5, all is well; if it won’t, the ball is back in your court. You have to find ways of decreasing the fixed and/or variable costs, or of selling more, rather than just accepting that a lower profit is inevitable.
From the particular to the general
The example used to illustrate the break-even profit point model was of necessity simple. Few if any businesses sell only one or two products, so a more general equation may be more useful if your business sells hundreds of products, as, for example a real shop does.
In such a business, to calculate your break-even point you must first establish your gross profit. If you are already trading, this is calculated by deducting the money paid out to suppliers from the money received from customers. If you are not yet trading, then researching your competitors will give you some indication of the sort of margins you should aim for.
For example, if you are aiming for a 40 per cent gross profit, your fixed costs are £/$/€10,000 and your overall profit objective is £/$/€4,000, then the sum will be as follows:
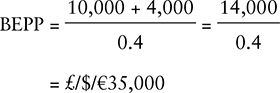
So to reach your target you must achieve a £/$/€35,000 turnover. (You can check this out for yourself: look back to the previous example where the BEPP was 7,000 units, and the selling price was £/$/€5 each. Multiplying those figures out gives a turnover of £/$/€35,000. The gross profit in that example was 2/5, or 40 per cent, also.)
Getting help with break-even
BizPep has a useful piece of software that allows you to calculate your optimal selling price under a wide range of business conditions (www.bizpeponline.com/PricingBreakeven.html). A fully functioning download is available free for a seven-day trial. The outputs include break-even charts for current, increased, decreased and optimum pricing calculated for prices ranging from –50 to +50 per cent of your current actual or proposed price. You can carry out the same analysis yourself using the free software from the Harvard Business School (see the earlier section ‘Pricing for profit’), but BizPep’s templates do some of the grunt and groan for you.