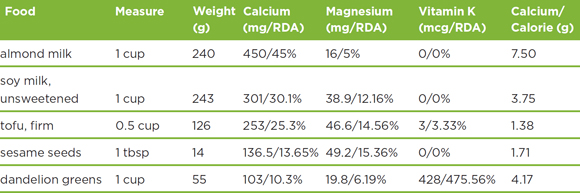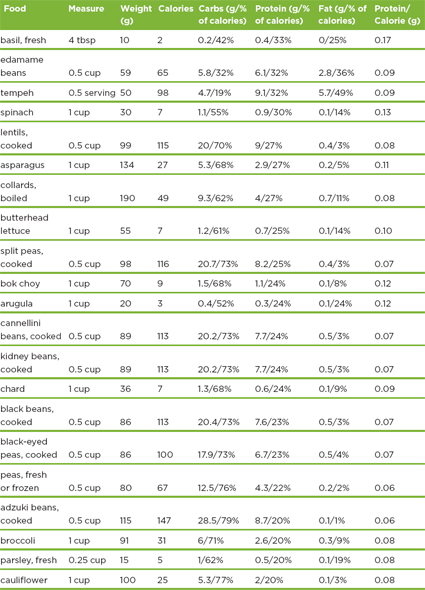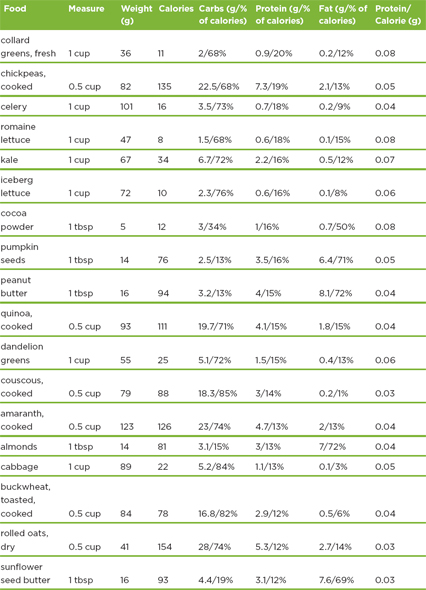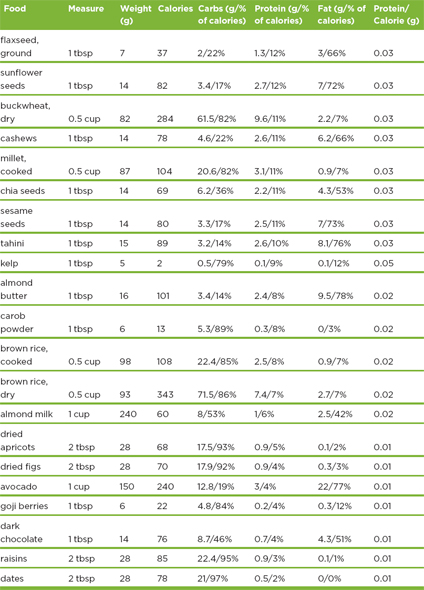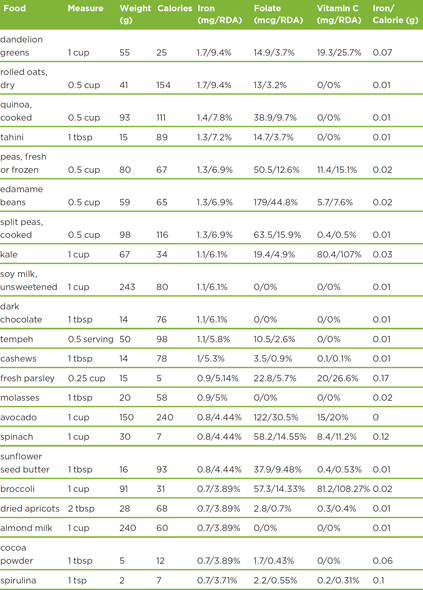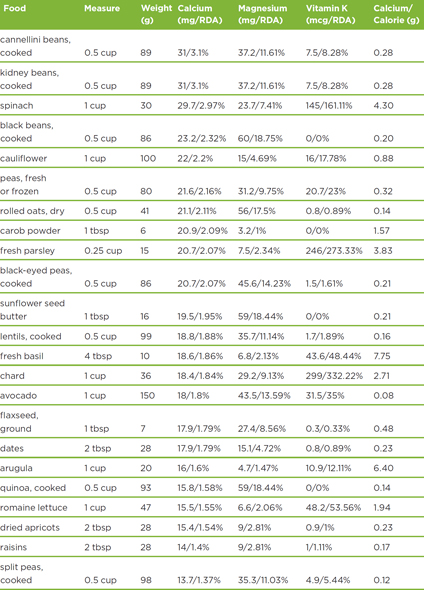
Following is a nutrient chart, showing nutrient values for a range of whole plant foods.1 The information is outlined based on typical servings of each food. For instance, comparing a cup of spinach to a cup of pumpkin seeds isn’t optimal because one could easily eat a cup of spinach in a salad, but a full cup of pumpkin seeds is quite a lot to eat in one sitting. The measure and weight (in grams) of each food is listed for better comparisons, and for those who use metric measures.
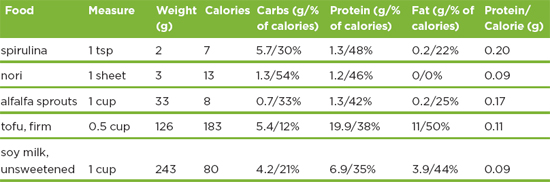
Carbohydrates, protein, and fat are all listed first in grams, then in the percentage of calories. The percentage of calories is very useful for knowing how to best balance these foods through the day to get an overall healthy dose of macronutrients. Although this chart only includes plant foods, it clearly shows that the ones at the top of this list can easily help you meet the generally recommended 10–20% of daily calories from protein. The protein per calorie column shows you each food’s relative protein for calorie “buck” to help you compare the value between foods that may have very different calorie and protein profiles. Spinach, for example, may not have many grams of protein in a serving, but it has about twice as much protein for each calorie than beans.
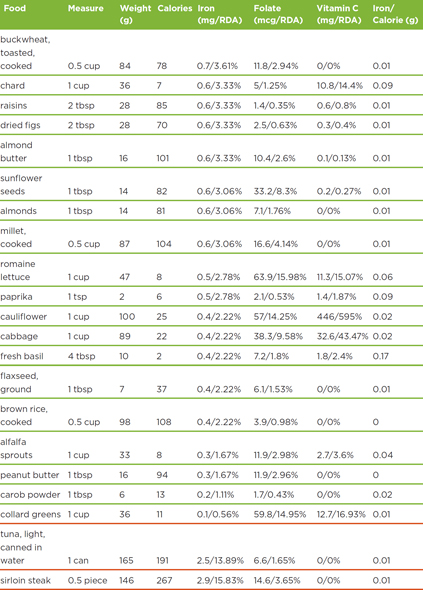
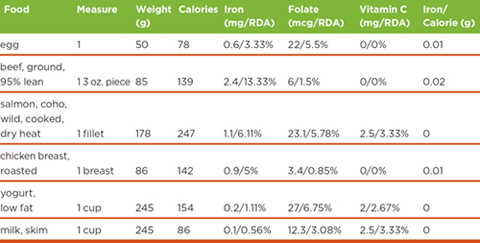
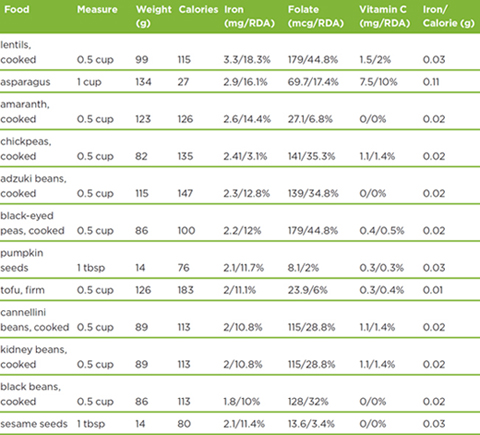
Iron content for each food is listed in milligrams, then in the percentage of the USDA recommended daily intake for adult women (which is 18mg per day). Folate (in micrograms and percentage of recommended daily intake) and vitamin C (in milligrams and percentage of recommended daily intake) are also listed since they assist with iron absorption in your body. Some animal foods are included at the bottom for comparison to show how excellent plant foods can be, not only for iron but also for those nutrients that help absorption. The iron per calorie column shows you each food’s relative iron for calorie “buck” to help you compare the value between foods that may have very different calorie and iron profiles. Lentils and asparagus, for example, not only have more iron in a serving than a steak; they have much more iron per calorie—plus they have lots of vitamin C to help you properly absorb that iron.
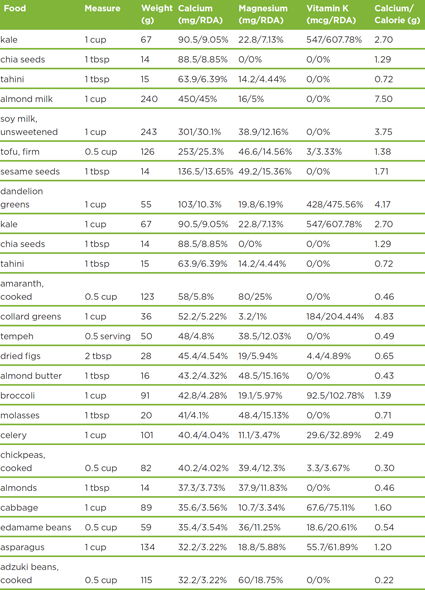
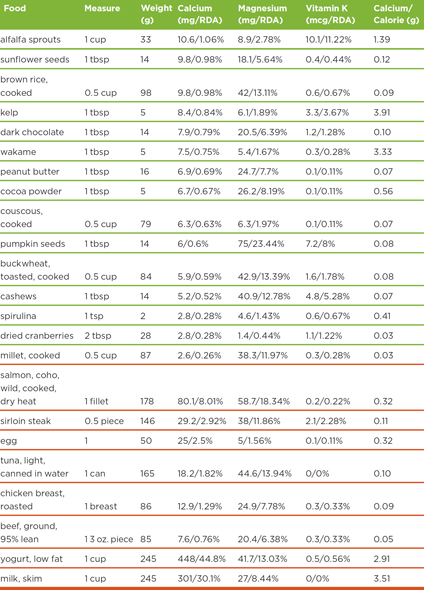
Calcium content for each food is listed in milligrams, then in the percentage of the USDA recommended daily intake for adults (which is 1,000mg per day). Magnesium (in micrograms and percentage of recommended daily intake) and vitamin K (in micrograms and percentage of recommended daily intake) are also listed since they work together to be fully utilized in your body. Some animal foods are included at the bottom for comparison to show how excellent plant foods can be, not only for calcium but also for those nutrients that help utilization. The calcium per calorie column shows you each food’s relative calcium for calorie “buck” to help you compare the value between foods that may have very different calorie and calcium profiles. Dried figs, for example, have less calcium in milligrams than salmon but have about twice as much calcium for the same number of calories.