
Sudden Aspen Decline and Climate Change: Why More SAD May Await Us Jim Worrall, PhD
Jim Worrall is a plant pathologist with the US Forest Service, who received his PhD in plant pathology from the University of California, Berkeley, and was associate professor at the College of Environmental Science and Forestry in Syracuse, New York before joining the Forest Service. He has conducted forest research in Germany, Alaska, California, New York, New Hampshire and Colorado. Jim is the leading authority on sudden aspen decline, a phenomenon of widespread, severe, rapid, dieback and mortality of aspen forests that is linked directly to climate change.
I’d like to share with you what’s been happening in some of our aspen forests over the last decade, how it’s connected to climate change, and projections for the future of aspen over the rest of this century. First, let’s consider why we should care about aspen. Three reasons: first, aspen is a biodiversity magnet. There are more species that are associated with and in many cases specifically depend on aspen than on any of our major tree species. It also produces a lot of forage and browse for ungulates such as elk and deer. Overall, it’s the most diverse upland forest type that we have in the Rocky Mountains.
Second, it does good things for water. It starts with the rich organic soils that build under aspen forests. They have a high water holding capacity, low potential for erosion, they moderate stream flow and improve aquatic and riparian habitats downstream. Water yield of aspen forests can also be higher than from conifers. Finally, we all know that aspen is a beautiful tree and forest type and visitors know this too, and that is part of the reason for the tourism economy we have in Colorado.
That beauty began to fade in 2004; we started getting calls from foresters in Southwestern Colorado telling us about branch dieback and mortality that they hadn’t seen before occurring over very large areas. It was apparently very recent and ongoing. In some of the lower elevation forest, such as you see here below, (see Figure 1), the patches of aspen were completely dead with no regeneration and no sprouting going on. Over the next few years, this got worse and occurred in more and more areas. By 2006, we knew it was a serious problem and started to study it.
This thing we call sudden aspen decline is characterized by a rapid, synchronous, branch dieback and mortality. It occurs on a landscape scale over a large area, not on the stand level that we’re used to seeing aspen mortality occurring at (see Figure 2). The trees are ultimately killed by secondary insects and pathogens, those that depend on a stressed tree, not by the primary insects and pathogens that usually kill aspen trees in Colorado.
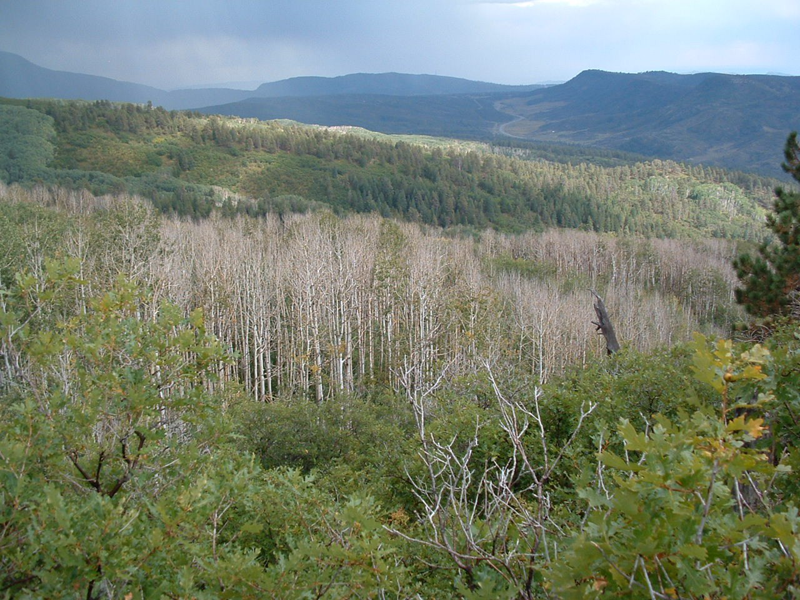

Figure 1 & 2: Sudden Aspen Decline in Dolores, Colorado. Photo Credit: Phil Kemp

Figure 3: Map prepared by Suzanne Marchetti based on model results of Gerald Rehfeldt and colleagues.
This disease increased rapidly from 2004 to 2008. In 2008, over half a million acres were affected in Colorado. That’s over 17 percent of the aspen forest type that we have. It also occurred in southern Wyoming and similar damages in northern Arizona, southern Utah and in the prairie provinces of Canada. It is important to note that the spread to new areas has stopped now, but some of the affected areas have continued to worsen.
In all the plots we did in southwestern Colorado, we found that regeneration was not increasing with overstory death, as you would hope to see. On the lower axis, the horizontal axis, you see recent crown loss, which is a measure of tree damage and stand damage (see Figure 3). Regeneration does not increase as the amount of damage increases.
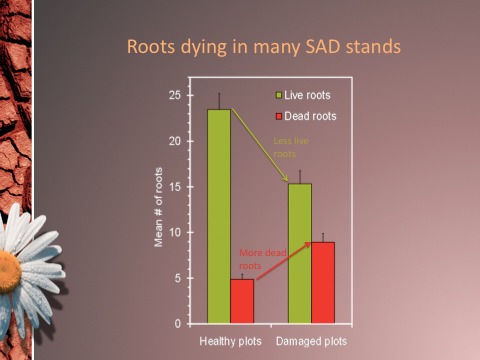
Figure 4: Map prepared by Suzanne Marchetti based on model results of Gerald Rehfeldt and colleagues.
Aspen typically regenerates vegetatively by sending up sprouts from the roots. In this case, there was not new reproduction occurring as the overstory died. One of the primary reasons for this lies belowground: the roots were dying in many SAD stands. By comparing damaged stands to healthy stands, we found that there were fewer live roots and more dead roots in damaged stands, so fewer live roots to produce sprouts to replace the dying overstory (see Figure 4).
A complex disease like this has a variety of different categories of causes, but in this case we have strong evidence that the 2002 drought was the primary inciting factor. All of the predisposing factors that we identified here are moisture related. The fact that it’s more severe on low elevations, south and southwest slopes, indicates that a moisture deficit existed. In fact, in Colorado we had this very severe multi-year drought that peaked in 2002. I remember walking in some aspen stands that summer and seeing leaves of the aspen that were scorched black around the edges, as if somebody had taken a blow-torch and just played it around the edges of the leaves. The drought that caused this has been characterized as a “global change type drought,” because it was not only very dry but also very hot. That’s a bad combination for trees.
To get more quantitative evidence, we analyzed a climate moisture index, which indicates degree of moisture deficit. Basically, the geographic variation in the climate moisture index was related to the amount of damage that occurred later. A group of Forest Service scientists in Moscow, Idaho, led by Jerry Rehfeldt, studied this too and they solidified evidence tying SAD to the drought and ultimately to climate change as well. They developed an aspen climate profile, which quantified climatic variables that determine where aspen can and cannot grow on the landscape. They found that 2002 was the most extremely unfavorable conditions for aspen in the entire climate record. More importantly, they found that sites where SAD was occurring are the most climatically sensitive ones. They are at the margin or fringe of aspen’s climate niche, more sensitive and vulnerable to drought. They projected severe loss of suitable climate area in the future, especially at lower elevations.
Based on their model results, we did some analyses, calculations, and maps (see Figure 5). This is a map of the area around Aspen and it encompasses the White River National Forest. The area shown in green is the area that was climatically suitable for aspen in the latter part of the 20th century. Let’s call that recently suitable for aspen. This graph now shows over a much larger area, all of Colorado and Southern Wyoming, the area that was recently suitable. You can see it’s just over 16 million acres.
Using the climate models of the IPCC, they were able to crank forward the aspen climate profile into the coming century to see how the area that’s suitable for aspen would change The area shown in blue is the area that’s projected to be suitable for aspen in 2060 They used three climate models to do this, and the depth of the blue indicates whether one, two or three models agree that each pixel is going to be suitable. You can see there is a lot of green showing. That green showing is of course area where suitability is lost between the latter part of the 20th century and the 2060’s.
In red, you see the area where suitability is projected to be lost by 2060 That’s about two thirds of the recently suitable projected to be lost. Now, this is actually an estimate that’s fairly optimistic, because if any of the three models says that a pixel will be suitable, we’re accepting that in this. Finally, as you might expect there is some area that becomes newly suitable For instance, upslope becomes warmer and more conducive, and that does compensate for a small portion of the loss of suitability We didn’t calculate the map and numbers for 2090; there is less certainty as you look farther ahead However, Rehfeldt et al projected that by 2090, the lower elevation of the suitable aspen climate will rise 2,500 ft.
This is what is projected for aspen by 2060 in this area, so that’s the first half or more of the century. We’re already one decade into that time, so what’s been happening in that time? As you know, sudden aspen decline is what’s been happening. This shows in red the area where SAD was mapped by aerial survey from 2003 to 2009 (see Figure 6) Two things about it: one is it’s a fairly large area over Colorado and Southern Wyoming; it’s about 11 million acres The most important thing to notice in this map is that the sudden aspen decline is occurring primarily in the areas that are projected to be lost to suitability early in the century These are the areas that are most climatically sensitive. It’s hard to avoid the conclusion that sudden aspen decline is really fulfilling the projections or at least beginning to do so.
The big question here is, is SAD due to climate change? Because of differences between climate versus weather and global versus local, it’s not possible to definitively answer that question. But common sense tells us if it looks like a duck and it quacks like a duck, it’s most likely a duck
Here we have a drought that instigated SAD that was of the type projected to occur more commonly under climate change, with impacts on trees that are of the sort that are projected to occur commonly under climate change I think most importantly, it occurred specifically where climate suitability is projected to be lost, early this century. I would say yes, SAD does seem to be a harbinger of climate change. That being the case, we can expect it to occur not at a steady rate, but in spurts, because trees and tree diseases don’t respond to the climate mean, they respond to the climate extremes. They respond to those edges of the variability or the tails of the distribution if you will. We can expect SAD to recur more frequently in the future, to have less aspen in the future, and the values that aspen brings with it - biodiversity, water and so on - will be affected accordingly.
I struggle to end on a positive note, but I would say that aspen is the most widespread tree species we have in North America. It’s very adaptable to many different kinds of sites. Therefore, it seems certain that we will have aspen somewhere on the landscape far into the future.


Figure 5 & 6: Map prepared by Suzanne Marchetti based on model results of Gerald Rehfeldt and colleagues.