7
Plasticity
7.1. Introduction
Now that you have seen the main criteria for sizing a structure, we are going to look at what happens after these criteria.
For brittle materials, we generally observe a brutal rupture of the structure just after the criterion. The criteria that we have just studied (maximum normal stress, Tsai–Hill or Mohr–Coulomb depending on the materials studied) can therefore be used as both an end of elasticity criterion and a rupture criterion. Nevertheless, there are a certain number of materials which have more complex behavior, such as composite materials, for example, for which the rupture is more or less progressive. In this instance, the Tsai–Hill criterion generally enables us to determine the first ply rupture, but that does not generally provoke a rupture of all the other plies at once.
For ductile materials, we generally observe plasticity developing once the criterion has been attained. In fact, if we observe the tension curve of a ductile material, we observe an elastic linear beginning followed by a plastic part (meaning that a permanent strain exists when the stress is released). Therefore, the criteria that we have just studied (Tresca or Von Mises) cannot be used as an end of elasticity criterion and a rupture criterion at the same time. These criteria enable us to determine the end of elasticity, but other approaches will be necessary to determine the rupture. In fact, using these criteria to determine the rupture would again overlook the plasticity part in the tension curve (yet the plasticity represents the largest part of this curve)!
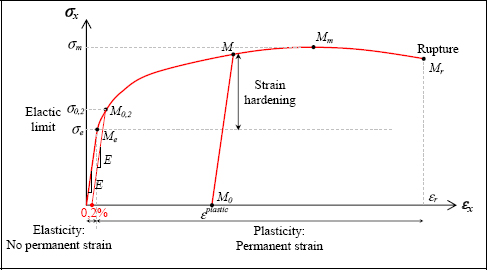
Figure 7.1. Plasticity of a ductile material. For a color version of this figure, see www.iste.co.uk/bouvet/aeronautical.zip
This plastic behavior (and the plastic strain in particular) is very significant for a structure’s behavior. For example, due to this plastic strain, we can shape or stamp pieces (and that they do not return to their initial sheet shape).
Furthermore, due to this plastic strain, we can increase the elastic limit of a material by strain hardening. In fact, if we load our material up to point M and if we unload it up to the null stress, we then obtain a material with an equilibrium point M0 and with an elastic limit σM (greater than the initial elastic limit σe): we are now talking about strain hardening. Incidentally, we will note that the new equilibrium position M0 will therefore be seen as a null strain for the “new” material and that the stress/strain curve will be defined as based on M0. You must also bear in mind that in reality, given the manufacturing process, and in particular the heat treatment, a piece must necessarily be in a strain hardening state, and that only the M0 state is known.
If the strain hardening enables the material’s elastic limit to be increased, it also induces its toughness and strain at rupture to be decreased. In fact, we note that the stress/strain curve of the “new” material presents a weaker plasticity domain, a lower strain at rupture εr and a weaker dissipated energy (corresponding to the air under the curve). This capacity that the material has to dissipate energy is directly connected to the fracture toughness (or to the critical stress intensity factor): the more the material can dissipate energy by plastic deformation, the more significant the fracture toughness will be, and the more slowly the cracks will propagate (and vice versa). We find the same opposition as for the precipitation hardening (see. Chapter 8): increasing the elastic limit decreases the fracture toughness (and vice versa).

Figure 7.2. Plasticity of a ductile material after prior strain hardening. For a color version of this figure, see www.iste.co.uk/bouvet/aeronautical.zip
In practice, it is almost impossible to define an elastic limit σe as the passage between elasticity and plasticity is done in a (more or less, depending on the material) very progressive way. Thus, we define an elastic limit at 0.2% (σ0.2) corresponding to the point inducing a plastic strain of 0.2%. In practice, (due to malapropism) we often call this 0.2% stress “the elastic limit”, which we note as σe.
Plasticity is also very significant for sizing aeronautical structure, in particular under UL. In fact, we have seen that an airplane must withstand the LL without becoming permanently deformed: the stress must in fact remain elastic, meaning less than the elastic limit. However, for the UL, only one catastrophic rupture is forbidden: a permanent (or plastic) deformation is therefore permitted. An aeronautical structure is therefore sized under the UL, while accounting for the plasticity (or at least the beginning of plasticity).
7.2. Plastic instability: necking, true stress and true strain
If we now observe the shape of the sample in a tension test, we note a plastic strain localization phenomenon which starts at the maximum stress point and which is called necking.
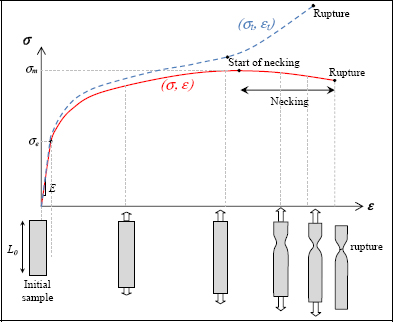
Figure 7.3. Tension test in engineering and true stress/strain. For a color version of this figure, see www.iste.co.uk/bouvet/aeronautical.zip
In order to understand this necking, we must study the evolution of the stress depending on the strain, and also the evolution of the sample section. The force of a sample section is obviously the product of this stress by the section:
As long as this force increases with the strain, the sample will deform in a homogeneous way. But if this force sets about decreasing (or remaining constant), then a strain localization, meaning a necking, will appear. In practice, there must be a defect somewhere in the sample where the necking starts, and as the problem is unstable, the necking will become even more localized.
In practice, this necking is a domain in which the structure never works (except in the event of an accident during the final rupture). In fact, this instability is a very dangerous domain for the structural integrity. It is not used for shaping or stamping either, as this would provoke non-homogeneous deformation and the piece would not have the desired shape.
In practice, necking strain on ductile materials occurs in the order of magnitude of a few tens of percentages and about 15% for a 2024 aluminum alloy.

Figure 7.4. Tension test of a 2024 aluminum alloy. For a color version of this figure, see www.iste.co.uk/bouvet/aeronautical.zip
From this necking point onwards, as the stress and strain are no longer homogeneous in the sample, the stress/strain tension curve no longer makes sense. In some areas of the sample, there is less stress and strain, and in other areas (such as the necking area), there are more. We can even show that the stress state in the necking area is no longer a pure tension state, but a tri-axial stress state.
This is why, when working on the previous curve, we took care to note F/S0 and ΔL/L0 instead of σ and ε. In fact, even after necking, this curve makes sense, but must be seen as the curve of a structure (at least after necking), and not as a material curve.
In reality, even before necking, this curve poses a problem with regards to the definitions of stress and strain adopted. Indeed, these stress and strain are evaluated against the reference position (or L0 and S0 here). It is only true for small strain (and small displacement), which in practical terms, is a few percentage points. In the case of plasticity, this strain is quickly exceeded and it is necessary to account for the variation in geometry. In other words, if L0 is no longer the length of the sample, it makes no sense to divide by L0!
In referring to the real length L and the real section S, the true stress and true strain (or, more precisely, the strain increment), are defined thus:
As for the previously evoked strain and stress, ε and σ, they are often called engineering stress and strain.
The length L which evolves over time, the strain must in fact be defined incrementally, meaning by integrating:
For the definition of the true stress, we must first of all make a hypothesis about the variation of S, based on a hypothesis about the volume variation.
We have seen that in pure tension, the strain is worth:
The volume variation is therefore:
As in general, ν is in the order of magnitude of 0.3, the volume variation in tension is therefore positive. In other words, the volume increase in the direction of tension is not compensated enough by the narrowing of the sample section.
All of that is true in elasticity, but in plasticity, it is not at all true! We in fact observe that the volume variation in plasticity is almost null.
Physically, this behavioral difference between elasticity and plasticity is well understood by the strain phenomena at play. In elasticity, the strain is due to the lengthening of the atomic bonds. The bonds are stretched in the direction of tension applied force, all while shortening these bonds by a small amount in the perpendicular directions and the volume increases. In plasticity, the strain is due to dislocation movements which settle for displacing the crystalline network defects and that do not provoke any variation to the volume. This is incidentally why plasticity is not sensitive to hydrostatic pressure: in fact, hydrostatic pressure tends to decrease (or increase, depending on its sign) the volume of the material, yet, as plasticity has no effect on this volume, the two phenomena do not interact with each other.
In plasticity, the plastic strain will therefore be in the form below:
And therefore, whatever the value of εp may be, the volume variation will be null.
If we now write that a volume V, with an initial value V0, does not vary throughout the loading, we obtain:
where L0 (S0) is the initial length (section) of the volume in the tension direction and L (S) is its length (section) at the instant in question.
Evidently, this is only true if the volume does not vary. In other words, this is not true in elasticity! However, because in practice, plastic strain is much greater than elastic strain (once elasticity threshold has been exceeded), the volume is assumed to be constant. Thus, we obtain a section S:
The section definitely decreases, while ε is positive.
And thus, the true stress and strain are worth:
If we now transform the engineering stress/strain curve in true stress/strain, we generally obtain a curve which strictly increases up until the final rupture. In reality, you must bear in mind that the spirit of the curve part after the necking, makes no sense. In fact, this part of the curve makes even less sense in engineering stress/strain as, in this instance, we are able to consider it as a structural curve, whereas in the case of true stress and strain, even true stress and strain do not make sense after necking. Indeed, we can define a true stress/true strain curve up until the rupture, but the problem becomes a true structural problem and the hypotheses that we have just made to define these true stress and strain are no longer all valid.
7.3. Plastic behavior law: Ramberg–Osgood law
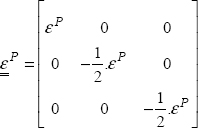
In order to model a test which makes plasticity appear, it is necessary to adapt the elastic behavior law seen previously. To do so, we start by assuming that the strain can be seen as a sum of elastic strain εe and of plastic strain εp:
The elastic (linear isotropic homogeneous) behavior law is still valid, but only between stress and elastic strain:
This relation translates a fundamental difference with elasticity: in order to determine the stress, it is insufficient to simply know the stress; the plastic strain must also be known. And to know this plastic strain, it is necessary to know the material’s history, such as the evolution of the stress from the beginning, for example.
Practically, we define the evolution of εp according to the stress by the intermediary of the strain hardening curve, meaning the threshold stress curve, depending on the plastic strain:

Figure 7.5. Plasticity curve of stress versus plastic strain. For a color version of this figure, see www.iste.co.uk/bouvet/aeronautical.zip
In fact, this curve only has one threshold and beyond which, the behavior remains elastic. If the stress remains less than this threshold, for a given plastic strain, the behavior will remain elastic. And if the stress exceeds this threshold, then the plastic strain will evolve.
In aeronautics, we often use the Ramberg–Osgood law:
This means that for a stress equal to σ0,2, the plastic strain is equal to 0.2% (or 0.002).
Here are some characteristic values for the main metallic materials used in aeronautics.
Table 7.1. Mechanical characteristics of the main aeronautic metal alloys
| 2024 Aluminum alloy | 7075 Aluminum alloy | TA6V Titanium | |
| E (MPa) | 70,000 | 74,000 | 82,000 |
| σ0.2 (MPa) | 270 | 420 | 210 |
| N | 7 | 14 | 5,4 |
| εrupture | 20% | 10% | 25% |
This gives the tension curves plotted in Figure 7.6.
Of course, you must bear in mind that these curves only make sense for strain which is lower than the rupture strain εr. In practice, this rupture strain is in fact the necking strain. Indeed, as conveyed previously, the tension curve makes no sense after necking and it is impossible to use the material beyond this strain because of strain localization problem.
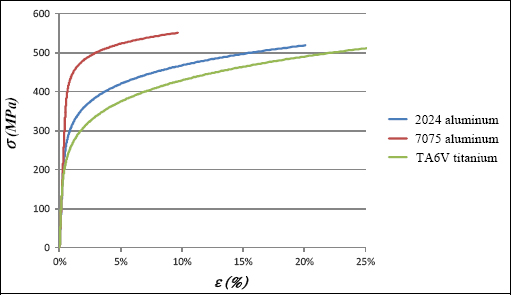
Figure 7.6. Tension curves of the main aeronautical metal alloys. For a color version of this figure, see www.iste.co.uk/bouvet/aeronautical.zip
7.4. Example of an elastic–plastic calculation: plate with open hole in tension
In order to illustrate the use of accounting for the plasticity in the structure calculation, we are going to study the example of a holed plate in tension.
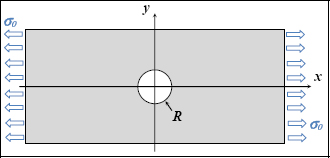
Figure 7.7. Open hole tension test. For a color version of this figure, see www.iste.co.uk/bouvet/aeronautical.zip
Incidentally, you can refer to the relevant exercise at the end of this course and show that it is possible to analytically determine the stress in this plate if the instance behavior is linear elastic isotropic homogeneous and if the plate dimensions are very large in comparison to those of the hole.
In order to study the problem of a finite plate example and then to compare it with the elastic–plastic example, we have modeled this example using the finite element method:
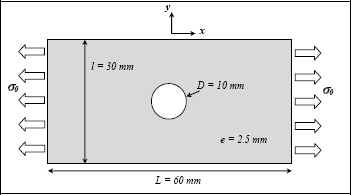
The 10-mm diameter of the hole is akin to a hole with a screw passing through it, and the 30-mm size to the distance between two consecutive screws.
The grid is comprised of membrane-type quadrangular elements and the stress is considered to be plane stress. Only a quarter of the structure is modeled and the boundary conditions are imposed on the axes of symmetry: in x = 0, u = 0 and in y = 0, v = 0.
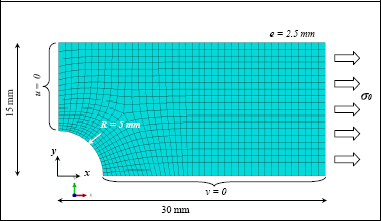
Figure 7.9. FE modeling of an open hole tension test. For a color version of this figure, see www.iste.co.uk/bouvet/aeronautical.zip
Considering that the material is aluminum (E = 70 GPa and ν = 0.3), for an average imposed stress of σ0 = 200 MPa, we then obtain the following Von Mises stress field:
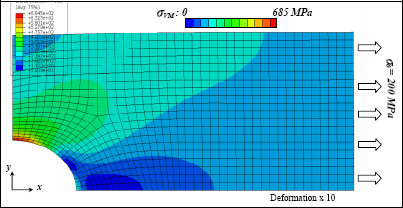
Figure 7.10. Von Mises stress of an elastic tension test. For a color version of this figure, see www.iste.co.uk/bouvet/aeronautical.zip
We obviously observe a stress concentration on the edge of the hole with a maximum Von Mises stress of 685 MPa, attained above the hole (x = 0 and y = R), which thus gives a stress concentration factor:
This coefficient is to be contrasted with the coefficient 3 found in the example of an infinite plate (see example at the end of Chapter 9). In this case, the coefficient is slightly greater as the dimensions of the plate are much greater than those of the hole, which restricts the working section in question (at 2/3 here).
We now consider that the elastic–plastic material, which has an elastic limit stress of 400 MPa, a rupture strain of 20% for a rupture stress of 520 MPa (in fact, these are necking strain and stress) and a linear strain hardening. These characteristics more or less correspond to a standard 2024 aluminum alloy.
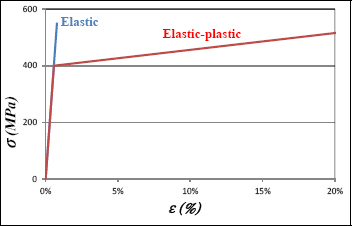
Figure 7.11. Elastic and elastic–plastic tension curves. For a color version of this figure, see www.iste.co.uk/bouvet/aeronautical.zip
We therefore obtain the following Von Mises stress field:

Figure 7.12. Von Mises stress of an elastic–plastic open hole tension test. For a color version of this figure, see www.iste.co.uk/bouvet/aeronautical.zip
Just like before, on the edge of the hole, we observe a stress concentration factor of:
Thus, the stress concentration factor has decreased from 3.4 to 2.0, simply thanks to the plasticity of the material on the edge of the hole! We now observe the plasticity area. To do so, it suffices to display the plastic strain εpl (which is obviously worth 0 if the material is in the elastic domain)! We can show that εpl is a tensor and that just like a stress tensor, we can define a Von Mises equivalent strain (which is equal to the tension strain in pure tension):
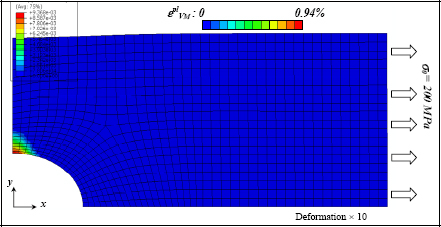
Figure 7.13. Von Mises plastic strain of an elastic–plastic open hole tension test. For a color version of this figure, see www.iste.co.uk/bouvet/aeronautical.zip
We note that the plasticity area is very weak and confined to a high stress concentration area. Moreover, the maximum plastic strain remains weak; lower than 1%. This is evident if we compare the material’s tension curve and the Von Mises stress field; as the max stress is 406 MPa, the corresponding point is located at the beginning of the plastic area.
We are now going to observe the structure’s global mechanical behavior curve. To do so, we trace the average stress σ0 according to the average strain e0, calculated by dividing the displacement imposed at the end of the plate by the length of the plate. Incidentally, we can show that the symmetries used do not change the problem at all – obviously on the condition that the displacement is divided by the half-length, 30 mm, rather than by the entire length, 60 mm!

Figure 7.14. Global curve of an open hole tension test. For a color version of this figure, see www.iste.co.uk/bouvet/aeronautical.zip
As a comparison, we have also introduced the pure Hooke’s law (σ = E. ε) into this curve, which would be obtained in the absence of a hole. We note that the loss of rigidity caused by the hole is relatively weak; about 12%.
We then observe that the global behavior of the structure varies very little, irrespective of whether the material is elastic or elastic–plastic; the loss of rigidity is about 1.5%. This is evidently due to the fact that the plastic area remains weak and almost does not affect the global response of the structure.
This example is representative of a defect in the structure. Indeed, when a metal structure, or more simply, when a metallic material piece, is being manufactured, there are necessary locally numerous defects, such as the inclusion of foreign bodies, porosity, metal shrinkage, micro-cracks, etc. When the first loads are applied to the structure, a large stress concentration will then appear around these defects and will therefore generate plastic areas. These plastic areas will have the effect of smoothing the stress and thus, rendering all of these defects much less detrimental than in the absence of plasticity. This is evidently why ductile materials are (generally) less brittle than brittle materials! This capacity of a material to generate plastic areas around the defects can be seen as the fracture toughness of a material, to limit the propagation of a crack; the more plastic areas the material generates, the more energy is needed to create them, and the higher the fracture toughness is. In short, the plasticity must be seen as a positive phenomenon for the holding of the structure, and not as a phenomenon that is to be avoided at all costs!
Certain brittle materials, such as composite materials, for example, develop another phenomenon to smooth the stress around the defects: damage. Damage, which is classically comprised of micro-cracks, indeed requires energy to create this network of micro-cracks and therefore restricts the propagation of cracks and defects; and therefore, increases the material’s fracture toughness.
This example of studying the elastic–plastic holed plate must also be contrasted to the LL and UL. In particular, we can ask ourselves the following question: knowing that the plasticity starts to develop a little before 200 MPa, which LL and which UL can this plate withstand? In practice, determining a structure’s maximum LL and UL is almost equivalent to a real problem which is, of course, designing a structure, when the LL and the UL are known. Modifying the thickness of the plate, for example, is enough to place the structure’s LL and UL to those which are required.
The response to the previous question is less obvious than it may seem. For example, we can place the maximum UL at the level of 200 MPa, saying that we can allow the UL a bit of plasticity, and then place the LL a little below, before the appearance of plasticity. This response evidently meets the LL and UL certification. In practice, we can even go further by placing the LL at 200 MPa. In fact, although a small plastic area appears, it remains very confined and (almost) does not affect the structure’s rigidity, which remains globally elastic! In short, if you do not look very closely, this structure is elastic. Moreover, the loss of elasticity will only appear during the first loading: during the second loading, the material will have local strain hardening and no new plasticity area will appear. Practically, this is how we place the maximum LL of a structure: from the moment when they do not affect the global rigidity to the structure onwards, small plasticity areas are admitted. There is a simple way to allow this and that is to slightly increase the elastic limit of a material being calculated. Thus, this enables us to only perform the elastic calculations, which is simpler and above all, quicker. When looked at closer, this is exactly what is done when the elastic limit used is σ0.2. Thus, we allow small plastic strains (less than 0.2%) on a local scale, which will allow the stress to be smoothed in the areas of singularity.
To place the UL, we must also study what happens after 200 MPa. To do so, we have gradually increased the load. We then obtain a maximum value of 278 MPa, corresponding to an asymptote of the curve (σ0, ε0). From this point onwards, the structure is no longer capable of withstanding the required stress, and the calculation diverges.
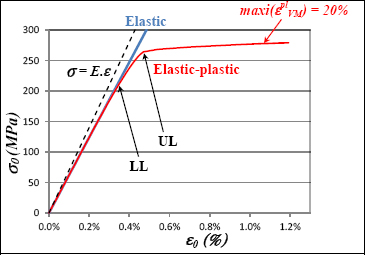
Figure 7.15. Schematic mechanical behavior of an elastic–plastic structure. For a color version of this figure, see www.iste.co.uk/bouvet/aeronautical.zip
This curve (σ0, ε0) does, nevertheless, allow us to think that it is possible to take an UL of about 260 MPa, which would enable a huge plasticity area to be avoided and to remain below the rupture. As for the LL, it must remain within the order of magnitude of 200 MPa so as to avoid losing any of the structure’s rigidity.
In order to understand what happens at 278 MPa, we have traced the Von Mises stress field and the plastic strain field:
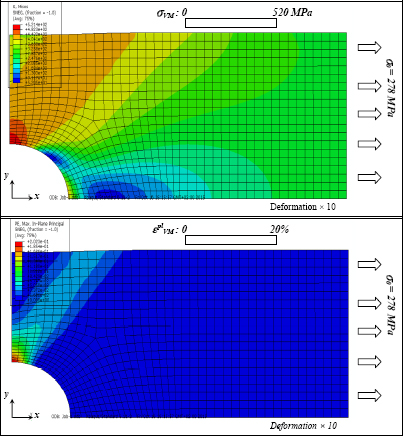
Figure 7.16. Von Mises plastic stress and strain of an open hole tension test for σ0 = 278 MPa. For a color version of this figure, see www.iste.co.uk/bouvet/aeronautical.zip
We evidently observe that the maximum Von Mises stress is equal to 520 MPa and that the maximum plastic strain is equal to 20%, as imposed on the material’s curve (σ, ε). If we impose an average stress greater than 278 MPa, all the points which attain 520 MPa of Von Mises stress, break and the structure is therefore no longer capable of withstanding the imposed force.
Nevertheless, this calculation must be taken with caution, as it is false from the moment where a point attains 20% of plastic strain onwards! In fact, from the moment when the most loaded point attains 20% of the plastic strain onwards, the material’s behavior cannot be described by the behavior law obtained on the basis of the tension test caused by the appearance of necking. We can verify that in our case, this point is attained just before 278 MPa, and that our model can therefore be considered viable until that point.


