Chapter 3
Migration
Since humans first left Africa sixty thousand years ago, ours has been a story of migration. From our origin on the African continent, we have settled all corners of the world, from within the Arctic Circle in the north to Tierra del Fuego in the south, from the most remote parts of Siberia to the jungles of Brazil. Only Antarctica has been spared human migrations, although even there a small number of scientists live on a temporary basis.
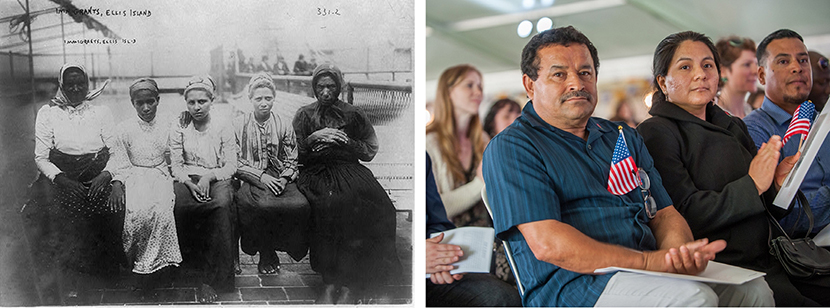
But humans have not been content to stay in place since settling the far reaches of our planet. We continue to move in search of better opportunities for our families or, all too often, as others force us to go elsewhere. Migration affects economies, environments, and cultures in profound ways. Migrants can help boost economic growth, as new workers provide needed labor in agriculture, manufacturing, and service enterprises. They can also send money back home, helping to improve the places they came from. But at the same time, migration can threaten the jobs of native workers, leading to societal tension and political battles, or lead to broken families and a lack of workers in the places they left. The movement of people and the mixing of languages, religions, customs, and beliefs can add vibrancy to places but can also strain social cohesion. Consequently, migration is one of the most important aspects of human geography (figure 3.1).
In Chapter 2, we were introduced to the demographic equation, which was stated as:
Population change = Births – Deaths + Immigration – Emigration
Obviously, birth and death rates help determine population size and population density on the surface of the earth. But that is only half of the equation. To make our explanation of these patterns complete, we must add one more component: migration. Migration is defined as the change in location of one’s permanent or semi-permanent residence. Thus, the population of a particular place is determined by the number of births and the number of deaths, as well as the number of people who migrate in and the number of people who migrate out. Immigration refers to in-migration; thus, we talk about immigrants who come from other countries to the United States. Emigration refers to out-migration, so those leaving, say, Mexico, for work abroad are called emigrants.
Migration (both immigration and emigration) can be analyzed at a variety of scales. International migration patterns are those between countries, such as between Mexico and the United States. But we also discuss national migration patterns, such as from the Northeastern United States to the Southwest. We can also examine local migration patterns, such as from rural areas to cities, known as rural-to-urban migration, and other moves within states or even within counties or cities.
Spatial distributions
Migrant stock and flow
Before we discuss why people migrate, it is useful to look at the spatial distribution of migrants. This distribution can be viewed in terms of stock and flows. Migrant stock is the number of people who reside in a place where they were not born. When viewed as a percentage, it can show the proportion of the population that is not native to a place. While measures of migrant stock reflect the number of newcomers to a place, they do not tell when the people migrated there. Thus, migrant stock includes recent arrivals as well as migrants who may have arrived decades ago as children.
Migrant flows refer to migration within a certain timeframe. A count of the number of people moving into and out of a place within the past year represents a migration flow. Flows can be viewed in different time frames, so one geographer may be interested in how migration flows during the past fifty years have impacted growth of US Sun Belt cities, while another geographer may be interested in how flows during the last month affect support for nativist political parties in Europe.
At a global scale, 71 percent of immigrants live in high-income countries, while the vast majority of emigrants (65 percent) come from middle-income countries. As seen in figure 3.2, there are higher concentrations of immigrants as a percentage of population in high-income places such as North America, much of Europe, Australia, and New Zealand. In the United States, 14.5 percent of the population was born abroad, substantially fewer than in Canada with 21.8 percent and Australia with 28.2 percent (figure 3.3). A cluster of countries with high immigrant stocks can also be seen in the Middle East, where over 70 percent of residents of the United Arab Emirates, Qatar, and Kuwait are foreign born.
Less-developed countries tend to have many fewer immigrants. The so-called global south, consisting largely of Latin America, Africa, and much of Asia, stands out in figure 3.2 as having low proportions of immigrants. Among the countries with the lowest percentage of immigrants are China, Vietnam, Indonesia, and Cuba, all of which have a foreign-born population of only 0.1 percent.
In 2015 raw numbers, the largest diasporas, or people who have left their homelands, were from India, Mexico, Russia, and China. All four of these countries had at least ten million emigrants living in other countries, many of which have formed ethnic enclaves (more in chapter 4) in cities around the world.
Figure 3.4 illustrates international migrant flows by showing net migration per 1,000 people between 2010 and 2015. Larger negative numbers mean that more people left a country than arrived during this five-year period. Larger positive numbers mean that more people arrived than left. The Middle East shows the greatest movement of people during this time. The war-torn states of Syria and Libya show the largest proportional outflow of migrants, while the greatest proportional inflow of migrants was to Oman, Lebanon, Qatar, and Kuwait.
While immigration is an ongoing topic of political discussion in the United States, net migration between 2010 and 2015 was 3.2 per 1,000, substantially less than in some other rich democracies. For instance, US net immigration was less than half that of Canada (6.7) and nearly one-third that of Australia (8.9) and Norway (9.3).
Migration stock and flow in the United States
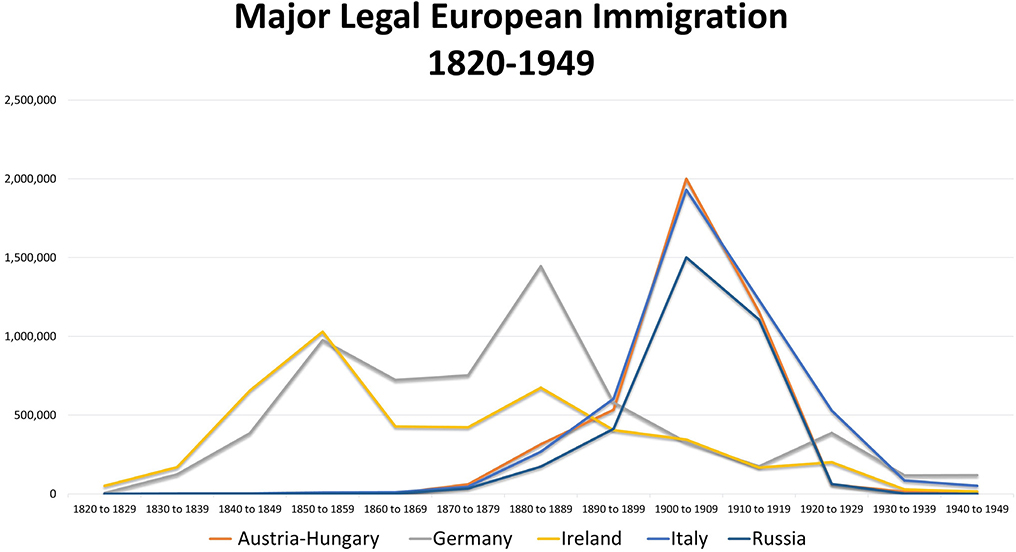
Even though the United States has a smaller migrant stock and lower migration flows than some other countries, immigrants have still played an important role in shaping American society. Early American history consisted primarily of immigration from Europe (figure 3.5). The nineteenth century was dominated by immigration from the United Kingdom, Ireland, and Germany, while the early twentieth century saw many Italians, Russians, and Austria-Hungarians. After World War II, immigration from the Americas picked up, specifically from Mexico, which by the 1960s outpaced European immigration. Asian immigration also picked up around the 1960s.
Annual trends since 1980 show how immigration from Latin America dominated the late twentieth century and early twenty-first century (figure 3.6). A huge spike in immigration from Latin America occurred in the late 1980s, in large part due to military conflict in Central America. While Latin American immigration outpaced Asian immigration for most of the time-period, by around 2011, new Asian immigrants began to outnumber new immigrants from Latin America, especially from countries such as China, India, and the Philippines.
International immigrants made up 14 percent of the US population in 2015, and immigrants and their children have been the main driver of population growth since the 1960s (figure 3.7). Without immigrants and their descendants, it is estimated that the US population in 2015 would have been 252 million as compared to the actual number of 324 million. By 2065, immigrants and their children will make up 36 percent of the US population. This change will have significant impacts on the human geography of the United States in terms of culture, politics, and economics.
At the state level within the United States, migration stock and flows can be observed in terms of international migration and of intrastate migration.
As the United States becomes increasingly influenced by immigrants and their descendants, the country will look more like the states of California, New York, Texas, and Florida. These are the states with the largest international migrant population counts, all with over 3.5 million international immigrants in 2015. These states are all important coastal and border gateway states that also have overall large populations—of both the native born and immigrants. When mapping international immigrants as a proportion of the total population, the states of Nevada, New Jersey, and Massachusetts also stand out, with over 15 percent of their populations being foreign born (figures 3.8 and 3.9).
Native-born migrants within the United States continue to move to the Sun Belt states. The largest native-born migrant stock is found, starting with the highest proportion, in Florida, California, and Texas, followed by Georgia, North Carolina, and Arizona.
Figure 3.10 shows the movement of native-born Americans by region. Generally, people stay within the region where they were born—a clear sign of distance decay—so those born in the West tend to move to other western states, while those born in the Midwest stay within their own region as well. The same holds true for people born in the South and Northeast. However, it can also be seen that when people leave their region of birth, there are clear migration flows to the Sun Belt—California, Texas, and Florida stand out as having large numbers of immigrants from all four major US regions.
Go to ArcGIS Online to complete exercise 3.1: “Spatial distributions.”
Push and pull forces
As seen in the previous section, some places clearly attract immigrants, while other places induce emigration. To understand the driving forces behind these patterns, it is essential to look at the place-specific characteristics of sending and receiving locations as well as the spatial interaction that ties places together.
Different theories have been given to help explain how, where, and why people migrate. One of the first and most influential thinkers on migration was E. G. Ravenstein, who in 1885 wrote On the Laws of Migration. He presented a set of “laws” based on his research in Great Britain in the nineteenth century. While some of his laws do not apply to all contemporary migration trends, many still inform modern migration theory. Ravenstein’s laws of migration are as follows:
•Migrants move short distances along fixed currents toward “great centers of commerce and industry.”
•Rapidly growing cities absorb migrants from nearby places. The places vacated by these migrants are then filled by migrants from places farther away, in a step-by-step fashion. Communication flows between places can countervail the disadvantages of distance.
•Some places see a dispersion of their populations, as they migrate to growing urban areas.
•All migration currents have a compensating countercurrent.
•Long-distance migrants generally move to one of the great centers of commerce or industry.
•Rural residents migrate more than urban residents.
•Females migrate more than males.
Implicit in Ravenstein’s work is the idea that certain places attract immigrants, as in his “great centers of commerce and industry.” The idea that some places attract people led other migration researchers to expand on the idea of push and pull factors. These theories are based on the fact that places of origin have factors that “push” people to leave, while places of destination have factors that “pull” people to come. These forces can be viewed in terms of the economic, social and cultural, political, and environmental conditions of places.
Ravenstein also noted that migration is not random but rather is tied to currents of migration—flows between specific places that people follow in regular patterns. This spatial interaction between places is fed by communication, as people share information on the opportunities and challenges involved with making the move. Furthermore, he noted that the characteristics of migrants take a specific form. Migrants are not randomly selected from the general population but tend to have specific characteristics in terms of sex, age, income, and other variables.
Economic push and pull
As you may expect, some of the most common reasons to migrate are economic. One way of understanding how economic forces influence migration is through neoclassical migration theory. This theory focuses on wage differentials between origin and destination. If wages are low in one place relative to another place, then individuals will be pushed from the low-wage to the high-wage location. This theory is useful in understanding much migration, in that historically and globally, economic forces are the key drivers of migration.
For example, most migration from Mexico to the United States has been driven by significant wage differences between the two countries. The average Mexican income in 2014 was US $12,850, adjusted for cost of living differences with the United States. This compares to average US earnings of $57,000. But neither most Mexicans nor most Americans earn the average income. In 2014, 14.8 percent of Mexican workers earned less than two-thirds of the median wage, the equivalent of US $707 or less per month, again accounting for differences in cost of living. Those making only the minimum wage earned less than US $160 per month. By migrating to the US and earning the 2014 federal minimum wage of $7.25 per hour, a full-time worker would earn about $1,160 per month. That is a 60 to 600 percent increase in wages—certainly enough of an incentive for many to migrate. The gains are even greater for immigrants who arrive in states with minimum wages above the federal level. For instance, the 2014 minimum wage in California was $9 per hour, while in Illinois it was $8.25 and in New York, $8.
But wages alone are not enough to explain all migration patterns. Economic forces can also include unemployment rates, working conditions, and opportunities for career advancement. Places with high unemployment rates are likely to push people away, while places with low unemployment will pull people in. Similarly, a place with a cluster of large corporations in a specific industry may offer attractive benefits packages, interesting coworkers, and opportunities to move into positions of greater responsibility. The technology cluster in Silicon Valley, for instance, pulls in people from all over the US and the world for good wages but also for fun and interesting work and myriad opportunities for professional growth. Likewise, people migrate from around the world to New York and London because of ample career opportunities in their financial sectors.
The level of emigration from a place can also be related to level of economic development (figure 3.11). This relationship is described by the migration transition theory, which is closely related to the demographic transition theory discussed in chapter 2. In preindustrial societies, emigration is low. High, yet roughly equal, rates of births and deaths mean that population growth is minimal, so there is no demographic pressure to emigrate. Furthermore, because of limited income, people do not have the resources to travel to new places.
As countries begin to industrialize and urbanize, as in stage 2 of the demographic transition, high birth rates and falling death rates result in a population boom. Incomes also increase during this time as economies shift from basic agriculture to mechanization on farms and in factories. With population pressure and higher incomes, migration increases significantly. During this stage, there is massive rural to urban migration as people shift from agricultural work in rural areas to manufacturing work in cities. There is also emigration to other countries, as people seek new opportunities farther from home.
As countries continue to develop through urbanization and industrialization, they enter stage 3. During this stage, birth rates fall, resulting in a slowing of population growth. As population pressures decline, rural to urban migration and emigration rates slow somewhat.
Finally, modern, urban stage 4 countries with low birth and death rates, have low levels of emigration. Migration tends to be city to city, while net international migration is positive as more migrants arrive than leave.
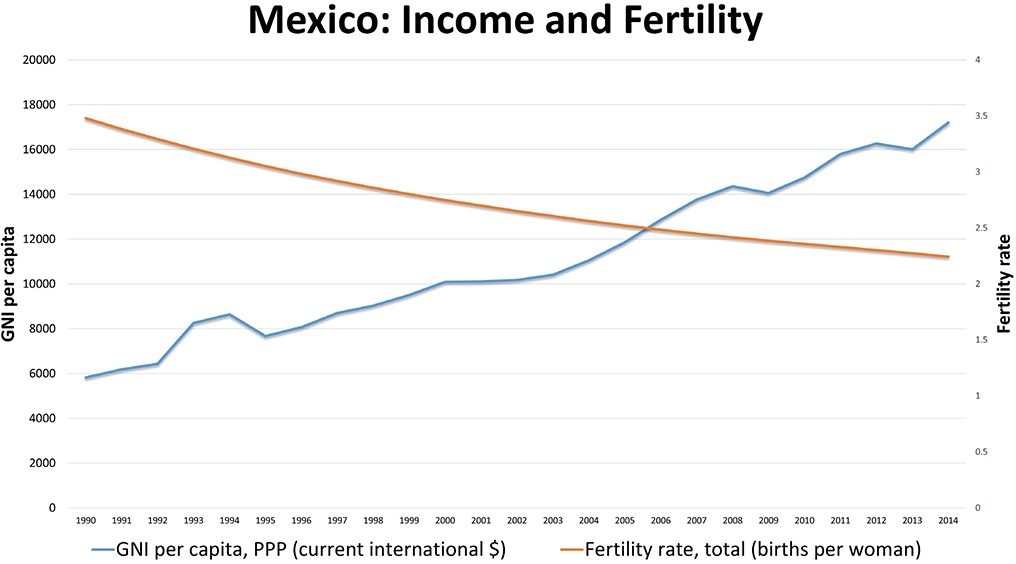
Given that Mexico has been one of the most important sources of immigrants to the US in recent decades, it is useful to view Mexican immigration in terms of the migration transition. Figure 3.12 shows how income and fertility have changed in Mexico since 1990. Whereas in 1990 the per capita income was $5,820, by 2014 it had risen in real dollars to $17,200. At the same time, the total fertility rate had fallen from nearly 3.5 children to about 2.2. As Mexico transitions to a higher income and lower fertility country, the migration transition theory predicts that emigration will decline.
As pointed out previously, Asian immigration to the US is now higher than that from Latin America. As the economies of Asia grow, a larger number of people have the financial resources to immigrate to the United States. While birth rates in much of Asia are relatively low, the sheer number of people in the region means that a substantial number are available and have the financial resources to emigrate.
Social and cultural push and pull
Social and cultural factors, including social connections, language, and religion, also drive migration. In terms of personal social connections, many people are pulled to places where friends and family already live, while in other cases, people may be pushed away by troublesome friends or abusive family relationships.
Language can also play a role in migration. For instance, the English-speaking population of Quebec, Canada, decreased from the late 1960s through the late 1980s as a number of laws promoting the French language were put into effect (figure 3.13), which pushed to other Canadian provinces some businesses and residents who spoke only English. At the same time, French-speaking migrants from former French colonies in the Caribbean and Africa, while probably migrating primarily for economic reasons, were pulled to Quebec because of a common language.
Especially in the case of migration pull forces, language plays a similar role in many locations. France attracts migrants from former North African colonies such as Algeria and Tunisia, while the United Kingdom and the United States attract more English-speaking Nigerians. Likewise, many emigrants from Latin America have moved to Spain because of their common language, which allows them to more quickly adapt to and integrate with the host country.
Along with language, one of the most powerful facets of identity for some people is religion. For this reason, it can play a significant role in migration. Mass movements of Hindus and Muslims in South Asia came with the region’s independence from Great Britain in the late 1940s and the formation of Hindu-dominated India and Muslim-dominated Pakistan and Bangladesh. Religion was also a major force during the formation of Israel in shaping who lives there and in the Palestinian Territories. In more recent years, the Middle East has seen a dramatic shifting of religious populations. Sunni and Shiite Muslims increasingly live in separate parts of Iraq, Syria, and Saudi Arabia, while small Christian, Jewish, and other minority populations in places such as Egypt and Iraq have been pushed out of the region in large numbers.
The Yazidi people in Iraq constitute a recent example of how religion can be used as an excuse to push people away from their homeland. In 2014, as the Islamic State terrorist organization was gaining territory in Iraq and Syria, the Yazidi people were forced to flee their land (figure 3.14). In the eyes of the Islamic State, the Yazidis, whose religion is one of the most ancient of the Middle East, were seen as devil worshipers who had to be eliminated. At least 5,000 Yazidi men were killed by the Islamic State, and thousands of women and children were taken captive, some for sexual enslavement and forced marriage to the organization’s fighters. Those who were not killed or captured fled their villages to survive. Only the eventual defeat of the Islamic State will allow these people to return to their homes.
Political push and pull
Political push and pull forces can also be significant determinants of migration. This includes issues such as conflict and peace or persecution and human rights. Places with high levels of violent crime or war will frequently push people away. Young migrants from Honduras, Guatemala, and El Salvador have been emigrating to escape violence in some of the most crime-ridden places in the world, where youth are often recruited by force into street gangs (figure 3.15). In 2015, El Salvador had the highest homicide rate of any country not at war. Extortion by gangs is rampant in these countries, where bus drivers, small business owners, and residents of poor neighborhoods are forced to pay protection money under threat of violence. For these reasons, emigrants continue to flow out of these Central American countries, many of whom attempt to immigrate to the United States.
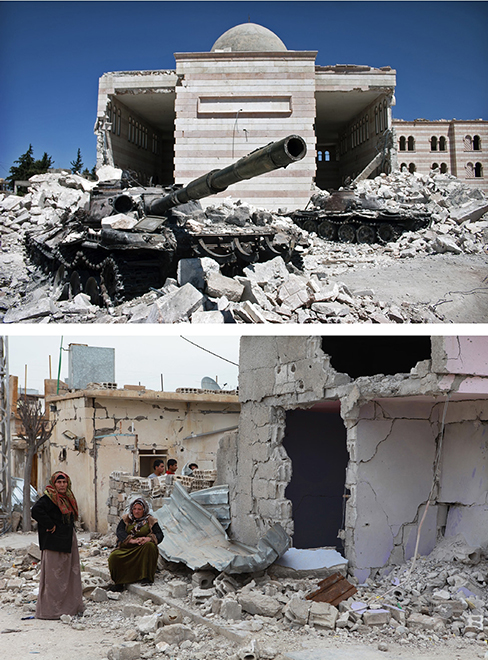
Likewise, there has been mass migration as people have been pushed away from war-torn countries such as Syria. Between 2011 and 2016, roughly nine million Syrians had fled their homes, migrating to nearby Jordan, Iraq, Turkey, Lebanon, and various European countries as well as to other locations within Syria (figures 3.16 and 3.18).
As people are pushed away from violence, be it crime or war, people are pulled to places with relative peace and security, be it nearby Costa Rica in Central America, Jordan in the Middle East, or further away in the United States and Europe.
People are also pushed away from places where there is political persecution and pulled to places where human rights and the rule of law apply equally to all. Political push factors can be distinguished from social and cultural push factors by the fact that persecution involves punitive sanctions by a government. Thus, people often flee repressive and authoritarian regimes for fear of arbitrary seizures of financial assets, detention, or arrest and move to stable democracies.
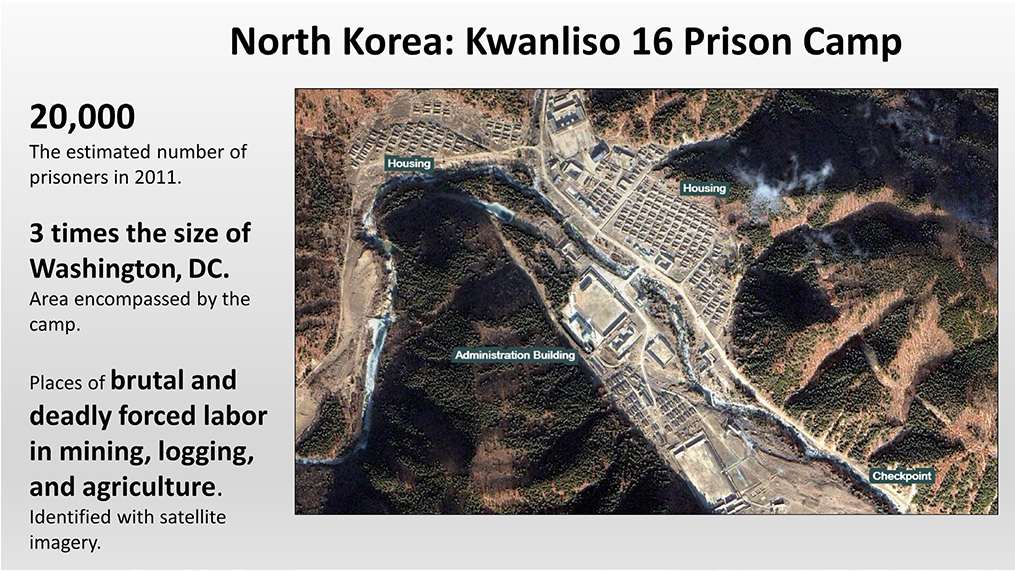
North Korea is probably the most extreme case of political persecution and violation of human rights. Each year, around 2,000 North Koreans flee the country, often migrating to China with hopes of getting to democratic South Korea. Legal emigration is prohibited, so emigration typically involves illegally crossing the border, individually or with the help of human smugglers. In North Korea, no political opposition is allowed, cell phones and other technology that can communicate with the outside world are illegal, and criticism of the leadership is prohibited. Punishments include torture, execution, and lifetime imprisonment with hard labor. In some cases, entire extended families are sent to prison camps for the actions of one family member. An estimated 80,000 to 120,000 people are in these camps, which are plagued with high death rates from poor nutrition, lack of medical care, mistreatment by guards, executions, and backbreaking work (figure 3.17).
As another example, Russian emigres have cited anti-LGBT laws and political persecution as reasons for being pushed away from their country. A 2013 law banned “propaganda of nontraditional sexual relations” toward minors, which many interpreted as a means of persecuting Russia’s LGBT community. In other cases, members of opposition political parties have faced what they see as trumped-up criminal charges and harassment by the police in response to their criticism of government policies. In some cases, opposition figures have been found shot dead.
In recent years, journalists’ and opposition political activists’ fear of detention has also spurred emigration from other authoritarian-leaning countries, such as Venezuela, Turkey, and Cuba. Typically, people who are pushed away from countries because of political conditions choose to migrate to countries with strong pull forces of democracy, protection of individual rights, and the rule of law, such as Western Europe, Canada, and the United States.
Refugees are a specific type of social or political migrant. The United Nations 1951 Refugee Convention defines a refugee as a person who, “owing to a well-founded fear of being persecuted for reasons of race, religion, nationality, membership of a particular social group or political opinion, is outside the country of his nationality, and is unable to, or owing to such fear, is unwilling to avail himself of the protection of that country.” Per international law, the legal rights of refugees are different from the rights of those who are migrating for economic or other reasons. Therefore, most countries have systems for evaluating refugee claims and admitting those deemed to fit the definition.
In the United States, for instance, refugee status has been given to Cubans facing political persecution under the communist Castro regime, Christians and Jews fleeing the Islamic Republic of Iran, and Iraqis and Afghans who assisted the US military.
Around 2014 to 2016, Europe faced one of the largest refugee migration flows since World War II. Because of conflict in Syria, Iraq, and Afghanistan, large numbers of people started migrating in search of asylum (figure 3.18). Over one million immigrants crossed the Mediterranean Sea, with the majority arriving in Greece, followed by Italy. The journey proved fatal for thousands, as smugglers sent them in overcrowded boats of questionable quality. In one single incident, over 800 people drowned when a boat sank while crossing from Libya on its way to Italy. Hundreds of thousands more have attempted to take land routes through Turkey and Eastern Europe in attempts to reach countries such as Germany and Sweden. While the majority of the refugees were from Syria, Afghanistan, and Iraq, people from other parts of Southwest Asia and Africa also immigrated. Syrians were given priority for refugee status because of a brutal civil war, while most others faced rejection as economic migrants.
But while news reports in the West often focus on refugees immigrating to Europe and North America, the vast majority of refugees, 86 percent, reside in developing countries (figure 3.19), largely due to the concept of distance decay discussed in chapter 1. Given that there is more spatial interaction between two places that are close together, it is most likely that refugees facing push forces in developing countries will migrate to another developing country nearby. Life for refugees in developing countries can be difficult. Developing countries do not have large sources of revenue to assist those in need and strong economies to absorb many immigrants. Sometimes, the United Nations assists with funding refugee camps, but often there are many more refugees than space in the camps. Too often, adults lack jobs and children lack schools. In 2016, one estimate showed that 80 percent of Syrian children in Turkey did not attend school. Often, children must work to support their families, with some working twelve-hour days for US $60 in weekly wages. Unable to fully integrate into host countries and unable to return to their home countries, many refugees remain in precarious positions for years, leaving children with limited education and limited opportunities for the future.
Environmental push and pull
In addition to the economic, social and cultural, and political push and pull forces directly caused by humans, environmental conditions drive migration. In the most benign form of environmental push and pull, people can be pushed away from areas with uncomfortable climates and pulled to places with pleasant climates. For instance, since the 1970s, population growth in the US southern and western Sun Belt states has increased at a faster rate than in the Snow Belt states of New England and the Midwest.
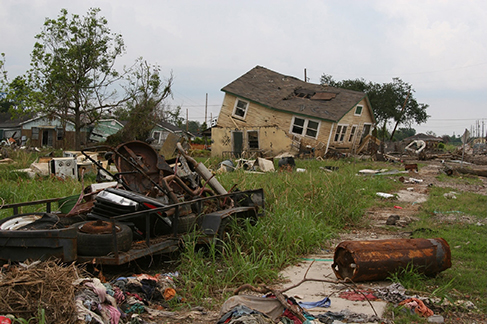
But the environment can also cause migration for more serious reasons. Natural disasters can drive people away, as in the case of New Orleans after Hurricane Katrina in 2005 (figure 3.20). Because of that natural disaster, over 200,000 people moved out of New Orleans after 80 percent of the city was flooded. Many people who left never returned. By 2014, the city’s population had nearly recovered, as some emigres returned and new residents moved in, but it remained somewhat below pre-hurricane levels nevertheless.
Droughts and resultant crop failure and famine can also push people to migrate. For example, during nearly a decade in the 1930s, drought conditions in the Plains states created the Dust Bowl, which forced millions of people to move to other parts of the United States.
While refugees fall under the social and political migrant categories, internally displaced migrants are more broadly defined as including those displaced by armed conflict, human rights violations, and natural disasters. Those who are internally displaced have not crossed an international border, yet have been pushed away from their regular place of residence.
The severity of internal displacement caused by natural disasters relates to a society’s degree of vulnerability. Vulnerability is the level of susceptibility to harm people have when exposed to a disaster. At the individual scale, this relates to characteristics such as income, age, mobility, and gender. For example, the poor and elderly may be more vulnerable to harm when displaced by an earthquake, as they struggle more than others to obtain food and shelter.
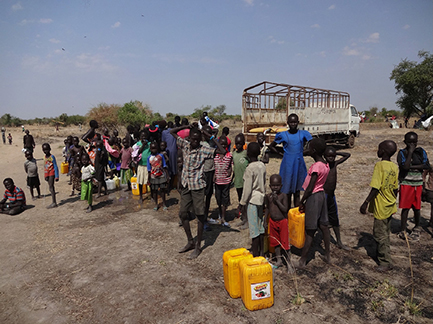
Vulnerability also varies at smaller scales, such as by country. Countries differ on a range of factors, such as political stability, level of economic development, and more. A society will be more vulnerable to natural disasters, such as drought, when it is intertwined with poverty, political instability, and armed conflict. For instance, both Afghanistan and South Sudan had over one million internally displaced people in 2015 due to both armed conflict and drought conditions, while Ethiopia had nearly 300,000 (figure 3.21). All of these countries are poor, with governments that lack resources to end conflict and improve agricultural infrastructure.
When armed conflict and natural disasters occur in the same place, internal displacement can be much more severe. In some cases, drought worsens or causes armed conflict. In the case of Ethiopia in 2015, drought conditions led pastoralists to move livestock onto lands traditionally use by pastoralists from different tribes. This led to armed conflict between tribes over increasingly limited pasture land for their livestock.
In other cases, armed conflict can worsen impacts from drought, leading to or exasperating internal displacement. During conflict, food and agricultural aid may not be able to reach people in conflict zones. This lack of aid can force many of them to move to new areas.
Residents of richer countries, such as the United States, are less vulnerable overall when disaster strikes. More people have insurance that can help cover losses from floods and fires, while the US government is better equipped to assist with food and shelter. Not only can richer countries respond more effectively to disasters, but disasters are less likely to occur in the first place. For instance, richer countries have better irrigation systems to reduce vulnerability to drought, buildings are better built and thus resist earthquakes, and fire departments are better equipped to control wildfires. For these reasons, internal displacement from disasters tends to be less severe and for a shorter time in more developed countries. However, those who are more likely to be internally displaced and remain that way for a longer period tend to be individuals who are more vulnerable because of poverty, old age, and other socioeconomic characteristics.
Forced and voluntary migration
Push and pull forces are often discussed in terms of migration that is forced or voluntary. Generally, economic migration is seen as voluntary. While some people may feel forced to move due to unemployment or a lack of economic opportunity, for the most part, people are free to choose whether or not to migrate. For this reason, those deemed economic migrants are rarely given refugee status or counted as internally displaced persons.
People who migrate because of armed conflict, persecution, or environmental disasters, however, are more often seen as part of forced migration. People in this category are more likely to receive refugee status or be counted as internally displaced people. During the European migrant crisis of 2015−16, countries of the European Union struggled to separate migrants who were forced by warfare or persecution to flee to Europe from those who arrived as voluntary economic migrants. In general, Syrians fleeing civil war were regarded as forced migrants and given priority for refugee status. Others, such as those from Afghanistan and countries of North Africa, were classified as economic migrants and denied legal entry.
In reality, the difference between forced and voluntary migration can be blurred, and it can be difficult to fit migrants into just one category. Migrants search for security and opportunity for themselves and their families. Poor economies and insecurity often go hand in hand, so teasing out who migrated primarily because of risk to their safety and who migrated primarily for economic opportunity is difficult in most cases.
Go to ArcGIS Online to complete exercise 3.2: “Push and pull forces.”
Spatial interaction and migration
Understanding how some places push migrants to leave and other places pull migrants in is an important first step in understanding migration patterns. But once migrants decide to leave a place, they typically have more than one choice of where to move to. Thus, is it important to return to the idea of spatial interaction between places.
Distance decay and intervening obstacles
While differences between places in terms of economic, social, political, and environmental characteristics are powerful determinants of migration, intervening obstacles lie between places. These obstacles can direct the flow of migration between different places. One important obstacle is distance. As you recall, distance decay refers to the tendency for spatial interaction to occur more between places that are close together than between places that are far apart. Interaction decays, or declines, as distance increases between two places. Thus, the farther two places are from each other, the more difficult it is to migrate between them. With distance come increases in costs and the potential for risk to life and limb. Economic costs for transportation will be higher if one wants to migrate a greater distance. Similarly, cost in time will increase. Risk can also increase with distance, with greater odds of becoming the victim of crime, being stopped by government authorities, or facing inclement environmental conditions, such as dangerous extremes of heat or cold.
To use the example of Syrian emigrants again, many more migrated to nearby Jordan, Lebanon, or Turkey than to Europe. As these countries lie adjacent to Syria, costs in terms of money and time were much less than the costs of migrating to Europe. Furthermore, short moves by land to these countries were much safer than attempting dangerous crossing of the Mediterranean Sea.
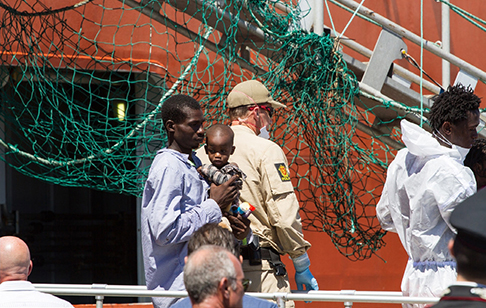
The dangers involved with migrating longer distances are also evidenced by those who make their way from sub-Saharan Africa north to Libya as they attempt to reach Europe. Migrants are frequently abducted by criminal gangs to be held for ransom and beaten until family members pay for their release. Those who cannot pay are forced to work as slaves, and sexual abuse and forced prostitution is common. Upon arrival in Libya, they are held for weeks or months in squalid housing with limited food and water until a boat is ready to take them across the Mediterranean Sea. Even after embarking for Europe, the risks continue. Too often, overcrowded boats sink, killing dozens or hundreds of people (figure 3.22). In other cases, the Libya coast guard detains migrants and sends them to detention centers that are little better than where they were held by smugglers. People risk their lives to migrate when push and pull forces are strong enough, but long distances can present incredible risk.
Because of the power of distance decay, most international immigration is intraregional. For instance, 52 percent of African migrants live within Africa, 60 percent of Asian migrants live within Asia, and 66 percent of European migrants live within Europe. The only exception to the pattern is with Latin American and Caribbean migrants, 70 percent of whom migrate to North America.
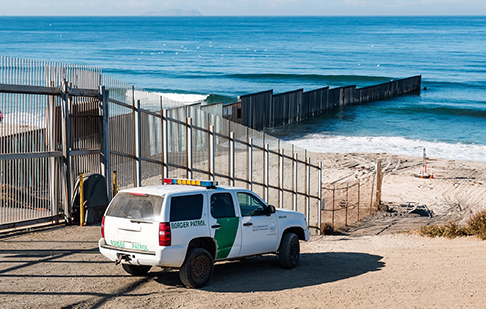
Physical barriers, both natural and human-built, can also act as intervening obstacles. Natural barriers, such as mountains, rivers, deserts, and oceans, limit the movement of people between places. Likewise, human-built physical barriers, such as walls, can also restrict migration. No doubt there would be more Cuban immigrants in the United States if the countries were not separated by ninety miles of ocean. Likewise, fences, cameras, motion sensors, and other security barriers along the US-Mexico border severely limit the number of people crossing there (figure 3.23).
In addition, government immigration policies can create intervening obstacles. Restrictive policies in destination countries and in-transit countries can limit the flow of migrants. Conversely, open immigration policies, or policies that actively recruit migrants, will increase flows. More on immigration policies is discussed later in this chapter.
The concept of cultural distance can also play a role in migration patterns, as people tend to move between places with similar cultures. As discussed in the section on push and pull forces, flows of migrants tend to be greater between places with the same language and religion (figure 3.24). English speakers tend to migrate more between the United States, Great Britain, Australia, New Zealand, and Canada, while Arabic speakers move more between the countries of North Africa and the Middle East. This also holds true for former European colonies. A significant number of migrants from the former French colonies of Algeria and Vietnam migrated to France, while the same occurred with Great Britain and its former colonies, such as India, Pakistan, Hong Kong, and Nigeria.
The gravity model
The gravity model adds another component to the analysis of migration flows: size. Based on the ideas of Isaac Newton, the gravity model states that both distance and size will influence the flow of migrants between two places. The degree of migration between two places is proportional to the population size of each place and inversely proportional to distance. In essence, places with large populations that are close to each other will have large migration flows between them, while places with small populations that are far from each other will have small migration flows between them. Mexico and the Philippines are both developing countries and have populations around 100 million, yet Mexico sends many more migrants to the US. This is because Mexico is much closer, so migration is less costly in terms of time and money. By contrast, China sends more migrants to the US than does Nicaragua. Nicaragua is much closer to the United States, but the large population of China means that there is more spatial interaction with the US in terms of migration. Out of a population of nearly 1.4 billion people, even a small emigration rate represents many migrants.
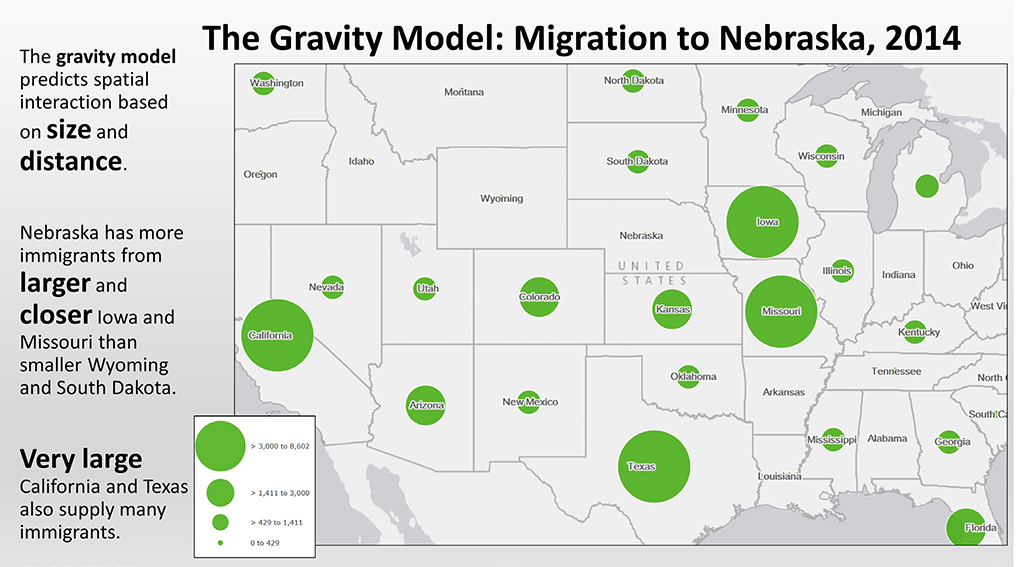
Evidence of the gravity model at work can be seen in interstate migration within the United States. Using the example of Nebraska, located near the center of the country, we can see that more immigrants came from nearby Iowa and Missouri, two states that also have populations larger than many other surrounding states (figure 3.25). These migration flows would be predicted by the model, based on both distance and population size. Being nearby, people from these states will have more information on the economic opportunities in Nebraska, and the costs associated with moving and with return visits to friends and family will be lower. At the same time, we see evidence of population size playing a large role in where immigrants to Nebraska came from. Both California and Texas were the origins of many of these immigrants. With their large populations, these states have a larger pool of potential emigres. Inevitably, some of the immigrants will relocate to other states, some nearby but others farther away.
Social networks and information flows
Distance, intervening obstacles and population size influence migration patterns, but these flows are further complicated by social networks and information flows from individuals and the media that connect specific places. When migrants make the decision to leave a place because of push forces, they do not consider all potential destinations. Rather, they base their decisions on available information. This information is inherently incomplete and is dependent on social connections and media sources. Information flows are enhanced when places have economic or political ties. For example, linkages formed through trade and investment, colonization and political influence, and cultural connections can facilitate information flows and lead to migration.
Media information can come from advertisement campaigns that promote the economic benefits of a place as well as images in newspapers, magazines, television, and online (figure 3.26). Many people around the world have seen media images of the United States and Western Europe and their high levels of economic development. Partially due to these images, there are always large numbers of migrants who desire to move to these places.
Media images also shape migration patterns at more regional and local scales. For example, many Zimbabweans have migrated to South Africa on the basis of information that the economic situation there, while difficult, was more stable than in Zimbabwe. Likewise, within the United States, media information flows impact migration. Many Californians have migrated to Texas, partially because of Texan media campaigns promoting the state as an affordable destination with a strong pro-business government. On the other hand, Texans also move to California, no doubt in part because of media images of beaches and a year-round pleasant climate.
Aside from media images, social connections also play a powerful role in information flows and resulting migration patterns. Pioneer migrants are the first migrants to arrive in a new place. These trailblazers may arrive for any number of reasons: for university studies, a chance job opening, a romantic partner, or a search for novelty and adventure. They tend to be young and single, without family and financial responsibilities that tie them to their home place. These pioneer migrants then provide information to friends and family. Through letters, phone calls, email, and social media, they can share information on their lives in a new location, including job and wage information and quality of life. If those friends and relatives then feel push forces in their place of origin that are strong enough, they are more likely to be pulled to the place about which they have positive information.
Once social networks between pioneer migrants and their place of origin take hold, chain migration can begin. Friends, family, and neighbors begin to migrate to where pioneer migrants have established a foothold. Early migrants smooth the process by helping new migrants find work and housing. New migrants then pass information on to their own friends and family back home, further reinforcing and deepening social network connections. As time progresses, chain migration can create substantial migrant enclaves in specific parts of a city or region.
In the case of Long Beach, California, Cambodia Town formed through this process. In 1975, Cambodians fleeing the genocidal Khmer Rouge that had taken control of Cambodia were brought as refugees to Camp Pendleton marine base south of Los Angeles. A small group of about ten Cambodian families that lived in Southern California formed an organization to assist the refugees. The organization was based in Long Beach, and soon Cambodian families began moving into the city for its relatively affordable housing and mild climate that allowed for year-round gardening. This group of Cambodians then began sharing information about the city with Cambodian refugees in other parts of the US and abroad. These informational flows were more powerful than the US Office of Refugee Settlement, which tried to disperse Cambodian refugees in smaller clusters around the US. As word spread about the benefits of living in Long Beach and the presence of a growing Cambodian cluster, more Cambodians migrated to the city. Long Beach now has an officially designated Cambodia Town, with a thriving community of stores and services that serve the Cambodian population. Immigrant communities throughout the US and around the world form in a similar way, as a small group of pioneer migrants share information and assist the next wave of migrants, ultimately forming strong migration chains between two specific places.
Through cumulative causation, migration flows increase in strength over time. This is the process whereby migration becomes self-sustaining from ongoing positive feedback between immigrants and their place of origin. Early migrants transform places, making them more inviting for new immigrants as businesses open that cater to them and social networks for jobs and housing develop. At the same time, remittances sent to family in the place of origin provide financial resources for more people to emigrate. At a certain point, emigration can become the cultural norm, where all of those who are capable are expected to migrate.
Social and media networks have only become stronger in recent decades. For much of human history, information flows between places were slow, traveling by word of mouth or by handwritten letters. With the invention of the telegraph and later the telephone, information could travel more quickly, but costs and accessibility to these technologies were limited. In recent years, however, communication technology has reached the point that costs have fallen dramatically and accessibility has increased. Low-cost cell phones and internet cafés around the world link people in ways that were never before possible. Migrants can maintain contact with friends and family on a regular basis and share information about job opportunities and quality of life in their new home at limited costs.
Go to ArcGIS Online to complete exercise 3.3: “Refugees.”
Characteristics of migrants
Rubenstein’s pioneering work on migration in the 1800s included the observation that females migrate more than males. While that was true for Great Britain in the nineteenth century, it is not a fixed rule that applies to all times and places. Nevertheless, Rubenstein was correct in that the demographic profile of migrants is not representative of their place of origin. Except in the case of forced migration, where entire populations are forced to move, the characteristics of migrants will differ from the general population they come from in terms of age, sex, education, skills, marital status, and housing situation. This migrant selectivity reflects the fact that migrants are not randomly selected from their place of origin. Rather, certain subgroups are more likely than others to migrate.
There are few fixed patterns in the characteristics of migrants, except for age. People in their late teens through mid-30s are disproportionately likely to migrate (figure 3.27). There are many reasons why young people are more likely to move. They are at an age for seeking new job or educational opportunities, they may marry and follow a spouse’s opportunities, they are less likely to be tied to a home mortgage, they are in better physical condition, and they often have a more adventurous mindset.
Looking at global migrant stock, 72 percent are age 20 to 64, whereas only 58 percent of the total world population falls within this age range. This reflects young adults who migrate and stay abroad during their working years. Upon retirement, some return to their place of origin.
Other than age, the characteristics of migrants can vary based on the place of origin and place of destination. While the sex ratio of migrants to the US is relatively even, in other cases the sex ratio of migrants can be highly skewed. Of those seeking asylum in Europe during 2014–15, fully 73 percent were men. Likewise, a disproportionate number of men migrate to the Middle East to work in the oil and construction industries. In 2015, 75 percent or more of immigrants living in the United Arab Emirates, Oman, and Qatar were men (figure 3.28). On the other end of the spectrum, women constitute a larger proportion of immigrants in parts of the former Soviet Union. Women represented close to 60 percent or more of the migrant population in Moldova, Latvia, Estonia, Kyrgyzstan, and Armenia, and Montenegro in 2015. This higher percentage of female immigrants occurred because the region’s growing middle class sought domestic help, such as nannies, nurses, and cleaners.
The education level of migrants also varies from place to place, depending on market needs and government immigration policies. Domestically, those with less than a high school education in the United States between 2010 and 2015 were the least likely to move from state to state. This is likely due to a lack of opportunity for those with limited education. Migrating away from one’s social network of friends and family with limited job prospects means that this group tends to stay close to home.
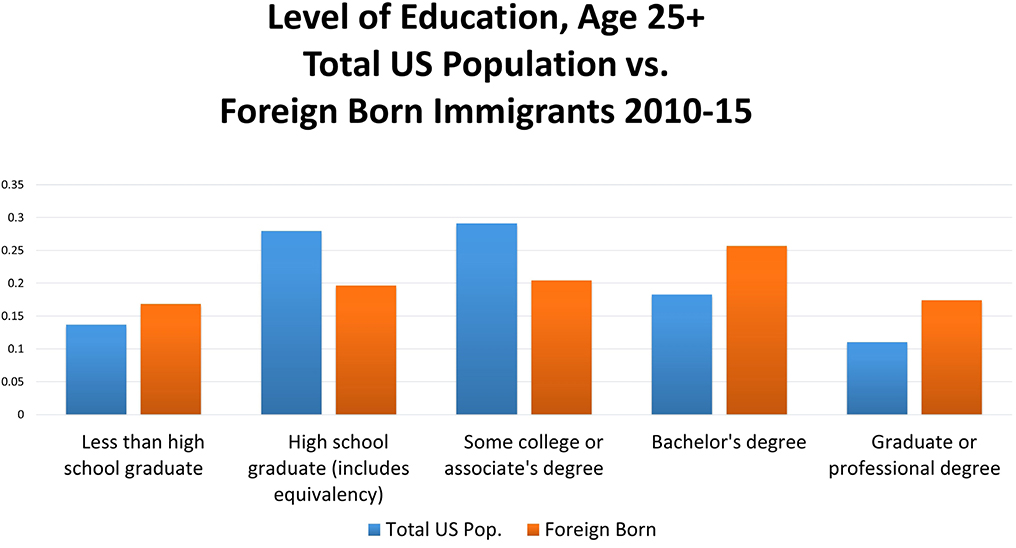
Foreign immigrants to the United States between 2010 and 2015 differ from the overall US population in terms of education levels. As seen in figure 3.29, a disproportionate number had less than a high school education compared to the entire US population, and a disproportionate number had bachelor’s and graduate degrees. This reflects a demand for low skilled workers in sectors such as agriculture, construction, and domestic work as well as a demand for skilled workers in technology, health care, and other knowledge-based industries. The distribution of education varies by place of origin, with about 52 percent of recent Mexican immigrants to the United States in 2013 having less than a high school education and over 57 percent of Asians and 61 percent of Europeans having at least a bachelor’s degree.
Immigration control and government policy
Who migrates and where they migrate to is heavily influenced by government immigration policies. Even though a place may have strong pull forces, governments typically try to regulate the flow of immigrants for political and economic reasons.
US immigration policy
For most of the history of the United States, the government has enacted policies to regulate the number and/or characteristics of immigrants. Early legislation did not restrict the number of immigrants but rather focused on who could become a US citizen. The 1790 Naturalization Act limited citizenship to “free white persons” of “good moral character.” This was the first legislation that attempted to control the racial or ethnic makeup of the country by limiting who could become a citizen. Citizenship rules were changed with the Naturalization Act of 1870, in which African Americans were given citizenship rights along with whites. However, Asians remained excluded.
The Immigration Act of 1875 placed the first restrictions on immigration, not just citizenship, by prohibiting criminals and forced Asian laborers. In 1882, the Chinese Exclusion Act was passed, and in 1917, immigration was banned from most other Asian countries. During this period, restrictions other than those based on race and ethnicity were put in place as well, including bans of anarchists, beggars, polygamists, “lunatics,” illiterates, prostitutes, and those with contagious diseases.
From around 1880, immigration shifted away from Northern and Western Europe toward Southern and Eastern Europe (figure 3.30), prompting fears of a changing ethnic profile among many Americans. This resulted in the 1921 Emergency Quota Act, which placed numerical limits on immigration by creating quotas equal to 3 percent of the foreign-born population based on the 1910 census. It also placed a cap on the total number of immigrants per year. Asian immigration was not allowed. Even more restrictive quotas were enacted with the Immigration Act of 1924, which limited European immigration to 2 percent of the foreign-born population based on the 1890 census. It reduced the total number of annual immigrants and continued to bar Asian immigrants. These quotas were strongly biased in favor of Northern and Western European immigrants, who dominated the US population in the 1890 and 1910 censuses.
It was not until 1943 that some Asians were allowed to legally immigrate and become citizens. During that time, a small number of Chinese immigrants were allowed (105 per year), and Chinese residents could become naturalized US citizens. This change in immigration law occurred, in part, because anti-Chinese sentiment subsided somewhat with World War II, as the United States fought alongside Nationalist forces against the Japanese (figure 3.31). Finally, in 1953, with the Immigration and Nationality Act, all race restrictions were removed from immigration policy. Quotas remained but were open to all countries and were based on each nationality’s population from the 1920 census. Naturally, this policy continued to favor Northern and Western Europeans, whose numbers were greater in the 1920 census.
From the 1950s onward, the national quota system was loosened and disconnected from nationality numbers in the census. Immigration policy gave priority to family reunification and skilled workers. With the Immigration Act of 1990, a global annual quota was established, excluding immediate family members of current US citizens. The quota is divided into categories, including family members, such as adult children and siblings of US citizens, and skilled workers and investors. Refugee quotas are set separately by the president and Congress each year. Lastly, about 50,000 annual visas are granted as part of the Diversity Program. This program allows residents of countries that send lower numbers of immigrants to the US to apply for a visa lottery.
In line with the concepts of distance decay and the gravity model, changes away from immigration policies that favored Europeans led to a steady increase in legal immigration from Latin America, with a sharp rise in the 1980s and 1990s (figure 3.32). Likewise, Asian immigration, largely from China, India, and the Philippines, increased significantly from the 1960s and 1970s on (figure 3.33).
Since the 1980s, several laws have focused specifically on illegal immigration and enforcement. In 1986, the Immigration Control and Reform Act granted “amnesty” to 2.7 million people living without legal residency in the US. In an effort to discourage further illegal immigration, sanctions were established for employers that knowingly hired illegal immigrants. The program largely failed to stem illegal immigration, however, as the estimated five million illegal immigrants living in the United States at that time continued to increase. The law’s ineffectiveness was attributed to a number of factors. First, business groups watered down requirements for employers to confirm legal residency. Second, border enforcement funding was slower to be appropriated than expected. And third, there was no change to the quantity of legal employment visas granted. Thus, the push and pull forces driving immigration continued, but without a legal mechanism for the flow of people to be regulated.
Due to these failures, additional legislation in 1996 increased worksite enforcement and limited social welfare benefits for illegal immigrants. It also enhanced border enforcement and authorized fences along sections of the US border. After 2001, immigration legislation focused on border security. Immigration authority was brought under control of the Department of Homeland Security, and authorization for additional border fencing was established (figure 3.34).
It is estimated that the illegal immigrant population in the United States peaked in 2007 at about 12.2 million people. Since that time, the number has decreased to just over 11 million. Increased border enforcement, along with a sluggish US economy after the Great Recession of 2007 to 2009 and greater economic and political stability in much of Latin America, have all contributed to this decline.
As Congress has blocked comprehensive immigration reform under both the Bush and Obama administrations, the controversy over illegal immigration continues. In 2012 and 2014, executive orders by President Barack Obama aimed to temporarily fix a small part of the problem. These orders, known as Deferred Action for Childhood Arrivals, established temporary deportation relief for young adults brought illegally to the US as minors. They also granted temporary work permits, allowing participants to legally work. However, the policy does not include a path to permanent residency or citizenship.
Immigration policies in other countries
Nearly all countries in the world have government policies to regulate the flow of immigrants, both in terms of numbers and in terms of migrant characteristics. Often, it is countries with the strongest pull forces that have more stringent policies aimed at controlling immigration.
Australia, like the United States, tried to limit nonwhite immigration for much of the twentieth century. After large numbers of Asians immigrated in the mid-1800s in search of gold and to work in agriculture, the Australia government feared that the country would lose its British roots. In 1901, it enacted the Immigration Restriction Act, commonly known as the White Australia Policy, which remained in place until 1958. Today, migrants are admitted first by skills and second by family ties. In addition, Australia has taken a very strict stance on illegal immigration, turning away boats with those trying to enter illegally and using immigration detention centers in other Pacific countries until they can be repatriated (figure 3.35).
Canada also had a “white only” immigration policy from the mid-1800s until 1962 that restricted immigration from Asia. Today, as with Australia, immigrants are admitted on the basis of skills and family reunification. Because of the focus on skills, immigrants to Canada have higher levels of education than the native-born Canadian population.
Japan’s immigration policies have severely limited the foreign population, which was only about 2 percent in 2012 (figure 3.36). Its policies are due to a strong cultural desire to preserve the ethnic homogeneity of the country. Close to half of the immigrant population is of Korean and Chinese descent. This number includes children of these immigrants, who have not become naturalized citizens. As an example of Japan’s quest to preserve its homogeneity, ethnic Japanese from Brazil were admitted to the country when workers were needed in the 1970s and 1980s. Today, very few refugees are accepted, and immigration is based on high level skills.
Many of the Persian Gulf states have migration policies that focus on temporary migrant workers, as opposed to permanent migrants with the possibility of obtaining citizenship. Qatar has a highly unusual population structure that consists largely of males of working age. The high number of males is attributable to the unique migration policies of Qatar and other countries of the Gulf Cooperation Council (Bahrain, Kuwait, Oman, Qatar, Saudi Arabia, and the United Arab Emirates). When oil was discovered in the region during the 1970s, many of these countries had small populations with limited levels of education. Labor was needed to extract oil and help build their new oil-fueled economies, so they turned to foreign temporary workers.
These temporary migrants are largely men from Bangladesh, Indonesia, and the Philippines, who work for low wages in construction and other low-skilled service occupations. They are not given the option of naturalization, and thus they do not bring their families to live in the region. In addition, a smaller number of female migrants are employed as domestic servants. The proportion of temporary migrant workers is so large that they constitute nearly the entire workforce of the private sector, while the majority of Gulf State citizens work in well-paid and secure public-sector positions.
While policies for temporary migration have benefited Gulf countries with low-cost labor and have benefited foreign workers with jobs that pay more than in their home countries, a number of problems have arisen. With the private sector dominated by low-wage foreign workers, many youths in these countries struggle to find employment. And with government budgets impacted by unstable oil prices, employment in the public sector is less assured than in the past. In regard to the foreign workers, there are myriad reports of abuse, including unpaid wages, confiscated passports, dangerous working conditions, and poor-quality food and housing. In addition to these risks, female domestic workers face the risk of sexual assault.
Impacts of migration
The nature of spatial interaction is that people and ideas come together from different places. In the case of migration, this interaction can elicit strong reactions, given the intimate nature of people living in the same space. Both the places that send emigrants and the places that receive immigrants can have beneficial and detrimental outcomes. These impacts are best understood by dividing them into two categories: economic and cultural.
Economic
One of the most commonly debated impacts is how immigration affects the economy of receiving places. Most immigration is driven by the push and pull forces of economic opportunity. Immigration means more workers, which can have several positive impacts. First, more workers mean more economic activity. Employers can more easily hire workers when a plentiful supply is available, and thus businesses can more easily expand operations. Business expansion leads to additional job creation and a growing economy. This expansion is further fueled by an increase in consumer demand. Immigrants not only work but also spend their wages on local goods and services. At the same time, business growth and consumption by immigrants contributes to an increase in tax revenues. These revenues can be used to support health and pension plans and upgrade infrastructure. In places with low birth rates and shrinking populations, immigrants can fill the gap in a shrinking workforce and maintain economic activity.
For these reasons, some see immigration as the best way to save Europe’s economies. Immigration has prevented population decline, as positive net migration has counterbalanced negative natural increase. However, the counterbalance will not be enough to prevent shrinking European populations—it will only delay it slightly. Immigration in Europe will also slow aging of the population and lower dependency ratios by a small amount. By 2050, with current levels of immigration, there will be forty-eight people over age 65 per 100 instead of fifty-one people per 100 if there was no immigration. So, while immigration will help somewhat with offsetting a declining workforce and aging population, it is unlikely to be the region’s salvation. Even higher rates of immigration will be required, or birth rates will have to increase substantially.
But the economic impacts of immigration are not always positive. If an economy cannot absorb the immigrant population and grow at a fast enough pace, tax revenue gains may be offset by an increase in government expenditures. The children of immigrants require more spending on education, which may include extra services for language acquisition and special tutoring. Police and fire services may need to expand to cover a growing immigrant population. Health-care systems can become overburdened. If a place has generous welfare benefits and the immigrant population is lower income, then state expenses can rise. Another negative impact can be employment competition with the native population. If immigrants are willing to work for a lower wage, some native workers may have a harder time finding work or may have to accept lower wage to compete.
Empirical research shows that in the US there is a small, positive effect on the economy due to immigration; however, some negative impacts can affect specific segments of the population. On the positive side, immigrants contribute to economic growth, which raises overall wages for American workers. Immigrants also increase the purchasing power of the native population by lowering the costs of child care, landscaping, cleaning services, and other goods and services from immigrant-heavy sectors. There is a net positive impact on the federal budget when considering taxes paid versus services used by immigrants and their children.
While in the long term, immigrants do not lower native employment rates, there can be a loss of some jobs for natives in the short run, especially among those with lower levels of education. Those with a high school education or less can sometimes face slightly lower wages as a result of immigration as well. Furthermore, some research has shown slightly lower wages for college graduates when immigrants are brought in through high-skilled worker programs. And while there are net benefits to the federal budget, state budgets can be negatively impacted by increases in services to immigrants and their children in the short run. Nevertheless, as immigrants’ children grow and join the workforce, these short-term negative financial impacts disappear.
Migration also has a significant impact on places of origin, which can be either positive or negative. This relationship is often referred to as the migration-development nexus. In the case of international migration, remittances have the most salient impact. Remittances are money sent by migrants from their destination country to family and friends in their country of origin. Some countries are heavily reliant on remittances, which can make up over 20 percent of the gross domestic product (GDP) in some cases, such as Haiti and Liberia (figures 3.37 and 3.38). In 2014, over 40 percent of Tajikistan’s GDP consisted of remittance money. Remittances have been shown to significantly reduce poverty in sending countries, as recipients use the money for daily expenses such as food, clothing, medical care, and education as well as for savings and investment in small businesses.
Immigrants also gain new skills when living abroad, which they can share with friends and family in their country of origin or take with them if they return. Exposure to new technologies, work processes, and management strategies can help improve public and private sector organizations in the country of origin. In best-case scenarios, economic output and government efficiency can increase, while corruption can decrease as returning migrants implement best practices learned abroad.
On the negative side, emigration can lead to a brain drain of highly skilled workers. Education and health care, as well as other sectors of the economy, can suffer if those with higher education emigrate. However, the negative impact of a brain drain can be mitigated if some of these workers return to their place of origin and bring back new skills.
Cultural
While the economic impacts of migration are important for both sending and receiving places, cultural and social impacts can play a major role in migration debates as well. Through relocation diffusion, immigrants bring culture with them. In some cases, such as religion and language, these cultural characteristics can be very distinct from the native population. At the same time, emigration can have significant social impacts on sending countries, causing family stress and other problems.
On the positive side, immigration allows for people to have contact with different cultures without having to travel. Immigrants bring new ideas, new foods, new music, and more that can enrich the destination place. Fusion of foods, music, and fashion in large, multicultural places makes for interesting and exciting trends (figure 3.39). Also, immigration can benefit the native population by making it easier to learn and practice new languages, which can be of help in a globalized world.
But there are negative cultural and social consequences as well. Western Europe has been facing significant cultural clashes with its large immigrant population from North Africa and the Middle East in recent years. Western Europe has a very strong liberal heritage that favors individual rights, gender equality, democracy, separation of church and state, and secularism. Social attitudes tend to be liberal as well, such as toward homosexuality. In contrast, immigrants from North Africa and the Middle East come from very distinct cultures. While new immigrants can adapt to a new social context, ideas from the home country can remain strong for many. Most come from conservative Muslim countries, where religion and the state have close connections. Laws based on religious texts are common and are seen by many as the natural basis of civil law. Homosexuality in these countries is viewed by majorities as morally wrong, and most people from the region believe a wife should always obey her husband. When immigrants bring these views to Europe, problems can arise. The Muslim veil has become a symbol of the clash of cultures. France, which has a long tradition of strict separation of church and state, banned headscarves and other religious symbols in state schools and more recently banned face-covering veils in all public places. Other local governments in Europe have made similar laws, and several countries have considered it. At the same time, anti-immigrant political parties have gained influence (figure 3.40), pushing for more limits on immigration and a perceived Islamization of the region.
Language and immigration can also lead to conflict. For instance, as large numbers of Asians have immigrated to cities just east of Los Angeles, debates over business signage have flared up over the years. Some argue that signs written exclusively in Asian languages risk public safety, since not all police and firefighters can read them. For this reason, there have been proposals to require the inclusion of modern Latin lettering on all business signs. Similar debates over language relate to the extra costs required for bilingual government documents and translation services for immigrants.
High levels of immigration can also lead to a breakdown of social cohesion in a place. When newcomers have a different culture from the native population, people can tend to pull back socially. Levels of trust and social solidarity can decline as people turn to separate and isolated spaces. However, with time, this isolation weakens as immigrants and their children learn the language of their new home.
Sending countries can face negative cultural and social consequences from emigration as well. Family cohesion can be damaged when all are unable to emigrate together. Migrants can face psychological stress and familial bonds can be broken. When parents emigrate but leave their children behind, there can be an increase in risky behavior, with children more involved in drug and alcohol abuse and crime and with lower rates of school attendance. Furthermore, rates of sexually transmitted disease, including HIV, can increase as spouses spend long periods of time in separate locations (figure 3.41).
For all the reasons discussed here, immigration remains a hotly contested political topic in countries around the world. Depending on the data points that one chooses, immigration can help economies or hurt them, bring vitality to a culture or threaten its stability and cohesion. Nevertheless, the push and pull forces that induce people to seek a better life for themselves and their families will continue to drive migration and shape the human geography of our planet.
Go to ArcGIS Online to complete exercise 3.4: “Does immigration increase unemployment?”
References
American Immigration Council. 2016. “How the United States Immigration System Works.” https://www.americanimmigrationcouncil.org/research/how-united-states-immigration-system-works-fact-sheet.
Amnesty International. 2013. “North Korea: New Satellite Images Show Continued Investment in the Infrastructure of Repression.” https://www.amnesty.org/en/documents/ASA24/010/2013/en.
———. 2014. “North Korea: The Inside Story.” https://www.amnesty.org.uk/North-Korea-prison-camp-officials-raped-women-killed-secret.
———. 2015. “Libya: Horrific Abuse Driving Migrants to Risk Lives in Mediterranean Crossings.” https://www.amnesty.org/en/latest/news/2015/05/libya-horrific-abuse-driving-migrants-to-risk-lives-in-mediterranean-crossings.
Association of American Geographers. 2011. “Migrant Selectivity—Migration Conceptual Framework: Why Do People Move to Work in Another Place or Country?” AAG Center for Global Geography Education.
Australian National Maritime Museum. 2014. “Australia’s Immigration History—Waves of Migration.” https://www.anmm.gov.au/discover/online-exhibitions/waves-of-migration.
BBC News. 2017. “The Islamic Veil across Europe.” http://www.bbc.com/news/world-europe-13038095.
Bilak, A., G. Cardona-Fox, J. Ginnetti, E. J. Rushing, I. Scherer, M. Swain, N. Walicki, M. Yonetani, and J. Lennard. 2016. Global Report on Internal Displacement. Geneva, Switzerland: International Displacement Monitoring Centre.
Broomfield, M. 2016. “Pictures of Life for Turkey’s 2.5 Million Syrian Refugees.” The Independent, April 5, 2016.
Castles, Stephen, Hein de Hass, and Mark J. Miller. 2014. The Age of Migration, 5th ed. New York: The Guilford Press.
CBS News. 2016, August 3. “UN: ISIS genocide of Yazidis in Iraq ‘ongoing.’” http://www.cbsnews.com/news/united-nations-says-isis-yazidi-genocide-ongoing-in-iraq.
Central Intelligence Agency. 2018. “Refugees and Internally Displaced Persons.” https://www.cia.gov/library/publications/the-world-factbook/fields/2194.html.
CNN. 2018, August 30. “Hurricane Katrina Statistics Fast Facts.” http://www.cnn.com/2013/08/23/us/hurricane-katrina-statistics-fast-facts.
Cohn, D’Vera. 2015. “How U.S. Immigration Laws and Rules Have Changed Through History.” Pew Research Center. http://www.pewresearch.org/fact-tank/2015/09/30/how-u-s-immigration-laws-and-rules-have-changed-through-history.
Costa, D., D. Cooper, and H. Shierholz. 2014. “Facts About Immigration and the US Economy: Answers to Frequently Asked Questions.” Economic Policy Institute. http://www.epi.org/publication/immigration-facts.
Doran, K., A. Gelber, and A. Isen. 2016. “The Effects of High-Skilled Immigration Policy on Firms: Evidence from Visa Lotteries.” Journal of Political Economy. Goldman School of Public Policy, University of California, Berkeley. https://gspp.berkeley.edu.
The Economist. 2016 “Oh, Boy. Are Lopsided Migrant Sex Ratios Giving Europe a Man Problem?” The Economist, January 16, 2016. http://www.economist.com/news/europe/21688422-are-lopsided-migrant-sex-ratios-giving-europe-man-problem-oh-boy.
The Editors of Encyclopædia Britannica. 1998. “Sun Belt.” Encyclopædia Britannica. https://www.britannica.com/place/Sun-Belt.
Eisenbrey, R. 2015. “H-1B Visas Do Not Create Jobs or Improve Conditions for US Workers.” Working Economics Blog. Economic Policy Institute. http://www.epi.org/blog/h-1b-visas-do-not-create-jobs-or-improve-conditions-for-u-s-workers.
European University Institute. n.d. “Neo-Classical Economics and the New Economics of Labour Migration.” Return Migration and Development Platform European University Institute. http://rsc.eui.eu/RDP/research/schools-of-thought/neo-classical-economics-nelm.
Human Rights Watch. 2016. “World Report 2015: North Korea ” https://www.hrw.org/world-report/2015/country-chapters/north-korea.
———. 2016. “World Report 2015: Qatar.” https://www.hrw.org/world-report/2015/country-chapters/qatar.
Jalabi, R. 2014. “Who Are the Yazidis and Why Is ISIS Hunting Them?” The Guardian, August 7, 2014. https://www.theguardian.com/world/2014/aug/07/who-yazidi-isis-iraq-religion-ethnicity-mountains.
Krogstad, J. M., J. S. Passel, and D. V. Cohn. 2017. “5 Facts about Illegal Immigration in the US.” FACTANK: News in the Numbers. Pew Research Center. http://www.pewresearch.org/fact-tank/2017/04/27/5-facts-about-illegal-immigration-in-the-u-s.
Labrador, R.C., and D. Renwick. 2016. “Central America’s Violent Northern Triangle.” Council on Foreign Relations. http://www.cfr.org/transnational-crime/central-americas-violent-northern-triangle/p37286.
Lanzarotta, M. 2008. “Robert Putnam on Immigration and Social Cohesion.” Global Economic Symposium. Harvard Kennedy School. https://www.hks.harvard.edu/news-events/publications/insight/democratic/robert-putnam.
Lee, Everett. 1966. “A Theory of Migration.” Demography 3, no. 1: 47−57.
Lindstrom, D. P., and A. L. Ramirez. 2010. “Pioneers and Followers: Migrant Selectivity and the Development of US Migration Streams in Latin America.” The Annals of the American Academy of Political and Social Science 630, no. 1: 53–77.
Martin, Philip. 2013. “The Global Challenge of Managing Migration.” Population Bulletin 68, no. 2: 2−15.
National Archives of Australia. 2013. Immigration Restriction Act 1901 (Commonly Known as the White Australia Policy). National Archives of Australia. http://www.naa.gov.au/collection/a-z/immigration-restriction-act.aspx.
National Drought Mitigation Center. n.d. “Drought in the Dust Bowl Years.” https://drought.unl.edu/dustbowl/Home.aspx.
National Geographic Genographic Project. n.d. “Map of Human Migration.” https://genographic.nationalgeographic.com/human-journey.
Needham, S., and K. Quintiliani. 2011. “Why Long Beach?” Cambodian Community History & Archive Project. http://www.camchap.org/why-long-beach.
Organisation for Economic Co-operation and Development (OECD). 2018. “Earnings: Real Minimum Wages.” OECD Employment and Labour Market Statistics (database). doi: https://doi.org/10.1787/data-00656-en.
———. 2018. “Average Wages (Indicator).” doi: http://doi.org/10.1787/cc3e1387-en.
———. 2018. “Wage Levels (Indicator).” doi: http://doi.org/10.1787/0a1c27bc-en.
Pedersen, P. J., M. Pytlikova, and N. Smith. 2008. “Selection and Network Effects—Migration Flows into OECD Countries 1990–2000.” European Economic Review 52, no. 7: 1160–86.
Pew Research Center. 2011. “The American-Western European Values Gap.” Pew Research Center’s Global Attitudes Project. http://www.pewglobal.org/2011/11/17/the-american-western-european-values-gap/.
———. 2015. “Modern Immigration Wave Brings 59 Million to US, Driving Population Growth and Change Through 2065.” Pew Research Center’s Hispanic Trends Project. http://www.pewhispanic.org/2015/09/28/modern-immigration-wave-brings-59-million-to-u-s-driving-population-growth-and-change-through-2065.
Plumer, B. 2013. “Congress Tried to Fix Immigration Back in 1986. Why Did It Fail?” Washington Post, January 30, 2013. https://www.washingtonpost.com/news/wonk/wp/2013/01/30/in-1986-congress-tried-to-solve-immigration-why-didnt-it-work/?utm_term=.7b80deed35a7.
Ratha, D., S. Mohapatra, and E. Scheja. 2011. Impact of Migration on Economic and Social Development: A Review of Evidence and Emerging Issues. Washington, DC: World Bank.
Ravenstein, E. G. 1885. “The Laws of Migration.” Journal of the Statistical Society of London 48, no. 2: 167−235. doi: http://doi.org/10.2307/2979181.
Richardson, V. 2015. “Texas Emerges as Top Destination for Californians Fleeing State.” Washington Times, August 31, 2015. http://www.washingtontimes.com/news/2015/aug/31/texas-emerges-top-destination-californians-fleeing.
Schreck, C. 2015. “Russian Applications for U.S. Asylum Skyrocket In 2015.” Radio Free Europe/Radio Liberty. http://www.rferl.org/a/russia-us-asylum-applications-skyrocket/27345403.html.
Shyong, F. 2013. “Monterey Park Abandons Sign Law Requiring Some ‘Latin lettering.’” Los Angeles Times, December 7, 2013. http://articles.latimes.com/2013/dec/06/local/la-me-1207-chinese-signs-20131207.
Syrian Refugees. 2016. “Syrian Refugees: A Snapshot of the Crisis—in the Middle East and Europe.” http://syrianrefugees.eu.
United Nations. 2016. International Migration Report. New York: United Nations.
United Nations High Commissioner for Refugees. “Refugees.” UNHCR. http://www.unhcr.org/pages/49c3646c125.html.
———. “The Mediterranean Refugees/Migrants Data Portal.” http://data2.unhcr.org/en/situations/mediterranean.
US Department of Homeland Security. 2017. Yearbook of Immigration Statistics 2014. Washington, DC: US Department of Homeland Security, Office of Immigration Statistics.
Winckler, O. 2010. “Labor Migration to the GCC States: Patterns, Scale, and Policies.” Middle East Institute. http://www.mei.edu/content/labor-migration-gcc-states-patterns-scale-and-policies.
World Bank. 2015. “Migration and Remittances Data.” http://www.worldbank.org/en/topic/migrationremittancesdiasporaissues/brief/migration-remittances-data.
Wormald, B. 2013. “The World’s Muslims: Religion, Politics and Society.” Pew Research Center’s Religion & Public Life Project. http://www.pewforum.org/2013/04/30/the-worlds-muslims-religion-politics-society-overview/.
Yeginsu, C. 2016. “In Turkey, a Syrian Child ‘Has to Work to Survive.’” New York Times, June 4, 2016. https://www.nytimes.com/2016/06/05/world/europe/in-turkey-a-syrian-child-has-to-work-to-survive.html?_r=1.
Zelinsky, W. 1971. “The Hypothesis of the Mobility Transition.” Geographical Review 61, no. 2: 219.