Chapter 5
Urban geography
Sometime around 2008, humans became an urban species. For millennia, humans lived in small groups of hunters and gatherers, but with the emergence of agriculture, people began to settle permanently in small villages. Over time, those villages grew in size and population, becoming what we now call cities. By roughly the year 2008, this process led to a majority of humanity living in urban areas. Each year, even larger proportions of the world’s population is urban, with 54 percent living in cities and towns as of 2015 (figure 5.1).
Given that we are now an urban species, geographers are interested in understanding the forms and functions of our cities. This is important in that most of us spend most of our time in urban areas. They are where we live our lives, facing issues such as congested traffic, housing affordability, access to open space, availability of goods and services, employment opportunities, and much more.
The biggest force driving the growth of cities is that they are economic powerhouses. People living and working in close proximity drives innovation and efficiency through the intermingling of new ideas and the sharing of urban resources. The wealth created in cities pulls in migrants from rural areas, who see greater opportunities for education and employment in bustling urban areas.
When cities function well, they can be amazing places to live. Economic opportunity can provide financial security for families, while cultural amenities such as parks, theaters, restaurants, museums, and myriad goods and services can make them exciting and satisfying places to be. But when cities do not function well, they can appear as dystopian worlds. Vast swaths of the urban landscape can consist of cramped slum housing with open sewage and garbage. Crime and corrupt city officials can plague neighborhoods and inhibit economic opportunity. The rich must live in isolated and fortified housing, with private security guards and economically segregated shopping malls. Obviously, geographers and others study cities in order to make them work well for all residents, so that economic opportunity and cultural amenities can be enjoyed by everyone without fear.
Measuring “urban”
When measuring and mapping urban areas, it is important to first understand what is meant by the word urban. As it turns out, there is no fixed definition. Rather, each country, typically via national statistics agencies, establishes its own criteria. These criteria vary and can include population size, population or building density, the proportion of people who work in agriculture, the presence of infrastructure, or any combination of these factors.
For instance, Lithuania, in the Baltics region of Europe, defines urban areas as having closely built permanent dwellings, a population of 3,000 or more, and two-thirds of the workforce in industry and business. Albania, in the Balkans region of Europe, simply defines it as a town or center of more than 400 residents. Peru identifies urban areas as populated centers with 100 or more dwellings, while Egypt simply lists major cities and district capitals. In the United States, urban areas are defined at having 2,500 residents, generally with a density of 1,000 people per square mile or more.
So, while we are an urban species, that does not imply that the majority of people live in large urban areas. Rather, it reflects the fact that human settlements no longer consist of isolated rural homes spread around agricultural regions.
Urbanization refers to the process of urban growth and measures the increase (or decrease) in urban populations. It can be measured in terms of counts and rates, so that for example, between 2014 and 2015, the urban population of the United States grew by 2,591,887 people, resulting in an urban growth rate of about 1 percent. This rate of growth pales in comparison to many developing countries, such as in sub-Saharan Africa, where urban growth rates often exceed 5 percent, or five times that of US cities.
Origin and growth of the city
For most of human history, people lived in small groups of hunters and gatherers. Then, about 10,000 years ago, humans began to settle in fixed places and farm the same land rather than move from place to place in search of wild plants and animals. This was the first step in the development of urban settlements. As agricultural techniques improved, people began to produce surplus food—that above what was needed for themselves and their families. With agricultural surpluses, some members of the community could specialize in activities other than farming. People could take up positions as traders who exchanged surpluses for different foods and items from other farming groups. Others could function as accountants to monitor the types and quantities of traded goods. Still others could take on full-time positions as political leaders of the group, while others could become spiritual leaders. Occupational specialization also included metal and glass workers, soldiers, carpenters, and myriad other activities. These nonfarming functions worked best when people lived close to each other rather than in scattered farmhouses. Thus, human settlements spatially consolidated in denser patterns and evolved into cities.
The earliest cities developed in the Mesopotamia region of modern-day Iraq sometime after 4500 BCE. Cities formed in Egypt around 3000 BCE, and several hundred years later there were cities in the Indus valley of modern-day Pakistan (figures 5.2 and 5.3). Cities first formed in China around 1700 BCE. Later, in Mesoamerica, the Zapotec and Mixtec cultures began building cities around 800 to 700 BCE.
But while cities were evolving in many parts of the world, the proportion of people living in them remained small until very recently. Estimates vary, but up until the 1800s, only about 5 percent or less of the world population lived in urban areas. Until recently, there were few large cities. In 1360 BCE, only Thebes, Egypt, had a population of 100,000 people. By 100 CE, Rome had over 500,000 residents, but no city reached one million until Beijing, China, around 1800.
During the 1800s, cities began to grow rapidly in connection with the industrial revolution. During this time, mechanization in agriculture reduced the need for manual labor in the field, while mass-production industry came to rely on large numbers of urban-industrial workers. While roughly 5 percent of the world population lived in cities in 1800, by 1900, the number had risen to over 13 percent. Likewise, while one city, Beijing, had a population of one million in 1800, by 1900 there were sixteen cities of that size while four cities had a population of two million, and one, London, of five million.
More reliable data on the urban population is available from the second half of the twentieth century. Since then, the proportion of people living in urban areas has grown steadily, from about 34 percent in 1960 to 54 percent in 2015 (figure 5.4).
Spatial distribution of cities at a global scale
While over half of the world’s population now lives in urban areas, the spatial distribution of urban populations is uneven. Given that urban areas are engines of economic growth, high-income countries are also the most urban (table 5.1). Countries with lower levels of per capita income tend to be less urban, as larger proportions of people work in low-wage and low-productivity agricultural jobs.
Urban levels also vary by region. Despite that early cities developed in Mesopotamia and Egypt (Middle East and North Africa), the Indus Valley (South Asia), and Northern China (East Asia and Pacific), these regions are not the most urban today (table 5.2 and figure 5.5). North America and countries of the European Union are highly urbanized, largely due to rapid industrial growth during the twentieth century. Latin American urbanization occurred somewhat later, so that while the region was less than one-half urban in 1960, by 1990, it had surpassed the European Union as economic opportunity pulled migrants to cities from rural areas.
Urban growth rates vary substantially around the world as well, generally with higher growth seen in places that are less urban. For instance, the largely urbanized European Union saw an urban growth rate of less than 1 percent in 2015 (table 5.2). This stands in stark contrast to sub-Saharan Africa, where cities grew by over 4 percent, more than seven times the rate of European Union countries.
This variation in urban growth rates is due to two major factors: natural increase and migration. Cities grow when the urban crude birth rate is larger than the crude death rate and when there is positive net urban migration.
As discussed in previous chapters, the natural increase rate changes as countries move through the demographic transition. Lower-income countries with fewer urban populations are more likely to be in stage 2 of the demographic transition. Birth rates there are higher, even for urban residents, who still follow the reproductive norms of the countryside. This is the situation in many quickly urbanizing parts of Africa, the Middle East, and Asia.
As economies develop and people shift from agrarian work in rural areas to industrial and service positions in cities, birth rates eventually fall. As you'll recall, a decline in birth rate results from lower infant mortality rates, improved educational and career opportunities for women, and the higher economic cost of raising children in urban areas. With fewer babies being born in urban areas with these characteristics, such as in North America and Europe, growth rates are lower.
Countries that are highly urbanized also have less rural to urban migration. Mass migration from farms to cities in North America and Europe happened early in the twentieth century, while the same process occurred in the later twentieth century in Latin America. But in places that still have large rural populations, migration to cities is substantial. Many countries with low urban percentages are just now following in the footsteps of higher-income countries, with many people moving away from rural agricultural work to urban industrial and service jobs. High rural birth rates further contribute to pressures to migrate to the city.
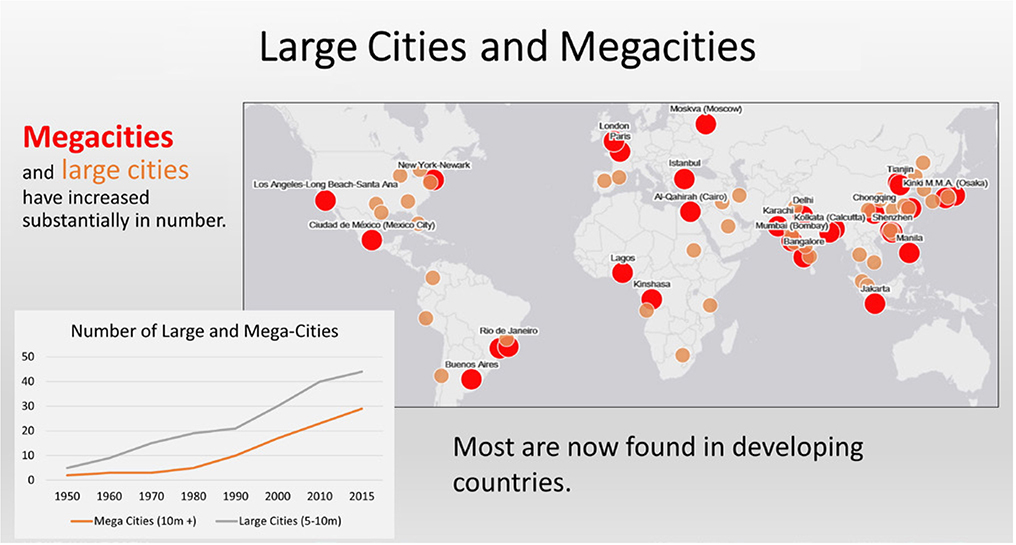
Dividing urban areas into categories by population size, several trends can be seen. First, megacities, those with ten million residents or more, have been increasing steadily in number (figure 5.6). Whereas there were only two megacities in 1950 (New York and Tokyo), by 2015, there were twenty-nine. Furthermore, while megacities were found in more developed countries initially, by the year 2000, the majority were located in developing countries, such as Mexico, Brazil, India, and China.
Second, large cities, those with five to ten million inhabitants, have also grown rapidly (figure 5.6). In 1950, there were only five cities of this size (London, Osaka, Paris, Moscow, and Buenos Aires). By 2015, this number had increased to forty-four. As with megacities, the majority of large cities are now located in developing parts of the world. These tend to be the places with large national populations that are coalescing into urban areas as migrants leave the countryside or the places with rapidly growing populations in both rural and urban places.
The gravitational pull of megacities and large cities exerts significant influence on national economies as well as the global economy, drawing in disproportionate amounts of investment and people. Rapid growth in these urban areas presents myriad opportunities and challenges. Economic opportunities tend to be greater in these cities, but so do problems with affordable housing, transportation, income inequality, and too often, crime.
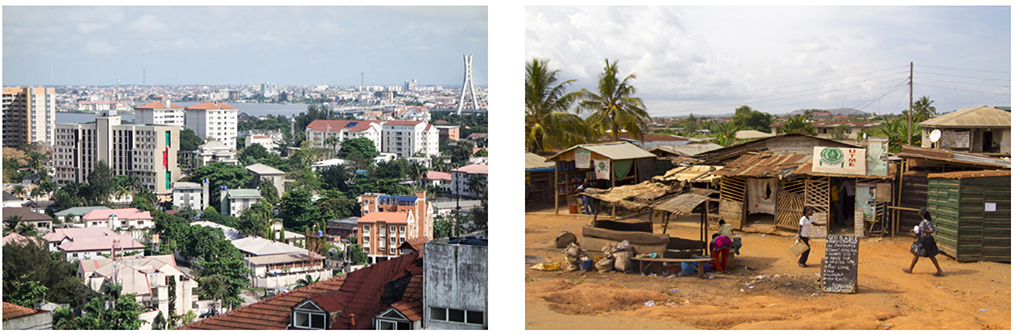
Lagos, Nigeria, Africa’s largest megacity, illustrates these issues well (figure 5.7). It dominates Nigeria’s economy, comprising over 15 percent of GDP; is a regional banking center and home to the country’s business and political elite; and draws migrants in search of a better life from around the region. Yet, at the same time, it has struggled to accommodate growth. Many residents live in self-built housing with limited connections to infrastructure. For instance, in 2008, only 5.4 percent of households had access to piped water, while nearly 44 percent of homes were not connected to sewerage systems. And while the city offers economic opportunity, income inequality is immense. Multimillionaires live close to the urban poor who struggle to find enough daily food.
The third broad trend involves small and medium cities—those with less than one million residents—which are growing at the fastest rates. While less well known than their larger urban siblings, these are the places where most of the world’s urban population lives. As these cities draw in people and investment, they too face increasing challenges in housing, transportation, and the provision of infrastructure and public services.
Go to ArcGIS Online to complete exercise 5.1: “City growth rates: Where are opportunities for businesses and development organizations?”
Spatial distribution of cities at a regional scale
Moving to a larger scale of analysis, geographers have developed different models and theories to explain patterns of cities by size and by spatial location within countries and regions.
Urban hierarchy
Cities can be described as part of an urban hierarchy, typically based on population size. Clearly, cities within a country differ by population. For instance, in the United Kingdom, London is much larger than Birmingham, which is larger than Leeds. Moving further down the urban hierarchy are cities such as Oxford and Cambridge. Finally, at the bottom of the hierarchy are small towns and villages.
Interestingly, the distribution of cities by size tends to follow a regular pattern. The rank-size rule says that there is an inverse relationship between city population and its rank in the urban hierarchy. This relationship can be calculated using Zipf’s law, which posits that the second-largest city in a country will be half the size of the largest city. The third-largest city will be one-third the size of the largest city, and so on. An inverse linear relationship is clear when plotted logarithmically. This relationship can be seen using United Nations data for urban agglomerations of over 300,000 people. In 2015, the largest urban agglomeration in the United States was New York, with a population of 18,593,000. According to Zipf’s law, the second largest urban area, Los Angeles, should have a population that is half the size of New York, which would be 9,296,500. In reality, the population of the Los Angeles area was 12,310,000, somewhat higher than expected. Nevertheless, when 135 US urban areas are plotted using Zipf’s law, there is a very close fit to the expected straight line predicted by the model (figure 5.8).
Zipf’s law provides a good description of urban areas in many parts of the world, but not all fit the model. Some countries are dominated by a primate city. Primate cities are those that are much larger than all other cities in a country. Typically, as per Zipf’s law, they are at least twice as large as the next largest city. They have larger populations and are typically the national political, economic, and cultural centers. They contain all important urban functions, such as government, education, arts and entertainment, manufacturing, and business and consumer services.
France provides a good example of the primate city phenomenon (figure 5.9). The Paris urban agglomeration had a 2015 population of 10,843,000. If French cities followed Zipf’s law, the next-largest city, Lyon, would have 5,421,500 residents. But, in reality, Lyon had only 1,609,000 inhabitants, which is well below the expected value. Paris dominates the French state as its primate city. It is the political capital of France and the location of most central government functions. While manufacturing is more spread throughout the country, most headquarters are located in Paris. Likewise, it is the center of the financial industry, insurance, technology, and multinational corporations. Top universities that train the country’s business and political elite are found in the city, as are the most well-known cultural centers, such as the Louvre museum and other art galleries, theaters, and concert halls.
The idea of a primate city such as Paris stands in contrast to cities in the United States that better match Zipf’s law. In the case of the United States, there is no primate city that dominates the country. Rather, Washington, DC, is the political center, New York is the financial center, Los Angeles is the entertainment center, San Jose’s Silicon Valley is the technology center, and so on.
Different explanations have been given as to why cities follow a rank-size rule or why primate cities form. Some argue that the rank-size rule reflects countries with well-developed urban systems. These are places where more political decisions can be made at a state or local level and where wealth and economic opportunity is more spatially distributed throughout a country.
In contrast, primate cities represent a consolidation of activity in a single urban place. Often, they form when political decision making is more centralized or authoritarian. A disproportionately powerful political elite may ensure that investment remains concentrated in a single city, while smaller regional cities are neglected or used merely to supply labor and raw materials. From an economic standpoint, urban primacy can also offer benefits. When transportation costs are low, people and investments can more easily move to a single city. By concentrating labor and investment capital in a single large city, efficiencies can be gained via agglomeration effects (to be discussed in more detail shortly). On the other hand, when transportation costs are high, people and investment capital are more likely to remain in local regions, leading to a more dispersed pattern of urban areas throughout a country.
Falling transportation costs helps explain why primate cities are more common in developing countries than in more developed regions such as Europe. Urbanization occurred earlier in Europe, when transportation costs were higher. Prior to expansive road networks, automobiles, and trains, regions within countries remained more spatially isolated. Thus, urban areas formed to serve local markets and fewer primate cities formed. Urbanization in less developed countries has happened more recently, when roads, cars, trains, and airplanes allow people to more easily move from place to place. As transportation networks spatially integrate countries, it is easier for workers and firms to agglomerate in a single primate city.
Primate cities formed in Latin American countries in the twentieth century through heavy centralized state roles in economic development. Government promoted industrialization policies focused on developing manufacturing in capital cities (figure 5.10). Limited budgets meant that investments in everything from roads and sewers to universities and hospitals were built in the primate city. Economic and social development in smaller cities and towns was therefore limited. Transportation networks were developed enough that migrant workers from other cities and towns could move to the primate city, concentrating population. As Latin American governments have moved away from state control in the economy, and shifted toward private investment and the export of raw materials and other goods, cities outside of the dominant urban core have been growing at a faster pace in recent years.
Central place theory
While the rank-size rule can help describe the size of cities, it does not explain the spatial distribution of urban areas within a country. One model that does attempt to describe these patterns is the central place theory developed by German geographer Walter Christaller in 1933. This theory posits that cities, towns, and villages will organize themselves in a regular pattern throughout a region or country. This organization is tied to economic forces, whereby businesses will cluster into urban areas as they search for the best location to maximize their market area and distance themselves from other competitors.
The theory begins with the idea of a central place, a settlement that provides goods or services to the surrounding market area (also known as the hinterland). The market area is determined by two variables: threshold and range. The threshold is the minimum market size required for a business to be profitable, while the range is the distance people are willing to travel to purchase a good or service (figure 5.11).
Businesses can be broken up into high-order and low-order providers of goods and services, which will have distinct thresholds and ranges. Higher-order businesses provide specialized goods and services that people use on a less frequent basis. Lower-order businesses provide goods and services that are used more frequently.
High-order providers will coalesce into larger urban areas, while lower-order providers will locate in both larger cities and smaller cities and towns. This sorting of high-order providers in large cities and lower-order providers in both large and small cities and towns is due to differences in their thresholds and ranges (figure 5.12). High-order goods and services have a larger threshold and a larger range. For example, a large hospital that specializes in cardiac surgery has a large threshold; it requires a large number of patients in order to be financially viable. Given that most people never have cardiac surgery, and those who do typically have it only once, the hospital must locate in a place with a large number of people surrounding it. It will locate in a large city and serve not only that city’s population but also residents of many smaller surrounding settlements. At the same time, a cardiac surgery hospital has a large range. People are willing to travel a greater distance to obtain heart surgery, given that it is a rare occurrence and cannot be done by more local providers.
On the other hand, a family doctor is a lower-order service provider. People visit a family doctor on a more regular basis, and therefore a family doctor has a smaller threshold. There are enough customers in a smaller city or town to make a profit. The range for a family doctor is smaller as well. People will not be willing to travel a great distance if they have only a minor injury or illness.
Through this process, a hierarchy of high- to low-order settlements develops. Higher-order businesses will form in a more limited number of large, high-order cities, while lower-order businesses will form in smaller, low-order cities and towns. High-order cities will have specialized medical care; larger malls and shopping districts; luxury retailers that sell brands such as Louis Vuitton, Gucci, Rolex, and Maserati; and higher-end entertainment such as major league sports teams, playhouses, and music halls.
Medium-order cities may have a general hospital; more midrange retail establishments; nonluxury car dealerships; and common entertainment such as movie theaters, community playhouses, and possibly a minor-league sport team.
Finally, low-order cities will have a family doctor, small local markets and a limited number of general merchandise retail outlets, possibly a movie theater, and common services such as auto mechanics and hairdressers.
To simplify his model, Christaller proposed that given a flat landscape, with equal ease of transportation in all directions and evenly distributed consumer purchasing power, different types of businesses cluster into high-, medium-, and low-order settlements that form a regular spatial pattern (figure 5.13).
There will be a small number of high-order settlements, which have a large market area that includes many surrounding medium- and low-order settlements. Within this market area, there are enough people within range to support the high thresholds of specialized goods and services providers. Each high-order settlement will be spaced far enough from another high-order settlement that their market areas do not overlap.
Medium-order settlements will surround the larger, high-order settlement. The market areas of these settlements encompass many low-order settlements that surround them. Again, they are spaced so that their market areas do not overlap. Medium-order providers cluster in these settlements, drawing customers from nearby lower order towns to semi-specialized goods and services.
Finally, there is an even larger number of small, low-order settlements, evenly spaced so that their market areas do not overlap either. People consume low-order goods and services in their local communities but travel to higher-order cities to purchase more specialized items.
In reality, few urban areas follow the pattern predicted by the central place theory. It was developed on the basis of German towns, and some studies have shown it to work moderately well on the flat plains of the US Midwest (figure 5.14), but in most cases, physical landscapes, transportation routes, and socioeconomic characteristics vary too much for the model to fit well.
Site and situation
The distribution of cities actually can be idiosyncratic, with the location of urban areas tied to the unique characteristics of places and their relative location. This can be done with the concepts of site and situation.
Site refers to the local characteristics of a place, while situation refers to its relative location. Given that many cities formed as a result of agricultural development, favorable site characteristics for urban areas often include the presence of agricultural land for farming, with ample precipitation or fresh water for irrigation. For example, many towns in the American Midwest formed as market centers for surrounding agricultural hinterlands. Other urban areas developed near natural resources, such as mineral deposits. For instance, Denver, Colorado, formed in the mid-1800s following the discovery of gold along the South Platte River.
Cities have also been founded at defensible sites, such as hilltops or sloping land that offers views of approaching invaders, as well as small islands and peninsulas. Paris was founded on the Île de la Cité, a small island in the Seine River that offered protection from outside invaders (figure 5.15).
Other site characteristics include the presence of natural harbors or navigable rivers. Singapore, for example, was identified by British colonial leaders as an ideal site in Southeast Asia for a trading hub due to its deep natural harbor.
More recently, urban areas have grown on the basis of physical amenities or desirable features. Cities throughout Southern California grew rapidly in the twentieth century due in large part to a pleasant year-round climate. Cities such as Boulder, Colorado, and Portland, Oregon, while initially founded for other reasons, have grown substantially as people are attracted to their abundance of outdoor recreation opportunities (figure 5.16).
The situation of cities has quite possibly played an even greater role in the location of urban areas. Situation refers to the relative location of a place, or its proximity to and spatial connections with other places. For instance, while small mining towns formed in the California Sierra Nevada mountain range during the Gold Rush of the late 1800s, other cities such as Sacramento and San Francisco grew even more. Although they were not located at the site of gold discoveries, they were located along transportation and trade routes that linked the Sierra Nevada range with global migration and trade routes. People and supplies would move through San Francisco from Pacific trade routes and along the Sacramento River to Sacramento, just below the foothill and mountain location of Gold Country. More money was made in these urban areas from trade and supplying miners than was earned from gold mining itself.
While the site characteristics of a natural harbor can influence the location of a city, even more important are the situational linkages to world markets. Singapore has a good natural harbor, but its most important feature for colonial Britain was its situation in the Strait of Malacca, a key trade route linking East Asia with Europe. As another example, New Orleans thrived as a port city at the end of the Mississippi River, which linked the interior of the United States with the Gulf of Mexico and the world. Cities such as New York and Buffalo expanded greatly with the construction of the Erie Canal, which linked the Midwest with Atlantic trade routes via the Great Lakes. Cities far from the ocean, such as Chicago, could further thrive as their situation—linkages with the outside world—changed in response to construction of this canal (figure 5.17).
The significance of site and situation on urban success can be seen when these factors change for the worse. As natural resource booms dry up or as trade routes shift, the fate of urban areas can change dramatically. Ghost towns can be found throughout the world, such as those abandoned after the California Gold Rush or the end of the nitrate era in northern Chile. Great cities of Central Asia fell off the map, figuratively, once sea trade replaced overland routes of the Silk Road.
Thus, the spatial distribution of urban areas has been highly dependent on site and situation characteristics. Arguably, situation has been the most important of the two for most of urban history, as great cities have tended to lie along important trade routes, be it those linking Gold Rush towns to the Pacific, those linking interior agricultural markets to global markets via the Mississippi River or Erie Canal, or those along land routes of the Silk Road in Central Asia that tied together China with the Middle East and Europe.
The megalopolis
As urban areas have grown rapidly in the past hundred years or so, a new type of spatial pattern has evolved at the national and regional scale, the megalopolis. The megalopolis is a massive urban region that consists of multiple cities. These cities are linked via transportation and communication infrastructure, creating an interlinked urban-economic system; in essence, these are a type of functional region, as described in chapter 1. While traveling through a megalopolis, it is possible to spend hours driving through urban landscapes. In the United States, the urban area stretching from Boston to Washington, DC, was one of the first places labeled as a megalopolis, but since then, other urban areas have grown and consolidated along the same pattern.
Megalopolises have become powerful economic engines for their countries and contribute a disproportionate amount to national economic output. Due to their size, they attract people and capital investment that intermingle to create innovation in science, technology, and business. Typically, there is functional specialization in different parts of the megalopolis, each of which contributes to the economic strength of the whole. The Pearl River Delta megalopolis in the Guangdong Province of China, has been called the largest megalopolis in the world (figure 5.18). The region has a population of around sixty million, and its economy accounts for over 9 percent of China’s total GDP. Its growth has been based on specialization, whereby Hong Kong functions as the location for multinational corporate headquarters and a conduit for foreign capital, while the nine mainland Chinese cities of the region focus on manufacturing. Each of the nine cities has further specialized, so that one concentrates on autos and auto parts, while others produce electronics and computers components, and still others make textiles and furniture.
Other megalopolises have been identified in the United States (figure 5.19). Each of these areas is tied to a key city and a signature industry. For example, Cascadia is tied to Seattle and the aerospace industry, while the Gulf Coast is linked to Houston and the energy industry.
Go to ArcGIS Online to complete exercise 5.2: “Zipf’s Law and primate cities,” and exercise 5.3: “Site and situation: Why is my city here?”
Economic power of the city
Cities grow because of the economic advantages they offer to people. As discussed in chapter 3, people are often pulled to urban areas because of opportunity. While life for a rural-to-urban migrant frequently can be hard in the city, the migration would not have occurred unless life in the city promised to be better than in the rural village.
Within cities, productivity and incomes are higher, and innovation is greater than in rural areas. Fully 80 percent of global GDP is produced in cities, while only 54 percent of the world’s population live in urban areas. Innovation, as represented by the number of patent applications granted, is disproportionately produced in urban areas. Within countries of the Organization for Economic Cooperation and Development, a group of mostly rich countries, 70 percent of patents came from metropolitan areas. At the same time, in regions around the world, higher urban incomes and employment result in lower levels of poverty. In Mexico, 50 percent of urban residents, but fully 62 percent of rural residents are poor. Nigeria’s urban population has a poverty rate of about 15 percent, while 50 percent of its rural population is poor. Likewise, Vietnam has an urban poverty rate of under 4 percent and a rural rate of over 18 percent.
Urbanization’s benefits also diffuse outward, benefiting those who remain in rural areas. Urban demand for rural goods can increase incomes for farmers. Rural incomes can also rise as surplus workers migrate to cities, reducing the oversupply of people searching for work in the countryside. Remittances sent from urban workers back to family members in rural areas further benefit the rural hinterland.
The economic benefits of urbanization are so strong that while many governments and development organizations used to try to reduce rural-to-urban migration, they now actively try to make it more efficient.
Basic and nonbasic industries
An important reason behind the economic strength of cities relates to the spatial interaction of people and businesses in urban areas. Employment, and thus wealth, can first be understood in terms of basic and nonbasic industries. Basic industries are those that drive the economy by exporting goods or services to a wider region, bringing money into the urban area. Basic industries are often related to the site and situation of a city. If a city’s site is tied to mining or agriculture, for instance, then selling products from these industries likely brings in money. Other site characteristics, such as pleasant amenities and large research universities can drive basic industries, as in the case of tourism and technology in the San Francisco Bay Area. Likewise, if a city’s situation places it along important trade routes, then logistics service industries at a port, rail yard, or highway-adjacent distribution center will bring in money. In other cases, proximity to raw materials can fuel manufacturing as a basic industry.
Basic industries are key components of urban growth, but they alone are not sufficient. Nonbasic industries offer goods and services to local consumers, both individuals and firms. These include auto mechanics, hairdressers, restaurant staff, retail workers, small consulting and business-to-business service providers, local parts suppliers, and many more. As cities grow beyond simple one-employer company towns, nonbasic employment quickly outnumbers basic employment.
The creation of nonbasic employment is the result of the multiplier effect. Basic industries bring money in from outside of the region. When basic-sector workers spend their wages around town, their spending drives demand for nonbasic goods and services, diffusing economic benefits throughout the city. For example, a port worker spends money on rent, which creates demand for a property manager and maintenance crew to care for the apartment building. The property manager then hires an accountant, as well as an occasional lawyer for legal disputes. The accountant and lawyer, along with the port worker, property manager, and maintenance workers, shop at the grocery store, creating demand for workers at the supermarket, and so on. If the multiplier effect for a basic industry is five, for example, then five additional nonbasic jobs are created for every new basic job. It is because of the multiplier effect that cities often compete with each other to attract a large, new employer. A new factory or corporate headquarters will create basic employment, but as a result of the multiplier effect, it will create many more nonbasic jobs in the city.
Thus, urban employment rapidly expands from an often small number of basic industry jobs. People from other areas are drawn to these jobs, leading to demographic and economic expansion.
Urban agglomeration
The economic power of cities is further enhanced by the agglomeration effect. Agglomeration involves the clustering of people and firms in an urban area. When goods, people, and ideas are in close proximity, economic efficiencies are gained and innovation thrives. These lead to greater wealth creation, higher incomes, and more jobs in cities.
There are several ways in which agglomeration improves economic efficiency. First, the costs of urban infrastructure can be shared among many people and firms. Streets, highways, ports, airports, water, sewers, electricity, and telecommunications are expensive to build and maintain. But when people and firms cluster in urban areas, the costs of this infrastructure can be shared by many. If a company locates in a rural setting, it may have to pay for upgraded infrastructure to support its needs, such as increased electrical capacity or high-speed internet connections. It will also face increased transportation costs to move people and goods to airports and logistics hubs.
Second, when firms cluster together in urban areas, they have access to a wide range of specialized workers and suppliers. A large pool of specialized workers can reduce training costs, allowing firms to put employees to productive work right away. A movie studio in Los Angeles can draw from a wide range of experienced workers, such as actors, light and sound specialists, film editors, and entertainment-focused financial experts. At the same time, firms can outsource nonessential functions to local service providers. Again, a Los Angeles movie studio can contract with local firms that specialize in the latest digital special effects rather than having to develop its own in-house special effects division. The same can be done with accounting or human resources functions. Specialty subcontractors that focus on the entertainment industry in Los Angeles thus allow the movie studio to focus on its core competency of moviemaking.
Third, in addition to lowering business costs and thus increasing productivity, urban agglomeration benefits workers. Workers in an urban agglomeration can more easily switch jobs without facing the added costs of moving to a new place. Workers can pursue opportunities that make best use of their skills and offer the most job satisfaction.
People (and firms) also benefit from the transmission of ideas in urban settings. Despite diffusion of communications technology around the globe, ideas and innovation still thrive when people interact face to face. Serendipitous interactions at coffee houses, bars, office lunch rooms, university dorm rooms, and on the street, can lead to new ideas that are unlikely to occur when people are not physically in the same place. As the author Matt Ridley colorfully stated in a book on how ideas develop, innovation occurs “when ideas have sex.” The more people interact, sharing their thoughts, knowledge, problems, and dreams, the more likely a new innovation will develop. High-density urban settings make the probability of this interaction happening much higher than if people are spread out in isolated rural communities.
It must be noted, however, that agglomeration diseconomies can also be found in urban areas. As cities grow, traffic congestion rises, offsetting the benefits of shared urban transportation infrastructure. Pollution can lead to illness and lost workdays, while crime can reduce the satisfaction of urban residents and lead to extra expenditures on security for households and firms. Also, a high demand for urban housing can lead to high home and rent prices, offsetting urban gains in wages for workers.
World cities
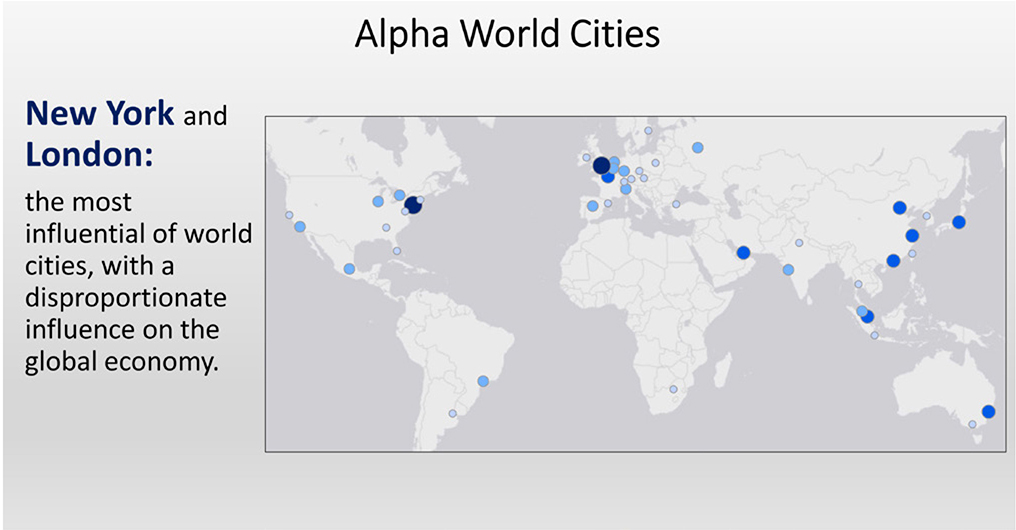
Urban economic power is not evenly distributed among the cities of the world. Rather, a handful of cities have disproportionate influence over the global economy. These world cities, sometimes also called global cities, are globally connected, and thus their influence is not bound by national borders. They are home to large multinational corporations that determine where to deploy investment for production, distribution, and consumption around the world. Production of goods in factories, as well as services in office buildings, can be located on one side of the world for consumers on the other, but the central command functions that coordinate this system cluster in world cities.
Different world cities specialize in specific functions, drawing on the benefits of agglomeration. Through the concentration of skilled workers and specialized subcontractors, some cities focus on financial services, while others focus on advertising and media, energy, consumer goods, or technology.
Often, the economic fates of world cities are tied more to each other than to the country in which they are located. In recent years, concerns over slow economic growth and income inequality has risen in the United States and other countries. But the spatial distribution of growth and wealth has been uneven. Many world cities have been thriving, with fast-rising incomes for people with the right skills, while wages for those without globally demanded skills and those in smaller cities and towns have stagnated or declined. World cities capitalize on the benefits of globalization, functioning as command and control centers with distributed networks of offices that find the best locations for low-cost production of goods and services and for selling in scattered places of economic growth. The success of world cities can be seen in the high demand for housing by well-paid workers that drives up home prices. In New York, London, Paris, and other global cities, median home values are well over half a million dollars. If one focuses just on the core areas of global cities such as these, median home values are over one million dollars. These values are often three times or much more than the median home value for the countries in which the world city lies.
One well-cited ranking of world cities looks at the global connectivity of cities in terms of advanced producer services such as finance, insurance, accounting, advertising, law, and management consultancy. These encompass key sectors of economic activity that drive the global economy and that cluster in important urban areas (figure 5.20).
The world cities are ranked by alpha, beta, and gamma levels. Alpha cities are the most highly integrated into the global economy. Beta cities are important at a more regional scale, integrating their regions or countries into the global economy. Gamma cities are those that link smaller regions or countries into the world economy or those that focus on industries other than advanced producer services.
Spatial organization of the city
Cities are of most interest to people at a local scale; that is, the scale in which we live our lives, as we travel from home to work and school, go shopping, and spend leisure time around town. Because of this, geographers and others have attempted to describe and explain how different parts of the city are organized, which helps us understand why housing costs are high in some parts of town and low in others, why traffic and congestion wastes so much of our time, and why some neighborhoods are safe, clean, and thriving, while others are dangerous, dirty, and deteriorating.
Urban models
Urban morphology describes the spatial organization of the city whereby different parts of the city contain different land uses and serve different functions. Some parts have business and commercial uses, while others have residences, industry, or open space. Various urban models have been developed that attempt to describe the morphology of cities. As models, these are simplifications of real-world cities that aim to uncover the general forms and processes of urban areas.
Concentric ring model
One of the first and most well-known urban models is the concentric ring model, developed by Canadian urban sociologist Ernest Burgess in 1925. This model describes the city as a series of concentric rings emanating from a central business district (CBD), more commonly known as downtown. The CDB contains retail, offices, banks, hotels, and museums and is a central point for transportation networks. Just beyond the CBD is an area of wholesale businesses, many of which serve downtown businesses (figure 5.21).
The next ring is known as the zone in transition. This area is characterized by older housing and slums, with poverty, deteriorating buildings, and a mixture of light manufacturing facilities. Typically, this zone is inhabited by recent immigrants.
Moving farther from the CBD is the zone of independent workingmen’s homes. Residents of this zone often are second-generation immigrants who have improved their economic situation enough to move out of the zone in transition.
The zone of better residences comprises the next ring. Here, single-family homes and high-class apartment buildings are located. In many cases, this is where restrictive covenants aimed to keep racial and ethnic minorities out.
The last and outer ring is known as the commuter’s zone. High-class homes are located in this area, and residents commute to the CBD for work on a daily basis.
The concentric ring model contains a dynamic component, whereby groups of people move outward to progressively higher-income rings over time. This process of invasion and succession functions as new groups of low-income immigrants “invade” the zone in transition. With time, these groups improve their economic situation and move to a ring farther out, and the zone in transition then becomes occupied by a new group of low-income immigrants.
Sector model
In 1939, American land economist Homer Hoyt developed the sector model. This model, while influenced by the concentric ring model of Burgess, described the city in terms of sectors. Whereas the concentric ring model assumes a flat surface, this model emphasizes how sectors are influenced by topography and transportation. Topography, such as hills and mountains, rivers, lakes, and oceans, constrain and guide the form of the city. The location of transportation routes further influences urban morphology.
In the sector model, different social classes live in wedges, or sectors that emanate outward from the CBD (figure 5.22). These originate early on, with the rich on one side of the CBD and the poor on another. From there, each social group expands outward in a wedge shape.
High-income residential areas grow outward along transportation axes radiating from the CBD to the periphery. These sectors include high-amenity characteristics such as better views or cleaner landscapes and often stretch toward high-ground open country or homes of community leaders. Other affluent communities can form as isolated nuclei along commuter rail lines. Adjacent to the high-class sectors are middle-class communities.
Low-income neighborhoods also radiate outward from the CBD toward the periphery but tend to be located in entirely separate parts of the city on land that is less desirable.
Multiple nuclei model
A third influential model, the multiple nuclei model, was developed in 1945 by American geographers Chauncy Harris and Edward Ullman. Unlike the concentric zone and sector models, which include just one central nuclei, the CBD, this describes the city with multiple nodes.
Multiple nuclei form for several reasons. First, different activities have different site and situation requirements. Retail districts require good accessibility from residential districts, while ports need to be at waterfront sites and manufacturing nodes need ample land and transportation connections. Second, distinct nuclei form due to agglomeration effects. Retail clusters benefit from busy consumer traffic, while financial service clusters can take advantage of person-to-person professional networking and deal making. Third, some types of nodes repel each other, resulting in dispersed patterns. High-end housing will be far from industry, while wholesale districts need ample loading spaces clear of heavy pedestrian and car traffic. Finally, land values push different uses to different nodes. Land with amenities such as waterfront views will have a high value with expensive housing, while land close to industrial land uses may have lower values and low-end housing.
In this model, the point of highest land values lies in the retail section of the central business district. It is the point of best accessibility, allowing people from throughout the city to shop at this location. Due to the high demand afforded by this accessibility, businesses are willing to pay top dollar for space in this zone (figure 5.23).
The next distinct district is the wholesale and light manufacturing zone. It is often near the CBD, but more important, it lies along transportation networks, such as rail lines and roads, where goods can easily be moved in and out of warehouses.
The heavy industry district locates further from the CBD. Due to noxious odors, noise, and hazardous materials, this zone forms away from the main center of the city. It too will locate near transportation networks, be it rail, road, or water.
Residential districts, as with the other models, are spatially sorted by social class, this time into distinct nuclei. Higher-income neighborhoods form in areas that are well-drained and not subject to flooding as well as on high land that is separated from industry and rail lines. In contrast, low-income neighborhoods locate closer to factories and warehousing, both for access to jobs and because of lower land values.
Other minor nuclei can form around myriad land uses. For example, a university can serve as the nuclei for housing, retail, and entertainment. At the same time, a park and golf course may form the nuclei for an upper-class housing development. Outlying business and light manufacturing nodes may form further from the CBD as well, as the city expands further from its original center.
Lastly, suburb and satellite communities form on and beyond the edge of the city. While suburbs have residents that commute into the city for work, satellites generally are too far away for regular commuting, although they tend to be closely tied to the city economically.
No city fits perfectly with any of the three models discussed thus far. However, it has been noted that certain land uses can sometimes fit well with specific models. Socioeconomic status, such as income and level of education, often align with the sector model. In these cases, wedges of affluent residences lie in one part of the city, while wedges of lower-income residences lie in other parts of the city. Other variables, such as family structure or life cycle, often form in concentric rings. Young adults often live in higher-density housing closer to employment downtown, while families with children live in suburban rings further out. Finally, racial and ethnic patterns can correspond with the multiple nuclei model. Pockets, or clusters, of different racial and ethnic groups can be scattered in various parts of the city, forming places such as Little Korea, Little Arabia, and so on.
Urban transportation model
Later urban models further built on the multiple nuclei model, describing urban form in response to growing use of the automobile and expansion of suburban communities. In 1970, geographer John Adams described US cities in terms of urban transport eras. In this model, population density, urban form, and housing and commercial types changed in response to the prevailing mode of transportation. Four eras were identified (figure 5.24):
•The walking/horsecar era: Up to the 1880s
•The electric streetcar era: 1880s to 1920
•The recreational auto era: 1920s to 1941
•The freeway era: 1945 onward
In the walking and horsecar era, cities were very dense. Due to limited mobility, all urban functions had to be performed within a relatively small area, creating high population densities. People lived, shopped, and worked in and around the CBD. Lower-income urban residents lived in multistory apartment buildings (there were no elevators for taller buildings), while the middle class occupied multistory row houses. Only the rich could afford single-family homes.
By the late nineteenth century, streetcars were being built in cities, leading to significant changes in urban form. Population densities began to decline as streetcar lines opened up new land for housing development. Single-family homes on narrow lots were built within walking distance of streetcar lines. For the first time, a larger segment of the population could leave the dense, congested core of the city for more suburban locations. Cities took on a star form, as development radiated outward along the streetcar lines. Nevertheless, commercial activity still focused on the CBD.
In the 1920s, more families began purchasing automobiles, and cities entered the third transport era. The automobile opened up large tracts of land that were previously inaccessible. With a substantial increase in the supply of land, people were able to purchase larger lots and build single-family homes. This further decreased population densities as people moved to auto-oriented suburban neighborhoods. Around this time, some commercial activity began to expand outside of the central business district. People no longer had to travel downtown for all purchases but rather could hop in their car and drive to a new auto-oriented shopping center near home. In this era, urban development filled in the spaces between the star from the streetcar era.
Finally, after World War II in the second half of the 1940s, US cities entered the freeway era. This era represents the low-density, single-family, auto-oriented development pattern that has been the dominant form of urban growth ever since. Vast tracts of land consist of single-family homes on large lots on the ever-expanding periphery of the city. Auto-oriented shopping centers dominate the commercial landscape, and most people no longer have to travel to the CBD for shopping or employment.
Galactic metropolis and edge cities
With the dominance of the freeway and automobile, the idea of multiple nuclei was expanded and described by American geographer Peirce Lewis as a galactic metropolis, whereby shopping centers, residential developments, and industrial parks appear to “float in space” like stars and planets with empty space in between when viewed from above. These detached urban nuclei do not depend on the CBD of another city but rather function on their own, providing housing, entertainment, employment, and shopping for residents. Similar urban forms have been described as edge cities, suburban places with offices, retail, and housing, located along freeways and designed around the automobile.
Go to ArcGIS Online to complete exercise 5.4: “Urban models: Which best represents my city?”
Suburban growth and urban decline
As cities have evolved from being focused on a single central business district to being multinodal and suburban, the fates of suburban and inner-city neighborhoods have shifted. Through the walking and horsecar and the streetcar eras, transportation, and thus economic activity, was focused on the CBD. But with the automobile era, and more so with the freeway era, this changed dramatically. New homes in auto-oriented suburban locations were purchased by the middle and upper classes—those who could afford cars and new property. The federal government helped subsidize this process by expanding access to home mortgages through the GI Bill for World War II veterans and federally backed mortgage guarantees. This began to pull wealth away from the inner city. Soon, commerce followed the money and relocated to the suburbs as well. Small mom-and-pop grocers in the inner city could not compete with the efficiency of large, new suburban supermarkets, while department stores left downtown for new peripheral shopping malls. At the same time, industry moved away from the city, as suburban land accessible for trucks via freeways was cheaper on the outskirts of the city than in multistory urban buildings. Commercial and industrial jobs, along with the more affluent segment of the urban population, moved away from the older inner city and into new suburban developments.
This left the inner city in a state of decline. Downtown business districts saw an increase in boarded-up storefronts. Employment opportunities for those unable to move to the suburbs declined. This often impacted racial and ethnic minorities disproportionately. They tended to have lower income and were sometimes prevented from moving to the suburbs by racially restricted covenants. As the economy of older cities declined, tax revenues fell. Older cities were left with a lower-income population as well as fewer resources to finance schools, provide police and fire protection, maintain streets, and maintain parks and public spaces. In contrast, new suburban cities saw an increase in tax revenues, which served a more affluent population and financed new, lower-maintenance infrastructure.
Detroit is one of the most visible examples of this decline. When the J. L. Hudson Company department store left downtown for the suburbs in the early 1950s, many other businesses followed. Twenty years later, Detroit’s commercial center was decimated. The city’s population declined as higher-income whites moved to new suburban cities and poor blacks remained. This pattern of inner-city decline and rising segregation was repeated in cities across the United States.
Suburban decline and urban growth
For many decades after World War II, geographers and others identified a fairly clearly defined dichotomy between the more affluent (and whiter) suburbs and the poorer (and minority) inner city. But in recent years, this dichotomy has become less clear, as pockets of poverty form in suburban neighborhoods and pockets of wealth grow in inner-city areas.
One study found that poverty between 2000 and 2011 grew by 64 percent in US suburban places. While the poverty rate is higher in inner-city neighborhoods, poverty growth in suburban areas was twice the rate of that in inner-city areas (figure 5.25). This meant that for the first time in US history, the suburbs had a larger number of poor residents than big cities.
In a sense, increases in suburban poverty would be expected. Given that employment had shifted to suburban areas, when economic crises such as a decline in US manufacturing strike, the impact is most strongly felt in suburban communities near employment centers. In addition, some suburban housing, especially on the far edges of cities (sometimes referred to as exurbs), offers an affordable means of living the American dream of a single-family home. However, people attracted to this affordable housing, such as immigrants and lower-skilled workers, have a more tenuous financial situation, making them more likely to fall into poverty.
This pattern was clearly visible during the 2008 mortgage crisis in fast-growing exurbs of cities in Arizona, California, Florida, and Nevada. In these places, many new homes were purchased with higher-interest subprime loans. When the economy turned to recession, many owners of these homes lost their jobs and were unable to make payments on their mortgages, resulting in high rates of foreclosure.
As suburban poverty is a relatively new phenomenon, it presents a unique set of challenges for the suburban poor. Most social services agencies, such as food banks, government social service offices, and charity groups, are in inner-city neighborhoods where poverty has traditionally been concentrated. The suburban poor can find themselves without the social safety net that inner-city poor may have. Suburban schools may lack specialized services to assist poor students. Furthermore, public transportation is limited in suburban areas, so if a poor family cannot afford a car, they may struggle to find employment outside of their immediate neighborhood.
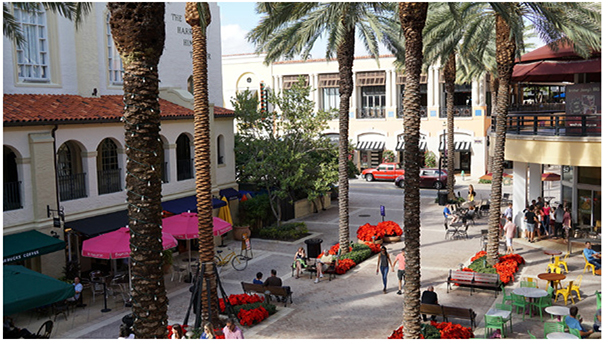
While suburban poverty has increased in many cities, some inner-city neighborhoods have been seeing an increase in home prices and higher income residents. The process whereby higher income and better-educated people move into lower-income inner-city neighborhoods is known as gentrification. Typically, it involves changes to a neighborhood’s demographics, real estate markets, land use, and character. Each of these changes can have a negative effect on existing residents, who may be displaced by newcomers with more money. In terms of demographics, gentrification often results in a decline in the minority population and an increase in the white population. With changes in the real estate markets, home values and rents increase. While this can benefit lower-income minority homeowners, the majority who rent can quickly get priced out of their neighborhood. In terms of land use, old warehouses and factory buildings get converted to art galleries, coffee shops and restaurants, and live-work lofts. Stores can switch from those that serve a low-income population, such as dollar stores and liquor stores, to those that serve higher-income residents, such as trendy chain stores and wine shops (figure 5.26). All of these changes mark a dramatic shift in the culture, or sense of place, of the community, as when a working-class neighborhood transforms into a “hipster” community.
The reasons behind gentrification vary. In many cities, crime has fallen substantially since its peak in the 1980s and early 1990s. New York City had 2,200 murders in 1990 and only 352 in 2015. This pattern has been followed by cities throughout the Western world. In addition, young people, especially the college educated, are marrying and having children at older ages. Young, childless people enjoy the activity of the city and do not have to worry about often lower-quality public schools. These factors, combined with growth of jobs that require brains over brawn, mean that more people want to live in denser neighborhoods, where, again, innovation and creativity flourish “when ideas have sex.” Often, the original gentrifiers are artists and musicians looking for cheap places to pursue their creative dreams. But as they transform neighborhoods, they create the conditions for higher-paid professionals to move in.
In recent years, gentrification has been a hot topic in San Francisco, among other cities. Being a beautiful city with myriad cultural amenities, interesting neighborhoods, and a year-round mild climate, many people wish to live there. As the Silicon Valley technology boom, centered south of San Francisco, has expanded and created numerous well-paying jobs, the demand for housing has increased even more. In 2016, median rent for a one-bedroom apartment in San Francisco was about $3,500, while a two-bedroom was over $4,500. Clearly, this price range is beyond the reach of most workers. As nontechnology workers face rising rents that they are unable to pay, demands for different housing solutions have been called for. However, there is little agreement on how to best address rising rents and gentrification. Some want more government-subsidized housing, while others call for fewer restrictions on developing new housing units in the city.
Similar patterns of gentrification have been found in cities around the world, from New York and Los Angeles to London, Paris, and Mexico City. Even Tallinn, Estonia, in former communist Eastern Europe has seen gentrification.
It must be noted, however, that some researchers dispute the negative impact that gentrification has on minority residents. Often, minority residents move from gentrifying neighborhoods at a lower rate than from nongentrifying neighborhoods, and many benefit from falling crime rates and an increase in retail services. Furthermore, places that gentrify do not always have a large number of residents. Rather, they are often old industrial and warehouse districts that are underutilized. As these places get converted to residential and retail land uses, economic and cultural benefits help the city more than they hurt.
Go to ArcGIS Online to complete exercise 5.5: “Suburban poverty and gentrification.”
Market influences on urban morphology
We have seen that urban form can take the shape of concentric rings, sectors, and multiple nuclei. We have also seen that the form and size of a city can be influenced by changing modes of transportation. But one of the forces underlying all of these is economic. In most cities in most of the world, the market concepts of supply and demand strongly influence how cities grow and the shapes that they take.
Bid-rent theory
In urban economic geography, bid-rent theory is used to explain how different land uses form in relation to a central place. In essence, different urban functions will bid different amounts of money to rent (or buy) land, considering the tradeoffs between accessibility and land costs. Bid-rent curves slope downward from the central place, so land is more expensive near the center and cheaper as one moves toward the periphery of the urban area. This is because the central place is highly accessible from all directions, resulting in a higher demand and higher prices.
Higher land prices near the center also create a negatively sloped density gradient. Skyscrapers and other multistory buildings will be found closer to the central place, since high land costs justify the added expense of building vertically. On the other hand, as land costs fall toward the periphery, development takes a more horizontal, low-density character.
The bid-rent theory is most clearly understood when tied to the Burgess central place theory (figure 5.27). In this case, the CBD, lying at the center of an urban area, is the point of best accessibility, since people from all directions can travel to it. Businesses that place a high value on accessibility will locate in the CBD. These will tend to be office and commercial functions that need to be easily accessible for employees and customers. Next, warehouse and light manufacturing functions that need central access to downtown business customers will make the highest bids for land. From there come bids for residential land uses. Inner rings, due to higher land costs, will consist of apartment buildings, while outer rings, where land costs are lower, will have lower-density single-family homes.
The bid-rent theory offers an explanation as to why land uses change in cities. When the demand for one type of land use increases, its bid-rent curve will shift upward. This leads to an expansion of its zone and more intense use of land. For instance, when demand for commercial space downtown increases, adjacent zones of warehouses and lower-income apartments can be redeveloped for higher-density office or retail establishments. These same places can be converted to higher-end housing, such as luxury apartments and lofts, if demand for downtown space by more affluent households increases. Likewise, peripheral farmland can be converted to new housing subdivisions if demand for single-family homes increases.
The bid-rent concept can also be used on nonmonocentric models, with land values highest at easily accessible central nodes and sectors and lower as one moves away from these more desirable locations. In all cases, land will be allocated on the basis of competition between groups with different abilities and willingness to pay. Those with more money will occupy the most desirable locations, and those with less money will occupy less-desirable locations.
Government influences on urban morphology
In an unregulated market economy, bid-rent theory would be sufficient to explain much of the spatial form of cities. However, all urban development is also influenced, in varying degrees, by government regulations and policies.
Zoning
One of the most commonly used tools that governments use to influence the shape of cities is zoning. Zoning involves regulations that govern the use, intensity, and form of urban development. For instance, a zoning code can delineate where commercial, residential, and industrial land uses are allowed. It can establish allowable densities, as in the number of housing units per parcel. It can also control the size and shape of buildings, setting maximum heights and distances from property lines.
Established in the early twentieth century in US cities, zoning was intended to prevent incompatible land uses and development patterns from damaging quality of life in urban areas. In New York City, residents were concerned that too many tall buildings were limiting sunlight and the flow of air through the city, resulting in zoning that controlled the height of buildings and setbacks of upper-level floors. It also intended to keep the garment industry from encroaching into the commercial area of Fifth Avenue.
Today, zoning ordinances can be complex and detailed. Broad categories of commercial, residential, and industrial areas are still used, but each of these is further broken into more detailed categories (figure 5.28). Commercial zones can differ by the type of business allowed. An auto repair shop or nightclub may not be allowed in a zone close to residences. Large department stores may be allowed only in zones with ample transit access. Residential zones can allow single-family homes, duplexes, apartment buildings, or high-rise residential towers. Industrial zones can be broken into light manufacturing and heavy industry. Additional zones can protect natural areas, scenic views, historic buildings, or allow for mixed land uses.
Many argue that zoning has indeed made cities more livable. Few people have to worry about a slaughterhouse opening next door to their home today, parkland can be protected from commercial land uses willing to pay a higher rent, areas of historic architecture can be preserved, and much more.
But others argue that zoning regulations end up harming cities as much as they help. One of the biggest criticisms is that by restricting housing development, housing costs are unnaturally high in many cities, and segregation is intensified. As described by bid-rent theory, if there is a demand for more housing in a certain area, then the amount of land devoted to housing will increase, as will housing density. But if zoning laws restrict the horizontal and vertical growth of housing, prices must increase. Demand will outstrip supply.
California is a prime example of how restrictions on housing development can increase real estate prices. From 1980 through 2010, housing development in high-demand coastal California was significantly below the rate of development for other US metropolitan areas. Consequently, housing prices in coastal California cities are among the highest in the nation. Existing residents of single-family homes resist zoning changes that allow for higher-density multifamily housing. Also, city governments zone more land for commercial uses, knowing that sales and hotel taxes go directly to city accounts, whereas residential property taxes go to the state government.
The San Francisco Bay Area best illustrates the impact of limited housing development on prices. In 2015, 64,000 jobs were added to the regions, while only 5,000 new homes were built. Because of intense demand and limited supply, developers in San Francisco now build a typical unit aimed at a family of four with an annual income of $270,000. This gentrification is creating what some are calling a segregated city of affluent technology workers, where the working class and lower-income minorities can no longer afford to live.
Urban renewal
The form of urban areas in the United States has also been influenced by government-sponsored urban renewal policies. Going back to the concentric ring model from 1925, residential areas around the CBD were described as lower income and the loci of poverty and social problems. As time progressed and American cities expanded, becoming even more suburban, concern grew over how to best reverse inner-city decline.
Beginning in the 1930s, but gaining strength through the late 1940s and 1950s, the federal government assisted cities in clearing slums and blighted areas. Government-backed loans and grants were used by cities to purchase large tracts of blighted inner-city communities through the use of eminent domain, whereby the government legally expropriates private property for public use, paying compensation at market rates.
The goal was to revitalize downtown and inner-city communities so that some of the people and investment lost to the suburbs would return. But in most cases, this goal was not achieved. Large tracts of housing for lower-income residents, as well as many small mom-and-pop businesses, were destroyed and replaced with office buildings, hotels, convention centers, retail establishments, and sports stadiums. This type of development failed to enliven central city communities. The 24-hour life of neighborhoods with a mixture of people and businesses was replaced with large-scale, single-use facilities.
Freeways were built to link the suburbs to downtown zones so that people could more easily work and shop there. But this further destroyed the urban fabric as freeways cut neighborhoods in two or, as in Seattle and San Francisco, destroyed urban amenities by blocking views and access to bays. People would simply drive from the suburbs to work downtown, or possibly see a ballgame or symphony concert, and then drive back to their suburban homes.
In terms of the inner-city poor, new housing failed to be built to replace that which was demolished. Millions of mostly black and Latino residents were forced to move to new housing. When new housing was provided, it tended to concentrate poverty in large housing projects (figure 5.29). This concentrated poverty resulted in lower property values in surrounding areas. By the twenty-first century, high crime and lack of maintenance resulted in the demolition of many of these projects.
In the end, urban renewal policies failed to revitalize inner-city neighborhoods but rather gave people more reasons to live in suburban parts of the city.
Urban morphology in the developing world
The focus of this chapter has been on cities in North America, but in many parts of the world, urban form and processes function in different ways. As mentioned earlier, urbanization has been occurring at a faster rate in lower-income countries. This has presented serious challenges as governments struggle to accommodate a rapid influx of new urban residents. All too often, the demand for housing and urban infrastructure—water, sewer, electricity, and roads—has exceeded the ability of governments to supply and coordinate its development.
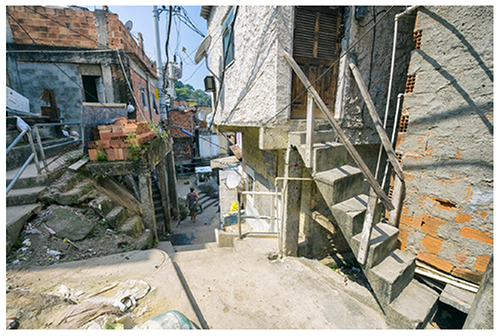
Consequently, cities in developing countries often have high rates of informal housing construction. Informal housing is that which is built without planning or permits and without the involvement of professional building contractors. Instead, housing is self-built by families, often on land that is not formally owned by them. Informal housing development results in large squatter settlements, or shantytowns, that are common throughout much of the developing world.
The Latin American city model
The Latin American city model serves as a good illustration of how cities in developing countries differ from those in the United States and other developed regions (figure 5.30). Again, going back to the 1925 concentric ring model, it was pointed out that as people’s economic situation changes, they move to new neighborhoods. Through the process of invasion and succession, older immigrant groups would move out of the zone in transition to higher income rings farther out. Similarly, more recent descriptions of cities have described how people leave older communities for new homes in the suburbs. But in the Latin American city model, the form of the city and the way in which neighborhoods change are very distinct.
The Latin American city model begins with a CBD, part of which consists of modern office buildings and hotels but with another section that has more traditional street-oriented markets for the wider population. Extending outward from the CBD is a commercial spine that follows a major transportation route. This is bordered by the elite residential sector, similar to that found in the Hoyt sector model.
Beyond the CBD and elite sector, however, the model quickly diverges from models based on US cities. Surrounding the CBD is the zone of maturity, which consists of middle-class homes and apartments. One reason that more middle-class residents stay closer to downtown is for the public transportation and infrastructure services. Traditionally, residents of developing countries own fewer cars than in the developed world, instead relying on public transit. Because of more limited transportation options, the middle class is willing to pay more for housing closer to the CBD. Also, full infrastructure in developing countries is not available farther from the city center. Water, sewer, electricity, and paved roads are fully developed in this section (and along the elite spine), unlike in zones farther out where incomes begin to fall.
The zone of in situ accretion contains a more working-class population. Housing appears only partially complete, so there may be homes that are built partially of cement block, partially with wood or other materials, and with exposed rebar of unfinished room additions. In this zone, infrastructure is only partially complete. Main roads may be paved, but side streets are still dirt; electricity may be available, but piped water and sewer may not (figure 5.31).
On the edge of the city lies the zone of peripheral squatter settlements. Typically, residents do not have formal land tenure, or ownership. Here, housing is built of a wide range of materials, such as plywood, tarps, scrap metal, and just about anything else. This is the lowest-income part of the city, where transportation to jobs downtown via public transit is slow and expensive. Infrastructure is mostly absent. Roads are dirt, few have electricity unless they can make illegal connections to main power lines, water is available only by well or water truck, and sewage runs directly into gullies.
When comparing the Latin American city model with models of North American cities, a couple of significant differences stand out. First is that the poor live on the periphery, while the middle class lives closer to the CBD. The second major difference is the process of neighborhood change. As people’s lives improve in the Latin American city, they are more likely to stay in the same place but upgrade their homes. The reason the zone of in situ accretions appears to be unfinished is that it is—people are continuously adding space to their homes as their families grow and incomes rise. With time, more homes become more complete, and the community pressures the government to add better infrastructure. Over time, this zone transforms into a zone of maturity. At the same time, squatter settlements upgrade as well. A house made of scrap metal and plywood may add a new room made of solid cement block. From there, more solid construction replaces the original materials. The city may begin to pave a few major streets, and electricity may be added to the neighborhood. Over time, the squatter settlement transforms into a zone of in situ accretions. Meanwhile, a new zone of peripheral squatter settlements appears farther out on the edge of the city. This process is ongoing, so the city grows organically outward, in direct contrast to the formally built housing of cities in the developed world.
More recently, Latin American cities are seeing more professionally built development in suburban locations. As economies improve, allowing for a wider distribution of urban infrastructure, and as more families purchase private automobiles, suburban middle-class residential housing tracts are forming, along with suburban industrial parks. In some ways, this growth is moving in the direction of North American urban development, but the traditional organic growth of many Latin American cities still gives them a distinct character.
Solutions to informal housing
There are different strategies for dealing with informal housing developments. Sometimes, when these developments are on land that is needed for other uses, squatters can be forcibly removed. This happened in Brazil for construction of some 2016 World Cup and Olympic sports facilities. But generally, governments do not want to face the conflict that can arise from forced evictions. Instead, regularizing land tenure is often done, whereby squatters are given legal title to their land, sometimes for a manageable fee and sometimes at no cost. Once legal ownership is ensured, the process of in situ accretion can speed up, as people feel more secure in spending to improve their homes. Governments can also provide site and service solutions, whereby a legal plot of land and basic infrastructure is provided, allowing for families to then build their own homes over time.
Livable cities
As cities grow, there is always a tension between the economic benefits of agglomeration and urban quality of life. In both developed and developing countries, most people can relate to being stuck in traffic jams, paying too much for rent, breathing polluted air, seeing open space lost to development, and having waterways polluted from urban runoff.
Smart growth
By controlling the form of urban growth, governments attempt to mitigate this tension so that cities remain engines of economic opportunity but are also pleasant places to live. One way of promoting livability is through smart growth (figure 5.32). The aim of smart growth is to build communities so that people can live and work in pleasant places near employment, schools, and shopping.
There are several key strategies for creating smart-growth developments. First, by mixing land uses, people are more likely to travel shorter distances for their daily activities. In traditional urban development, zoning was set to allow one type of land use. In that case, if the zoning allowed for only single-family homes, then there could not be any commercial, business, or other type of land use. This restriction forces people to travel greater distances to shop or work. When land uses are mixed, stores and offices can be blended with residential areas, much like in older neighborhoods, where corner stores and shops are more common alongside housing, and people can walk, bike, or take shorter trips by car or transit.
Second, mixed land uses allow for more diversity in housing types. When a community has single-family homes, apartments, and townhouses of different sizes, a more diverse population can live there. Young singles can live in apartments. When they marry and have children, they can move to a larger single-family home with a yard. Then as they grow older, they can move to a smaller townhouse. All of these moves can be within the same neighborhood, allowing people to maintain social ties in the same place as they move through stages of their life.
Another component of smart growth is higher density. Apartment buildings and townhomes allow for more units per square mile, as do single-family homes if lot sizes are smaller than in many typical suburban neighborhoods. With more housing units per square mile, more land can be used as open space, such as parks and nature preserves. Density also promotes walkability. When housing and land uses are more closely built (and when combined with mixed land uses), distances are shorter and biking and walking become viable transportation alternatives.
Another significant feature of smart growth is to foster a diversity of transportation options. Denser neighborhoods and mixed land uses can facilitate walking and biking as well as public transit use. This is enhanced by transit-oriented development whereby denser housing is located adjacent to commuter rail stations and public transit centers. Street design, with wider sidewalks, good street lighting, landscaping, segregated bike lanes, and well-located transit stops all build on the benefits of density and mixed land use.
Lastly, smart growth can include developing a strong sense of place or a unique character so that people want to spend their time in the community. This can be done by creating public gathering places such as town squares (figure 5.33), or plazas or creating a nightlife district with restaurants and theaters. Public art can enliven the landscape and give communities a unique character. Interesting paths, such as well-designed streets, that link distinct nodes of a neighborhood can further enhance a positive sense of place.
The connected city
For many people in developed countries, it is hard to imagine driving though the city without live traffic updates on a cell phone. We are also accustomed to finding a nearby coffee place or restaurant, customer reviews included, at the touch of a button. As information and communication technology has diffused through urban areas around the world, it is increasingly being used to make cities more livable. Private companies offer mapping services to help us travel through the city and find the goods and services we are looking for. Increasingly, city governments are using technology to improve services as well.
The first step in creating a connected city is to build the requisite information and communication infrastructure. Private companies in many places have established extensive cell coverage, allowing those with the financial resources to benefit from access to the internet. But many with fewer resources are left out. For this reason, some cities are building public Wi-Fi sites so that anyone with a smart phone can access the internet without having to pay for data (figure 5.34). In Rwanda and Brazil, some city buses now offer these services, and in New York City, free public Wi-Fi links are being placed throughout its five boroughs.
Cities not only are linking people to information and communication infrastructure but also are linking a wide range of urban features, allowing for complex data analysis and real-time response. Traffic sensors can feed information to traffic lights so that vehicle flows are maintained, sensors in water and sewer lines can warn engineers when replacement parts are needed or leaks form, parking garages can now inform drivers how many spaces are available and in which locations, air pollution monitors are placed on street lights, and cameras can monitor the movement of people for security purposes.
Cities are offering free applications that allow residents to report graffiti or illegal dumping, flooding and downed power lines during storms, mosquito breeding grounds, unsafe street conditions, and much more. Through embedded sensors and citizen crowdsourcing, city governments are collecting vast amounts of data that can be used to improve efficiency and make cities safer, cleaner, and more pleasant places to live.
In addition to collecting data for internal use, many cities are now moving toward open data, whereby governments publicly share data that was once difficult for residents to acquire. This is allowing individuals and companies to create applications and analyze data in ways that few cities can with their limited resources.
Local governments are continuously adding new applications and datasets that are open to the public. With this information, residents can be more informed about government projects, and innovative new applications can be developed by the public with city data.
Go to ArcGIS Online to complete exercise 5.6: “Smart vs. suburban growth,” and exercise 5.7: “Open data.”
References
Adams, J. S. 1970. “Residential Structure of Midwestern Cities.” Annals of the Association of American Geographers 60, no 1: 37–62. doi: https://doi.org/10.1111/j.1467-8306.1970.tb00703.x.
Alamo, C., and B. Uhler. 2015. California’s High Housing Costs: Causes and Consequences. Legislative Analyst’s Office, State of California. http://www.lao.ca.gov/reports/2015/finance/housing-costs/housing-costs.aspx.
Bairoch, P., and C. Braider. 1988. Cities and Economic Development from the Dawn of History to the Present. Chicago: University of Chicago.
Buntin, J. 2015. “The Myth of Gentrification.” Slate Magazine, January 14, 2015. http://www.slate.com/articles/news_and_politics/politics/2015/01/the_gentrification_myth_it_s_rare_and_not_as_bad_for_the_poor_as_people.html.
Cooper, M. 2014. “China’s Pearl River Delta: Tying 11 Cities into a Megaregion.” Urban Land Magazine, September 22, 2014. https://urbanland.uli.org/industry-sectors/infrastructure-transit/chinas-pearl-river-delta.
Dash, Nelson G., and A. Rae. 2016 “An Economic Geography of the United States: From Commutes to Megaregions.” PLoS ONE 11, no. 11: e0166083. doi: https://doi.org/10.1371/journal.pone.0166083.
The Economist. 2013. “What Is Driving Urban Gentrification?” The Economist, September 17, 2013. https://www.economist.com/blogs/economist-explains/2013/09/economist-explains-5.
Federal Reserve Bank of San Francisco. 2016. “Can the SF Bay Area Solve Its Affordable Housing Crisis?” (blog). http://www.frbsf.org/our-district/about/sf-fed-blog/can-san-francisco-bay-area-solve-affordable-housing-crisis.
Fischer, C. 2014. “The Public Housing Experiment.” Boston Review, January 14, 2014. https://bostonreview.net/blog/fischer-public-housing-experiment.
Ford, L. R. 1996. “A New and Improved Model of Latin American City Structure.” Geographical Review 86, no. 3: 437.
Globalization and World Cities (GaWC) Research Network. 2012. “The World According to GaWC 2012.” http://www.lboro.ac.uk/gawc/world2012t.html.
Gottmann, Jean. 1957. “Megalopolis or the Urbanization of the Northeastern Seaboard.” Economic Geography 33, no.3: 189−200. doi: https://doi.org/10.2307/142307.
Harris, Chauncy D., and Edward L. Ullman. 1945. “The Nature of Cities.” The Annals of the American Academy of Political and Social Science: Building the Future City 242: 7−17. doi: https://doi.org/10.1177/000271624524200103.
HKTDC Research. 2016. “PRD Economic Profile.” http://china-trade-research.hktdc.com/business-news/article/Fast-Facts/PRD-Economic-Profile/ff/en/1/1X000000/1X06BW84.htm.
Hoyt, H. 1939. The Structure and Growth of Residential Neighborhoods in American Cities. Washington, DC: Federal Housing Administration.
Kazeem, Y. 2016. “Lagos Is Africa’s 7th Largest Economy and Is About to Get Bigger with Its First Oil Finds.” Quartz Africa, May 5, 2016. https://qz.com/676819/lagos-is-africas-7th-largest-economy-and-is-about-to-get-bigger-with-its-first-oil-finds.
Kneebone, E., and A. Berube. 2014. Confronting Suburban Poverty in America. Washington, DC: Brookings Institution Press.
Lewis, Peirce. 1983. “The Galactic Metropolis.” In Liberman, A. (ed.), Beyond the Urban Fringe: Land Use Issues in Nonmetropolitan America. Minneapolis: University of Minnesota Press.
Moreno, J. C. C. E., and J. Clos. 2016. Urbanization and Development: Emerging Futures. New York: UN Habitat.
National Association of Regional Council (NARC). Livability Literature Review: A Synthesis of Current Practice. Washington, DC: NARC.
Organisation for Economic Cooperation and Development (OECD). 2016. “Patent Activity in Metropolitan Areas.” In OECD Regions at a Glance 2016. Paris: OECD Publishing. doi: http://dx.doi.org/10.1787/reg_glance-2016-31-en.
Portes, Alejandro, and Bryan Roberts. 2005. “The Free-Market City: Latin American Urbanization in the Years of the Neoliberal Experiment.” Studies in Comparative International Development 40, no.1: 43−82. doi: http://dx.doi.org/10.1007/BF02686288.
Puga, D. 1996. “Urbanisation Patterns: European vs. Less Developed Countries.” Center for Economic Performance. Discussion Paper No. 305.
Reba, M., Reitsma, F, and Seto, K. 2016. “Spatializing 6,000 Years of Global Urbanization from 3700 BC to AD 2000.” Scientific Data 3: 160034. doi: http://dx.doi.org/10.1038/sdata.2016.34.
Ridley, M. 2011. The Rational Optimist: How Prosperity Evolves. New York: Harper Perennial.
Sassen, Saskia. 2005. “The Global City: Introducing a Concept.” Brown Journal of World Affairs 11, no. 2: 27–43.
Schildt, C., N. Cytron, E. Kneebone, and C. Reid. 2013. The Subprime Crisis in Suburbia: Exploring the Links Between Foreclosures and Suburban Poverty. Community Development Working Paper 2013-02. San Francisco: Federal Reserve Bank of San Francisco.
United Nations. 1980. Patterns of Urban and Rural Population Growth. Population Studies, No. 68. New York: United Nations.
———. 2014. “World’s Population Increasingly Urban with More Than Half Living in Urban Areas.” UN DESA Department of Economic and Social Affairs. http://www.un.org/en/development/desa/news/population/world-urbanization-prospects-2014.html.
UN-Habitat. 2014. State of African Cities 2014, Re-imagining Sustainable Urban Transitions. State of Cities—Regional Reports. https://unhabitat.org/books/state-of-african-cities-2014-re-imagining-sustainable-urban-transitions.
———. 2016. World Cities Report. United Nations. http://wcr.unhabitat.org/.
US Environmental Protection Agency. 2017. “About Smart Growth.” https://www.epa.gov/smartgrowth/about-smart-growth#smartgrowth.
Von Boventer, E. 1969. “Walter Christaller’s Central Places and Peripheral Areas: The Central Place Theory in Retrospect.” Journal of Regional Science 9, no. 1. doi: https://doi.org/10.1111/j.1467-9787.1969.tb01447.x.
Weiss, M. 1990. “The Origins and Legacy of Urban Renewal." In J. Paul Mitchell (ed.) Federal Housing Policy and Programs: Past and Present. New Brunswick, NJ: Center for Urban Policy Research.
World Bank. 2015. East Asia's Changing Urban Landscape: Measuring a Decade of Spatial Growth. Washington, DC: World Bank.
———. “World Bank Report Provides New Data to Help Ensure Urban Growth Benefits the Poor.” Press release. http://www.worldbank.org/en/news/press-release/2015/01/26/world-bank-report-provides-new-data-to-help-ensure-urban-growth-benefits-the-poor.