Chapter 6
Food and agriculture
The world population in 2017 was over 7.3 billion and will reach 11.2 billion by the year 2100. Much of this growth will be in the developing countries of Africa, the Middle East, and parts of Asia, where many poor people struggle to obtain adequate food and nutrition. At the same time, urban areas are growing rapidly. While in 1950 there were two cities with over ten million people, by 2015 there were twenty-nine, most of which were in developing countries with substantial poverty. As human populations grow and as urban populations swell, food production must increase substantially. If it does not, the planet faces risk of a Malthusian crisis with rampant food shortages, urban food riots, and social upheaval.
Great challenges lie in increasing the quantity, quality, and sustainability of food production (figure 6.1). Quantity can be increased with technology that increases farm yields, including much-maligned GMOs (genetically modified organisms). Improvements in agricultural infrastructure, such as irrigation, road and shipping networks, and proper storage facilities, are also necessary so that the food that is produced can reach consumers without being lost in transit. Quality matters as well. Increasingly, affluent urban residents demand food that is not only plentiful at an affordable price but also offers a wide variety of choices. Food that provides adequate nutrition is also essential so that people can lead long and healthy lives. Given that agriculture inherently requires the use of natural resources, it can have impacts on natural habitats, climate, water quality, and more. For this reason, expanded agricultural production must be performed in a sustainable manner so that the earth continues to provide for future generations.
The next three chapters examine the complex systems of economic geography. Economic geography describes the location of economic activity, be it a wheat farm, a clothing factory, or a social media technology company. It aims to describe how economic activity is driven by the local and global connections of people, ideas, raw materials, and finished products that flow between places. Economic activity can be broken down into three broad categories: the primary, secondary, and tertiary sectors. This chapter focuses on the primary sector of the economy, which involves the extraction of raw materials from the earth. Primary sector activities include farming, fishing, mining, and logging. The following two chapters focus on the secondary sector, which consists of manufacturing, and the tertiary sector, which involves the provision of services.
Economic geography is one of the most relevant aspects of human geography in that it shapes the lives of all people and the natural world. It helps us understand where and why there is satisfying employment in some places and underemployment or unemployment in other places. It helps describe the spatial distribution of poverty and wealth globally and locally. It gives insight into environmental problems (and solutions). And it helps us explain the overall quality of life for humans in our cities and countryside.
Origin and diffusion of agriculture
The first agricultural revolution
For most of human history, hunting and gathering was the sole means of survival for human groups. But sometime around 9000 BCE, some groups became sedentary and began to domesticate seeds for farming, resulting in the first agricultural revolution. In all likelihood, the process of plant domestication was a gradual one. People selected the larger seeds and fruits when gathering, unconsciously choosing specimens that would produce additional larger offspring. Some of these seeds inevitably fell to the ground and grew in places where humans spent more time. This artificial selection of larger seeds and fruits ultimately led to domesticated seeds that differed substantially from their native origins. Planted food would have supplemented hunting and gathering initially, but over time, active farming came to supersede it and became the dominant source of food. Somewhat later, people began to domesticate animals as well, selectively breeding them for docility and to provide food, clothing, transportation, and labor.
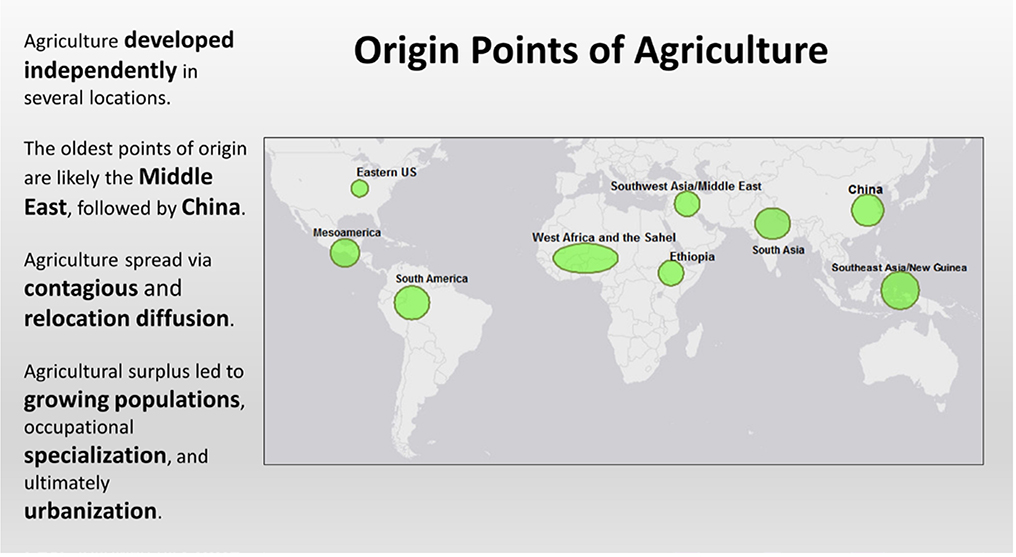
Agriculture developed as an independent innovation in various locations around the world (figure 6.2). Possibly the oldest origin point lies in the Middle East, specifically the Fertile Crescent around 9000 BCE. Here, early agriculturalists grew various types of wheat and raised domesticated sheep, goats, and cattle. Chinese agriculture originated about 8000 BCE, with wheat dominating a northern core while rice dominated a southern core. Around the same time agriculture originated in Mesoamerica and South America. In West Africa and the Ethiopian highlands, agriculture formed around 4000 to 3000 BCE. Eastern North America saw the development of agriculture around 2000 BCE.
From these points of origin, agriculture then spread through relocation and contagious diffusion. Via contagious diffusion, hunter-gatherer societies near agricultural societies were exposed to farming techniques and soon adopted them. At the same time, the movement of people to new locations spread agriculture via relocation diffusion. Crops and farming techniques from the Middle Eastern Fertile Crescent diffused westward through Europe and around the Mediterranean Sea and eastward into South Asia. Likewise, crops and techniques from China diffused west. Before too long, seeds and farming technology had diffused throughout the Eurasian landmass.
Of course, there were initial limits to the diffusion of agriculture that slowed its spread to all parts of the world. The techniques and crops that were developed in agricultural points of origin faced intervening obstacles as people were deterred from moving across unfamiliar environments. For instance, people of the Mediterranean were unlikely to migrate across the Saharan desert into sub-Saharan Africa, thus slowing diffusion southward. Similarly, Andean llamas and potatoes were slow to diffuse from their highland environments in South America northward across the tropical lowlands of Central America. And naturally, large bodies of water, such as the Pacific and Atlantic oceans, slowed diffusion for many millennia.
The results of the first agricultural revolution were profound. Prior to the development of agriculture, hunter-gatherer societies were limited to relatively small bands of people whose numbers were limited by availability of food. But with the advent of farming, food supplies increased and populations grew. This led to an increase in the number of people as well as an increase in population density. Whereas bands of people were once spread thinly over the landscape, they came to be settled in more densely populated sedentary farming communities.
As farming techniques improved, agricultural communities reached levels of efficiency where some people could perform tasks other than farming. This meant that there were growing settlements where some members of the community could specialize in nonagricultural labor. Some could specialize as blacksmiths or carpenters, developing new tools for farming and defense. Others formed a priestly or scientific class, whose observations of the natural world helped further improve agricultural production and technological innovation. Social hierarchies formed, with a leadership class that could organize communities for greater economic production and military strength. The first agricultural revolution led to larger and denser populations, then surplus food that allowed for specialization, and ultimately, innovation and new technologies. With sufficient numbers of people and enough time to develop farming and other technological innovation, powerful urban societies began to form in diffuse points across the globe.
The Columbian exchange
Among the most powerful urban societies to arise were those of Europe, which by the fifteenth century had developed technology to spur the age of exploration. In 1492, Columbus sailed to the Americas and initiated an exchange of crops, disease, people, and ideas that reshaped global political and economic geography (figure 6.3). This process is referred to as the Columbian exchange, which overcame the intervening obstacles of the great oceans, finally connecting the Eastern and Western Hemispheres.
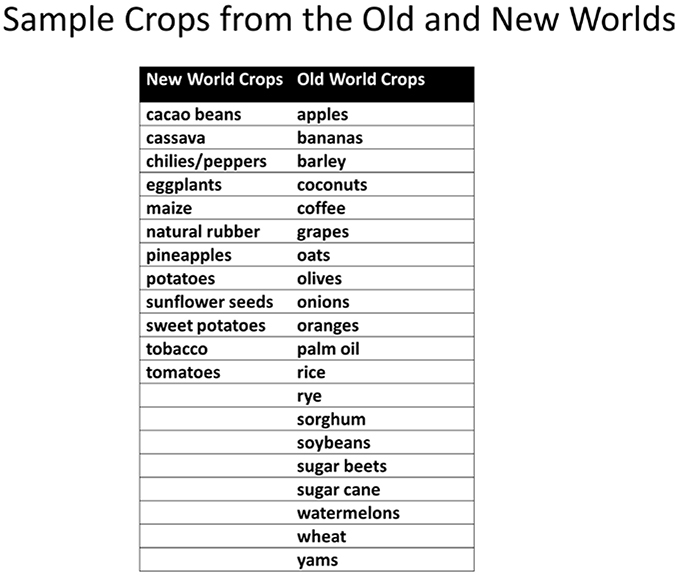
The Columbian exchange is one of the most important processes contributing to current patterns of agricultural production and regional culinary traditions. New World crops brought from the Americas to Europe, Asia, and Africa include potatoes, chili peppers, tomatoes, cacao, maize, and tobacco. Moving in the other direction, Old World crops, such as sugar cane, coffee, soybeans, oranges, and bananas, were brought to the Americas (table 6.1).
Old World to New World diffusion led to the association we have between Ireland and the potato. Spicy Indian curries are based on Old World peppers, while Italians could not make their tomato sauces prior to exchange. In Africa, Cote d’Ivoire is highly dependent on the production of New World cacao beans, and top consumers of Mexican-origin maize include Lesotho and Malawi.
Diffusion of crops from the Old World transformed the Americas as well. Many large plantations formed to grow sugar cane, coffee, and bananas for export to markets in the Old World, while soybeans consumed large tracts of land in Brazil and the United States. Not only did these crops alter the agricultural landscape, they dramatically transformed the demographic landscape as well. Large numbers of slaves from Africa and indentured servants from Europe and Asia were brought to the Americas to provide labor for these export enterprises.
From its inception, the Columbian exchange brought more land under cultivation globally, contributing to an increase in caloric output and nutritional diversity. This fed global population growth worldwide and was the first major step in development of our system of international agricultural trade.
The second agricultural revolution
From the beginning of the first agricultural revolution, technological and economic systems changed slowly. Stone and wood tools were gradually developed to help till the land, and by the Bronze Age (circa 2000 BCE), metal tools and animal-drawn plows were put into use. While agricultural products were traded to some degree, most agriculture was for subsistence purposes, intended to feed local populations and, at best, nearby expanding cities.
But by the mid-eighteenth century, dramatic changes in agricultural production occurred. As the Industrial Revolution accelerated in Europe, especially in Great Britain, technological and economic change in agriculture took hold. These dramatic changes, from roughly 1750 through 1880, are known as the second agricultural revolution. This was a time when agriculture in Europe transformed from a predominately subsistence model to a factory farm model.
These changes were driven by several factors. Whereas two-field crop rotation, which helps maintain soil nutrients, had been in use for hundreds of years, advances in agricultural science led to widespread adaptation of four-course crop rotation in eighteenth-century Great Britain. At the same time, enclosure of agricultural fields took hold. Enclosure is the process whereby individual famers enclose land and take ownership. This practice contrasted with medieval customs of commonly farmed land with communal or feudal ownership. With better crop rotation methods and economic incentives to increase investment and maximize output on privately held farms, agricultural intensity rose and production rapidly increased. Agricultural output further increased as farming took a more industrial approach to production. Farmers increasingly purchased fertilizers and seeds rather than producing their own. They also invested in new machinery, such as mowers, reapers, threshers, and tractors. Landowners specialized in specific crops to maximize efficiency.
Through changes wrought by the second agricultural revolution, food output rose substantially, producing enough food for a growing urban industrial workforce.
The green revolution
Another major transformation in agriculture began in the second half of the twentieth century. This transformation is known as the green revolution and is sometimes called the third agricultural revolution. The green revolution involved advances in agricultural science that allow for the development of high-yield crops by intentionally breeding seeds that produce more output per acre of land. Crops were developed that increased yields, were resistant to diseases, and responded better to fertilizers. Wheat and rice were the first major crop types to benefit from this technology, and their use spread throughout Asia and Latin America. Later, crops such as maize, cassava, and others were developed for use in Africa.
The green revolution was successful at increasing agricultural output globally. It is estimated that without this technology, prices in the year 2000 would have been 66 percent higher and 14 to 19 percent more land would have been devoted to agriculture in developing countries. Higher food prices would have led to lower caloric intake in developing countries, higher levels of malnourishment, and greater levels of infant and child mortality. Likewise, more land under cultivation would have had detrimental environmental impacts, reducing natural habitat and impacting water and other natural resources. Without the green revolution, the world may not have faced a complete Malthusian catastrophe, but it would have been heading in that direction.
More recently, yield increases have slowed, so new technology is being used to continue the benefits of the green revolution. Whereas early green revolution technology involved cross-breeding plants for desired characteristics, the process is much more precise today. Scientists now manipulate plants at the genetic level by altering specific segments of DNA. These GMOs have been created to resist pests, thus reducing the need for pesticides, and to resist herbicides, allowing farmers to quickly and easily spray their fields to kill weeds but not the crops. Other genetic modifications include rice and other crops that are drought tolerant or flood tolerant, allowing them to be grown on land that was formerly unsuitable for production. As climate change accelerates, increasing droughts in some places and flooding in others, crops with greater environmental resistance will be even more essential for feeding the world population.
While GMO crops can increase yields, there are criticisms, some valid and some not, related to their use. One criticism is that GMO crops are “unnatural” and can cause adverse health effects in humans. To date, this is unproven, with millions of people consuming GMO crops and no documented negative health impacts. Other criticisms have more value. While less pesticide is used with GMOs, herbicide use has increased, so overall chemical use has not declined as promised (figure 6.4). Another concern is that engineered genes may spread into wild plant populations. There is mixed evidence as to the extent and impact of this spreading.
More broadly, critics of green revolution technology point out that it has benefited large landowners much more than small subsistence farmers. Small-scale farmers often cannot afford to purchase the materials needed for successful implementation of these technologies. Green revolution crops require the purchase of fertilizers and herbicides. In the case of GMOs, seeds often must be bought from large multinational corporations. Likewise, successful green revolution farming often requires water pumps, tractors, and other equipment. Frequently, farmers face debt to purchase the required inputs and may struggle to turn a profit. Finally, these technologies rely on greater scientific knowledge rather than local farming knowledge, which many small-scale farmers do not possess.
While the green revolution has resulted in greater food output, many small landowners, unable to complete with larger farm enterprises, have become low-wage landless agricultural laborers or have migrated to urban areas. Yet overall, the green revolution has helped increase food output for a growing world population. As the world population continues to grow, innovations in technology and farm operations must continue to advance.
Go to ArcGIS Online to complete exercise 6.1: “The Columbian exchange: Origins of agricultural globalization.”
The spatial distribution of agricultural activity
Two essential factors drive the spatial distribution of agricultural activity: the natural environment and economics. That the natural environment influences which crops are grown in which locations is relatively self-evident. Grapes need plenty of warmth and sunshine, sugarcane and bananas need ample amounts of water, green beans can thrive in short growing seasons, while citrus needs a long one. Thus, which types of crops grow best in which locations is strongly influenced by temperature, precipitation, and length of the growing season. These factors vary greatly by latitude and elevation. For instance, tropical rainforests along the equator are warm and wet year round; midlatitude Mediterranean climates have hot, dry summers with cooler, wetter winters; subarctic climates have long, cold winters and short, cool summers. These and other climate types shape the spatial distribution of crops.
But while the natural environment restricts where different crops can or cannot grow, economic forces ultimately drive the spatial distribution of agricultural activity. After the first agricultural revolution, humans migrated to new locations and traded with other societies, spreading crops with them. For example, wheat diffused from the Fertile Crescent westward into Europe and North Africa and eastward to the Indus Valley of South Asia. Barriers to diffusion prevented crops from spreading globally at first. So, while wheat grows well in southern Africa, barriers such as the Saharan desert and tropical rainforests inhibited migration and trading with that region, preventing its diffusion. With sea navigation and the Columbian exchange after 1492, barriers to diffusion broke down. Ships allowed people to migrate and trade at a global scale, sailing from Europe to Asia around the southern tip of Africa and across oceans to the Americas and Australia.
Globalization and comparative advantage in agricultural production
In the scramble for dominance, European powers settled and colonized lands across the globe, and agricultural systems were developed to create wealth for the mother countries. Old and New World crops were transplanted around the world, dramatically altering agricultural landscapes. By the nineteenth century, the Industrial Revolution and the second agricultural revolution were in full swing, feeding (literally and figuratively) the modern age of globalization.
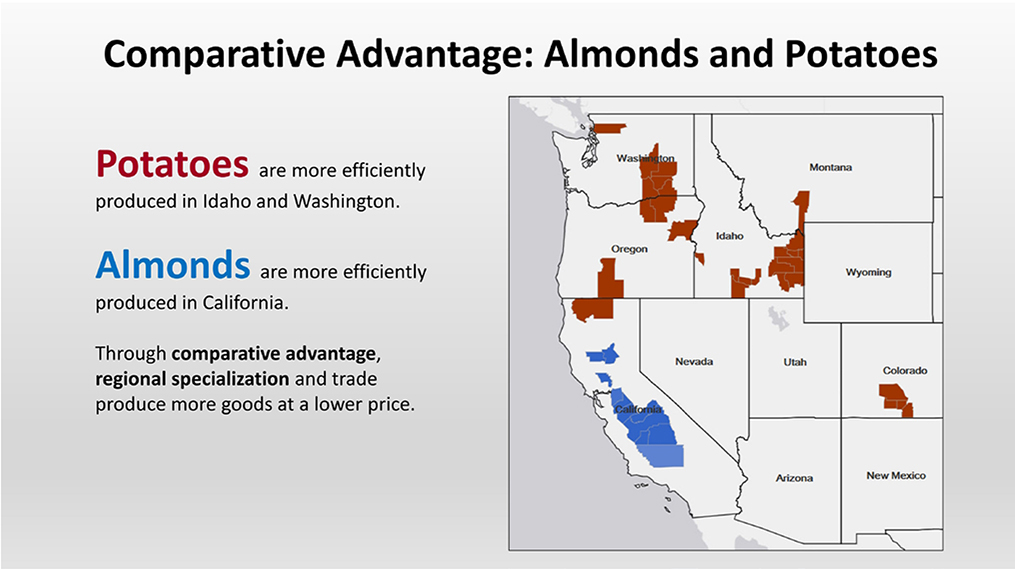
The globalization of agriculture is based on the idea of comparative advantage. Comparative advantage describes the fact that some places have an advantage at producing certain crops compared to other places. This advantage comes from efficient use of what economic geographers call the factors of production: land, labor, and capital. In the case of agriculture, land describes the natural environment, such as climate and soil conditions. Labor refers to the people who work in agriculture, including their quantities and skill sets. Capital is the machinery and buildings available for production. Each place has a unique combination of these factors, with differing environmental conditions; a varying number of people willing and able to work in agriculture; and differing amounts of farm machinery, storage, facilities, and transportation networks. Regional specialization occurs as places produce agricultural products in which they have a comparative advantage, then trade with other places that have comparative advantages in different crops.
We can see comparative advantage at work in agricultural patterns of the United States (figure 6.5). California is the nation’s top producer of almonds, while potatoes are grown primarily in Idaho and Washington. The environment of California is well suited for a wide range of crops, and a substantial amount of potatoes could grow there if farmers chose to plant them. However, California can produce almonds more efficiently than potatoes, so it makes sense to specialize in almonds instead. Of course, that does not mean that the people of California cannot get potatoes and the people of Idaho cannot get almonds. Instead, the two states trade, allowing Californians and Idahoans to get lower-cost almonds and lower-cost potatoes.
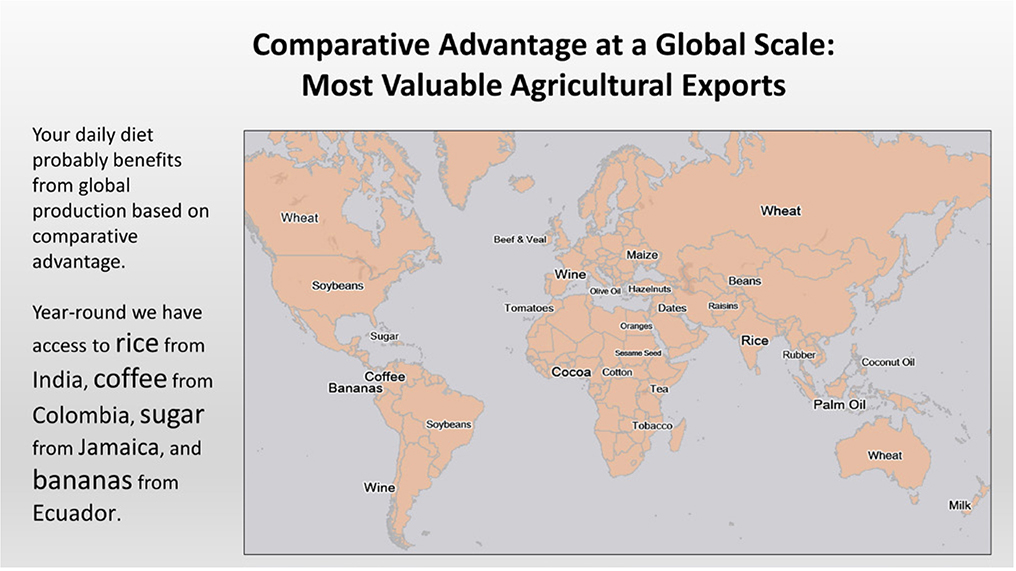
The same process of regional specialization and comparative advantage takes place at a global scale. You may have had a cup of coffee this morning, but it is unlikely that it was produced near you. Coffee grows best in the equatorial zone, so in North America, this means that it is produced only in Hawaii. Globally, tropical Brazil and Vietnam are the largest producers. Figure 6.6 shows the top agricultural exports by value for selected countries in 2013. If your breakfast included a banana, it may have come from Ecuador or Panama. A salad at lunch could have included olive oil from Greece and tomatoes from Morocco. Dinner could consist of rice from India and meat from Ireland. As each country specializes in what it can produce most efficiently compared to other countries, comparative advantage leads to a greater diversity of foods and a lower price than if everything was sourced locally.
Agriculture and level of development
As countries develop and become richer, the role that agriculture plays in their economy changes. Increasing development corresponds with rising levels of productivity. More machinery is used in production, transportation networks connect more farms with markets and trade hubs, better storage facilities reduce losses of product, and more chemical inputs increase yields. This means that a great deal of agricultural output can be produced per worker. As fewer workers are needed to work in agriculture, they are freed up to work in urban occupations in industry (the secondary sector) and services (the tertiary sector). With more workers in the secondary and tertiary sectors of the economy, agriculture becomes a less significant portion of economic output.
Table 6.2 shows how several agriculture-industry variables change as GDP per capita increases. Ethiopia is a very poor country, with a GDP per capita of only US $603 per year. Being a poor country, capital machinery is very limited, so many workers are needed to produce food. Because food production is very labor intensive, each worker produces only $303 worth of agricultural goods per year. Also, since many people must work in agriculture, fewer are available to work in the secondary or tertiary sectors of the economy. Thus, nearly 38 percent of Ethiopia’s GDP comes from agriculture.
Other countries with low GDP per capita are in similar situations, though not to the same degree as Ethiopia. For instance, the Philippines and Indonesia also have relatively low agricultural value added per worker, a substantial portion of their workforces in agriculture, and larger GDP contributions from agriculture.
On the other hand, developed countries with high GDP per capita, such as Germany, the United States, and Switzerland, have very productive agricultural sectors. Plentiful capital for machinery and other inputs means that fewer workers are needed in the agricultural sector. The value added in agriculture per worker in each of these countries is over $20,000, making them tens to hundreds of times more productive than in poorer countries. High agricultural productivity frees up workers to produce higher-value goods and services in urban industrial and services jobs. Therefore, very small proportions of workers are in agriculture, and national GDP relies less on agriculture and more on secondary and tertiary goods and services.
Types of agricultural activity
The level of integration into the global economy varies widely depending on the factors of production, especially in relation to the availability of capital. The most globally connected agricultural producers rely on large amounts of capital for purchasing wide tracts of high-quality land, machinery, storage and processing facilities, and means of transportation. Those least connected rely on human labor rather than capital investment to produce food for the family or small, local community.
Commercial agriculture describes production with the intent to sell for cash. The degree of labor and capital involved can vary, depending on the type of crop and the cost of human labor versus that of capital machinery. When labor is abundant and cheap, large numbers of people often work the land. When labor is scarce or expensive, capital machinery is often used in its place.
Subsistence agriculture describes systems where food is produced for consumption by the household. The objective of production is to sustain the household, not to earn cash. It tends to be labor intensive, requiring ongoing work by household members, but not capital intensive. Thus, machinery and chemical inputs tend to be limited.
While agriculture is often categorized as commercial or subsistence, production, in reality, falls along a continuum. Some commercial producers sell all of their output for cash, and some subsistence producers do not sell any. However, especially in developing countries, many farmers consume some of their output but sell some for cash.
Commercial and subsistence agriculture are often described as being intensive or extensive. Intensive agriculture involves activity that produces a larger yield per acre of land. This is achieved with large amounts of labor and/or capital. With more people and/or machinery, land can be intensively worked for optimal output. In contrast, extensive agriculture involves lower yields per acre. Less labor and capital inputs are used, and extensive agriculture can be profitable only with large quantities of land. For this reason, it functions only where land is relatively cheap and population density is low.
Large commercial agribusiness
At the top of the commercial-subsistence continuum are large agribusinesses that sell to national and international markets. These companies can be owned by families or larger groups of investors and rely on substantial amounts of capital and/or labor. Their goal is to maximize efficiency by using the latest agricultural technologies, such as hybrid seeds; fertilizers and pesticides; and production, processing, and distribution machinery. Comparative advantage drives the types of crops and animals produced by large agribusinesses. Based on the unique combinations of land, labor, and capital, production is geared toward export to distant markets. These companies supply large, vertically integrated food companies, such as Dole, Chiquita, and Archer Daniels Midland Company, that can provide everything from processing and packing of crops to retail distribution.
Commercial plantation agriculture consists of extensive, large-scale, single-crop production in the tropics and subtropics that is exported for consumption in the global market. It is very labor intensive, requiring large numbers of lower-skilled workers to cultivate and harvest crops (figure 6.7). At the same time, large amounts of capital are required for purchasing large tracts of land, for processing and storage facilities, and for transportation to export facilities in seaports and airports. Common crops include rice, pineapple, coffee, tea, rubber trees, sugarcane, oil palms, cacao, and bananas.
Plantation crops often dominate the agricultural economy of less-developed tropical and subtropical countries, mainly in Africa (figure 6.8). For instance, over half of revenue earned from crop and livestock exports in 2013 came from tobacco in Zimbabwe. Likewise, rubber in Liberia, cotton in the Central African Republic, coffee in Burundi, and cocoa in Ghana reflected over half of revenue from crop and livestock exports.
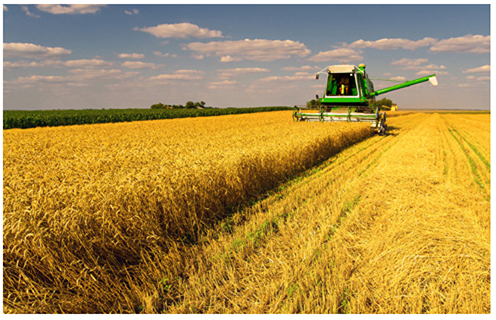
Commercial grain farming involves the extensive cultivation of wheat, barley, oats, corn, rice, and other cereals where ample land and capital machinery is available (figure 6.9). Such cereal crops are found in inland regions where summers are short and winters are cold, while rice is found in more humid and warmer environments. With a very small number of workers, commercial grain farming produces large amounts of food for the world population. This is done with modern equipment, such as combine harvesters, storage facilities, and rail and ship transportation. Some of these crops have been modified as part of the green revolution to produce higher yields and to resist pests. Nevertheless, herbicides and pesticides are often still important capital inputs. The largest producers of these crops are China, the United States, India, Russia, and Brazil, where farms are often thousands of acres in size.
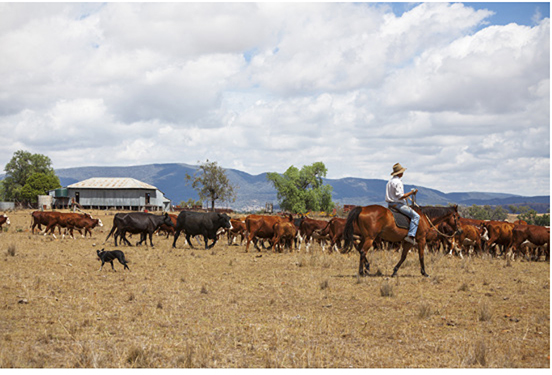
Large commercial livestock ranching requires few workers, but capital is needed to purchase large numbers of animals and for permanent water wells and facilities for shearing, holding animals, and transporting them to market. Naturally, it is an extensive operation, which requires sizable amounts of ranchland for grazing. Livestock ranching tends to take place in arid to semi-arid locations where a lack of water makes crops production less feasible. Large ranchlands can be found in places such as the prairies of Canada and the western United States, the Pampas of South America, and the Australian Outback (figure 6.10).
With a growing global middle class, more people now demand meat in their diet, increasing demand for livestock ranching. This contributes to environmental pressure, as more land is required for raising livestock. In South America, for instance, ranchers are clearing rainforest to create pastureland for cattle, threatening the habitat and native species of that landscape.
Large commercial dairy farms are common in developed countries with plentiful capital for purchasing land, animals, and milking equipment. Whereas dairy products were once sold only locally due to being highly perishable, they are now part of a global market that is facilitated by refrigeration and rapid transport. Global competition has put price pressure on farms in places such as the United States, forcing consolidation into larger, more efficient commercial enterprises (figure 6.11). In 1997, there were 252,079 US farms with milk cows, but by 2012, their number had fallen to 130,208 as small producers were pushed out of the market.
Commercial smallholder agriculture
The primary difference between large commercial agribusiness and commercial smallholder farms is the size of the enterprise, not the types of crops that are produced. In developed countries, such as the United States, these farms sell their output for cash, just as large agribusinesses do. They can produce crops such as grains, fruits, and vegetables and raise animals for meat and dairy. In 2012, about 65 percent of farms in the United States were less than 180 acres in size, with only about 9 percent of farms over 1,000 acres. Likewise, about three-quarters of farms had sales under $50,000 per year, while just under 20 percent had annual sales over $100,000. Smallholder farms may sell in local markets, but they also supply large national and international food companies with goods.
In developing countries, farms are substantially smaller than in the developed world. Table 6.3 shows the median farm size in several countries in sub-Saharan Africa, Asia, and Latin America. As the table shows, most farms are operated by smallholders. This is due to a scarcity of capital to purchase larger plots of land and limited machinery to efficiently work the land. But while many farms are small, most operate largely or partly as commercial enterprises where output is sold for cash. Hired labor can be employed during peak planting and harvesting time, and some producers have access to mechanized equipment. Despite their small size and relative inefficiency compared to larger commercial agribusiness, many of these producers supply large food companies that distribute at national and global scales. Output is also sold frequently in local markets.
One common type of production found in regions with smallholder farms is mixed farming. Mixed farming regions have a greater diversity of agricultural output than regions that specialize primarily in a limited number of crops or animals. Depending on the environment, crops can include grains, fruits, vegetables, and animal products such as meat and dairy. The advantage of mixed farming is that it can reduce economic and environmental risk for smallholders. By producing different types of crops and livestock, farmers are less exposed to price fluctuations of any single crop. Likewise, diversity can reduce risk from pests or weather fluctuations that impact some crops and animals more than others.
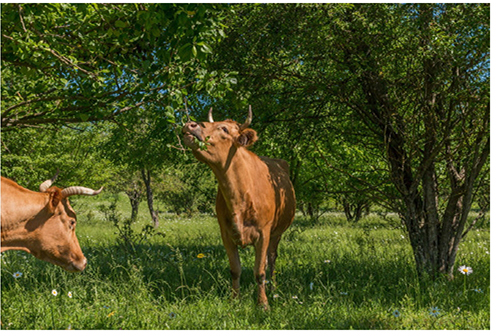
Mixed farming can take place on a single farm, referred to as on-farm mixing, where different crops and animals are raised, or within a region where individual farms specialize, known as between-farm mixing, where products are exchanged. On-farm mixing typically uses an integrated approach, where waste products are recycled on the farm. For instance, chicken droppings are used to promote algae growth in fish ponds, water from fish ponds is used to irrigate vegetables, and vegetable residues are used to feed livestock. Livestock can also graze under fruit trees, fertilizing them with their manure (figure 6.12). Between-farm mixing works in a similar way but through the exchange of waste products between different farms. For instance, cattle from one farm can provide manure fertilizer, while grain from another farm can provide livestock feed.
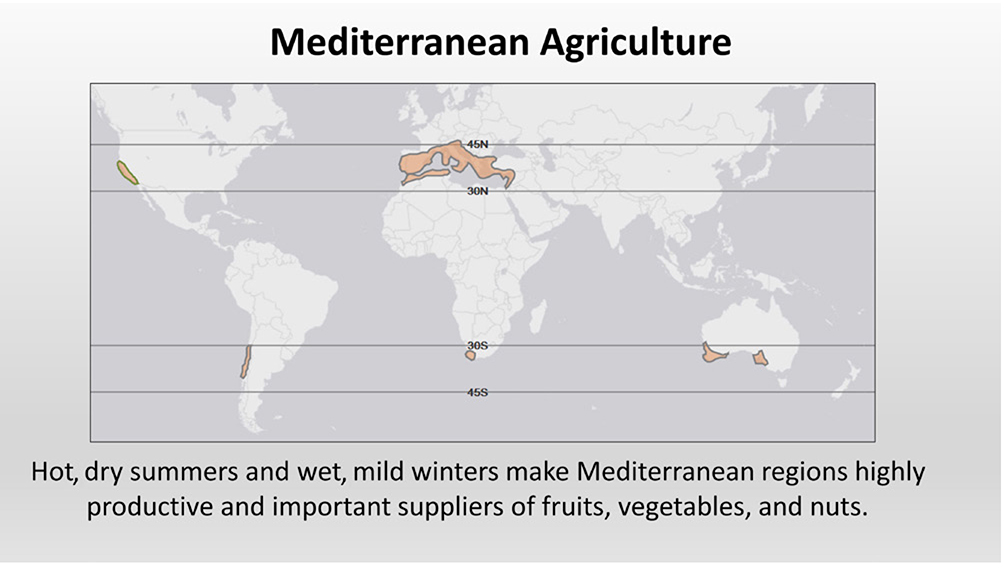
In areas with Mediterranean climates, many smallholder farmers work in Mediterranean agriculture. Mediterranean climates are those with characteristics similar to the areas around the Mediterranean Sea. These regions have mild, wet winters and hot, dry summers, and they lie roughly between 30 and 45 degrees latitude (figure 6.13). Outside of the Mediterranean Sea region, Mediterranean climates are located on the western or southwestern coasts of continents, which include California, central Chile, and the southwestern portions of South Africa and Australia.
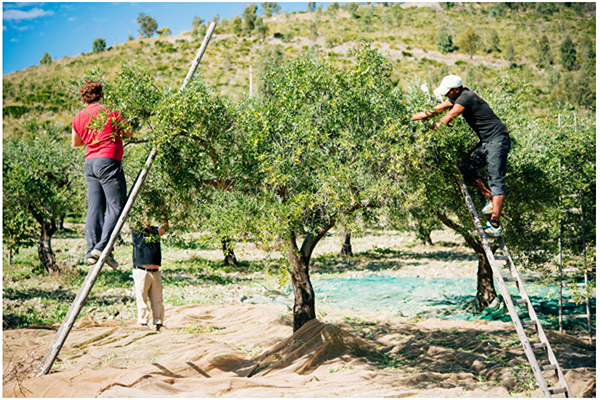
Mediterranean agriculture, as with agriculture in all regions, is influenced by environmental characteristics. With only seasonal rainfall, it is not suitable for water-intensive crops such as rice unless irrigation from other regions can be brought in. However, ample year-round sunshine and short frost periods allow for a wide range of crops and livestock. In these regions, barley, oats, wheat, olives, citrus and deciduous fruits, cotton, and other goods are produced (figure 6.14) either in labor-intensive or in capital-intensive manners, depending on the availability and cost of each.
Based on 2013 export values of crops and livestock, Spain, Italy, and Chile all earned the largest portion of their revenue from wine made of locally grown grapes. Greece earned substantial revenue from olive oil, while California produced nuts, dairy, and wine. When capital and labor are available in sufficient amounts, productivity in Mediterranean agriculture regions can be high. California alone provides over one-third of the United States’ vegetables and two-thirds of its fruits and nuts. Likewise, Spain and Italy are the largest producers of fresh fruits, especially grapes and citrus, in the European Union. Although Mediterranean agriculture traditionally has been produced by smallholder farmers, it too is consolidating into larger commercial enterprises as global competition creates pressure to increase efficiency, pushing small producers out of the market.
Subsistence agriculture
While the difference between large commercial agribusiness and commercial smallholder agriculture is based largely on size of the enterprise, the difference between commercial smallholder and subsistence agriculture is based more on the proportion of output that is consumed by the household. Today, very few farmers are so isolated that they do not sell or trade any of their output. However, many consume most of what they produce, selling only small amounts of surplus each year. Subsistence farming is largely labor intensive, with limited capital available for purchasing land, livestock, or machinery that would allow greater commercial production.
Nomadic herding involves the raising of animals such as cattle, goats, sheep, yaks, camels, musk oxen, and more, without having a permanent home base. Nomadic herders live in family or tribal groups and move from place to place in search of forage and water for their animals. They are typically found in regions that are arid or semi-arid and thus not well suited for agriculture. Given the arid nature of the landscape and the large area needed to support nomadic herding, it is considered a form of extensive agriculture. While historically nomadic herding is considered subsistence agriculture, today herders may work for wages or sell or trade some of their animals for other goods and services. Nomadic herding requires minimal to no capital machinery but rather relies on a small number of herders to move flocks.
The Sahel region of Africa, an environmental transition region that lies south of the Saharan desert and north of more fertile savanna landscapes, has one of the largest populations of nomadic herders today (figure 6.15). In recent years, conflict between nomadic herdsmen and farmers has increased as drought conditions dry up grazing lands and growing populations convert land to urban and farm uses.
Another traditional form of subsistence agriculture is shifting cultivation, also known as swidden agriculture. This is the process by which land is cleared for farming, used until soil nutrients are exhausted, then abandoned and left to regenerate. In many cases, vegetation is cut and burned so that ash enriches the soil. This process is known as slash-and-burn agriculture (figure 6.16). Shifting agriculture is commonly practiced in low-latitude tropical regions of Latin America, Africa, and Asia, where heavy rainfall leaches away soil nutrients in a relatively short time once the natural vegetation is removed. A plot of land can typically be used for a few years before the soil is exhausted and the land abandoned. Shifting cultivation uses human labor more than capital, as people clear land with basic tools and lack capital inputs such as fertilizers to replace soil nutrients.
This form of agriculture has been used sustainably for thousands of years, as villagers cleared land, farmed it, then let it regenerate. However, in places where populations are increasing and land becomes more valuable, forests are increasingly being cut permanently and not allowed to regenerate, leading to increasing deforestation.
Throughout much of South Asia, Southeast Asia, and East Asia, intensive subsistence rice cultivation has been an important form of agriculture. In poorer communities, it has maintained relatively large populations for centuries. Rice requires large amounts of water, so paddies can be developed only in irrigable deltas, floodplains, coastal plains, and terraces. Production relies on large amounts of labor but limited capital machinery (figure 6.17). Nearly all work is performed by hand, with animals assisting in the plowing of fields. Given that this type of agriculture is labor intensive, output per capita is relatively low, and poverty levels are high.
Local patterns of agricultural production
Zooming in to a larger scale, it is also possible to see the spatial distribution of agriculture in local areas. Naturally, the environment plays a role in the specific types of crops grown in a local area. But more important, economic factors, especially as they relate to distance, shape agricultural production patterns.
Johann Heinrich von Thunen’s work from 1826 is one of the most influential in agricultural economic geography. Von Thunen was one of the pioneers in describing the role of accessibility in land use. Land that is close to settled areas has a higher value in that it is more accessible to people. People will bid higher prices for land that is easily accessible, since transportation costs in terms of time and money are lower. As one moves farther from settled areas, transportation costs increase, thus making peripheral land less accessible and less valuable.
Based on the idea of accessibility, von Thunen developed a generalized model of agricultural location based on three key variables: revenue per unit area, land cost, and transportation cost. Based on these variables, the von Thunen model illustrates how agricultural land uses will form rings around urban consumer markets (figure 6.18). As we saw in chapter 5 with urban land uses, the cost of land is greatest near the center of a city or town. Near the center, transportation costs to reach market are low. With distance from town, transportation costs increase, thus driving down land costs.
Per the von Thunen model, agricultural rings form as follows:
•Market gardening and dairy farming. Close-to-town agriculture is intensive, with high levels of output per unit area. Vegetables and milk bring higher revenues per unit area of land and are difficult to transport due to their perishability. Farmers produce these products in the first ring, delivering them to market daily.
•Silviculture. This ring consists of forest land for fuelwood and construction timber. While these products are not perishable, they are heavy and bulky, so transportation costs are high. This makes their production feasible only in areas relatively close to market.
•Crop farming. As one moves farther from urban markets, agricultural production becomes more extensive. In this ring are found crops that earn lower revenue per unit area of land and are easy to transport. Wheat, corn, and other grain crops need more land for their production and can be transported relatively easily to urban markets without risk of perishing in route.
•Livestock grazing. The outer ring consists of extensive areas of land used for grazing by cows, sheep, goats, and other animals. Very large tracts of land are required for grazing, resulting in low revenue per unit area. While meat is perishable, animals can be transported live to slaughterhouses close to urban markets.
The von Thunen model was developed in the early nineteenth century, a time when refrigeration was close to nonexistent and agricultural products were brought to market by farmers in horse-drawn wagons. Refrigeration technology has now become widespread, and transportation connections now link lands worldwide, thus reducing the applicability of the model. As discussed in the previous section, comparative advantage and trade allow for specialization over much larger regions.
Nevertheless, the von Thunen model can still describe agricultural patterns in some cases. In poorer, less-developed places, where refrigeration and transportation are limited, the model is more likely to apply. Furthermore, the von Thunen model applies to modern urban farmer’s markets in developed countries. The idea behind urban farmer’s markets is that consumers can purchase locally grown fruits and vegetables that have traveled short distances from nearby farms. The intended benefits are that the produce has not been frozen or refrigerated for long journeys and therefore is fresher and more flavorful.
Local versus global agriculture
Although much food is produced globally based on the concept of comparative advantage, some farmers still grow crops, especially higher-value fruits and vegetables, close to urban areas, as per the Von Thunen model. So, which should a consumer choose? Some people emphatically defend a locavore approach, arguing that buying locally produced agricultural goods offers a wide range of environmental, economic, and social benefits. Other people prefer the efficiency and convenience of buying globally produced food.
Those who promote buying locally produced foods focus on several perceived benefits. From an environmental standpoint, it is argued that locally produced food creates less greenhouse emissions, since food is transported tens of miles rather than hundreds or thousands of miles. Transporting a local crop forty miles to an urban market requires less fuel and therefore has less of an environmental impact than transporting a globally produced crop 1,500 miles.
Another potential benefit of locally produced food is that is it fresher and more flavorful. It does not have to be frozen or preserved with synthetic chemicals for shipment to another country or continent. Correspondingly, different produce is consumed according to the season in a manner that is more in tune with the natural environment.
Another stated benefit of locally produced food is social. By purchasing locally produced foods at a farmer’s market, it is possible to have a personal relationship with the farmer. This may reflect a nostalgic desire for a more “analog” life, with interaction at a human scale, in a time when it is easier to simply click a computer screen and have groceries delivered directly to your home (figure 6.19).
Lastly, promoters of locally produced food make an economic argument: that when people buy locally, money stays within the community. This can help with local economic development by circulating the money locally.
Those who promote a global approach to food production say that the case in favor of locally produced food is not so clear. As the underlying goal of comparative advantage is to produce efficiently, goods can typically be raised at a lower cost and sold to consumers at a lower price. This is a very important issue for low-income households around the world. However, if consumers purchase locally grown foods in places with large agricultural economies during peak season, there may be some cost savings as compared to purchasing globally grown foods.
The environmental case for locally produced food is also less clear. While shorter distance transportation can reduce energy use and carbon emissions, much more energy is used in agricultural production than in transportation. One study has shown that 83 percent of emissions occur during food production, making the argument in favor of production efficiency even more salient. Just consider how much less energy can be used to produce tomatoes in Spain for shipment to Sweden as compared to growing tomatoes locally in Sweden. In fact, what one consumes can have a greater impact on carbon emission than how far food travels. By switching from red meat and dairy to chicken, fish, and vegetables, greenhouse gas emissions can be reduced significantly because cows consume large amounts of grain and because they produce substantial amounts of methane, a greenhouse gas.
While locally produced food may indeed be fresher, the global agricultural economy allows for a greater diversity in diets. Southern hemisphere countries can supply the north with fruits and vegetables in January, while the opposite is true in August. In much of the world, diets would be much more limited if the only produce available was from locally grown sources.
Lastly, global trade in agricultural goods can help farmers in developing countries earn more money and expand their economies. As developing countries grow wealthier and global aggregate demand increases, they have more money to purchase goods and services from developed countries, including different agricultural goods, more sophisticated manufactured goods, and consumer and professional services (figure 6.20).
Ultimately, it is likely that people will buy some combination of locally and globally grown foods, depending on what is produced locally, the season, and personal preference. For many people in developed countries, a quick stop by the grocery store can be convenient, but a nice stroll through a farmer’s market may be more pleasant. In developing countries, many will choose the lower costs of locally grown seasonal foods, with only occasional purchases of essentials that cannot be provided locally.
Go to ArcGIS Online to complete exercise 6.2: “Agriculture and development,” and exercise 6.3: “Farmer’s markets: Consumption patterns of buying locally.”
Agriculture and sense of place
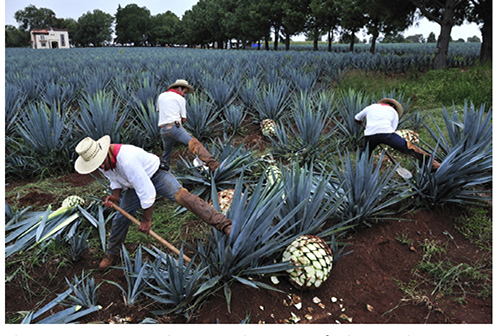
As you’ll recall from chapter 1, the unique combination of physical and human features can form a strong sense of place. In many parts of the world, agriculture and agricultural products are key components that contribute to the unique “personality” of places. For instance, what would Napa Valley be without wine? Georgia is known as the Peach State. When many people think of Mexico, tequila comes to mind, while coffee is associated with Colombia. The association between agricultural products and specific places invokes an important essence of a place, be it a hot cup of Colombian coffee at a café in Bogotá or a cool margarita on a beach in Cancún.
Typically, the association between agricultural goods and places is based on centuries, if not millennia, of traditional knowledge that formed from the combination of unique environmental characteristics and cultural practices. Authentic parmesan cheese comes from several northern provinces of Italy, where the cows are fed with locally grown fodder and production processes have been traced back at least to the fourteenth century. Likewise, wine production in Champagne, France, goes back to the ancient Roman empire 2,000 years ago. The climate and soils of this region, combined with specialized techniques for growing grapes and processing and fermenting them, make it world famous for its sparkling wine. Colombian coffee gets its uniqueness from the Andes’ volcanic soils and climate patterns that cross between the Amazon basin and the Pacific and Atlantic oceans.
Because of the close relationship between environment and cultural traditions, many producers argue that products cannot be created in just any place. They are not simply a recipe to be copied but something that can be produced only in a specific location in a specific manner. In an attempt to protect place-based agricultural products from inauthentic imitators, legal systems have been put in place in many countries and regions. In essence, these legal protections function similarly to copyrights, but they are tied to specific places rather than specific companies.
For instance, the European Union protects hundreds of products on the basis of their place of origin. These include feta cheese that can be produced only in Greece and champagne and other wines that must come from specific regions in Europe. Some but not all of these protections apply in the United States. For example, parmesan cheese sold in the European Union must be from specific regions of northern Italy, but the rule does not apply to parmesan sold in the United States. The same holds true for champagne, where sparkling wines produced in California can carry the same name. Within the North American Free Trade Agreement (NAFTA), tequila and its coarser cousin, mescal, can be produced only in Mexico, while Canadian whiskey can come only from Canada and bourbon whiskey from the United States (figure 6.21). Other places-of-origin protections include Colombian coffee and Napa Valley wine.
These protections have two major goals. One is to protect traditional culture. Since most protected agricultural products have long histories in their place of production, legal protection can help preserve traditional production methods and prevent mass-produced copies from places without the same environment or indigenous knowledge. In short, it can help preserve and enhance the sense of place of many rural communities. The other goal is simply economic. By legally protecting an agricultural product, producers in the region face less competition from firms in other places. Marketing campaigns can be developed to promote exports and attract tourists, contributing to rural economic development.
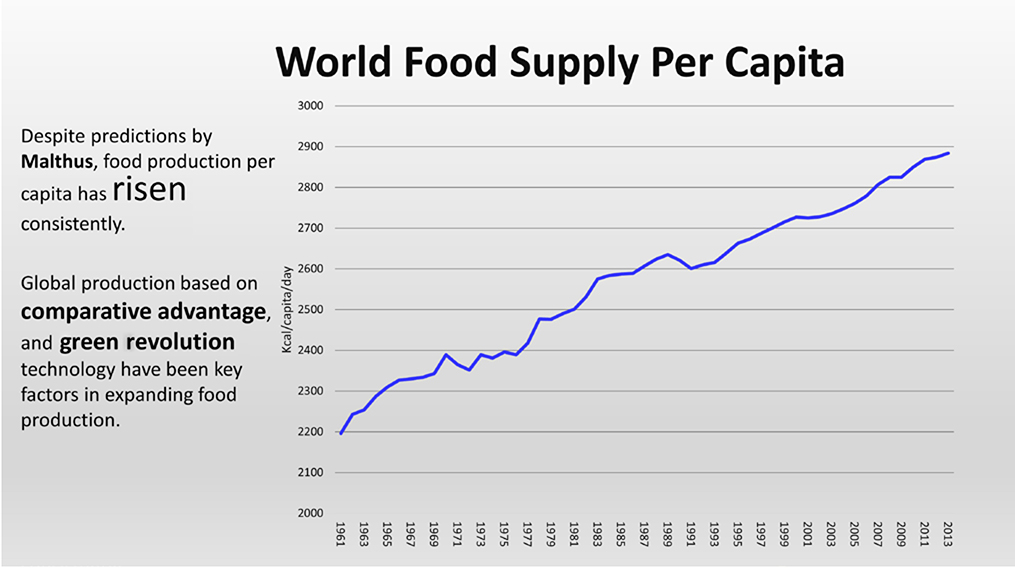
Hunger and food security
Ultimately, the most important reason for understanding the geographic patterns of agriculture is that it is what sustains human life on our planet. The global population continues to grow, although not as quickly as in previous decades, meaning that more food must be produced to sustain it. As you’ll recall from chapter 2, a Malthusian catastrophe has been avoided so far, as world food supply has grown faster than population (figure 6.22). More food has meant less undernourishment. Figure 6.23 shows that the average proportion of undernourished people in a sample of about 100 developing countries has fallen by nearly ten percentage points since 1989. Data is not available for earlier years, but it can be assumed that it has fallen even more so since the 1960s, when the green revolution was beginning to increase crop yields.
So, the good news is that overall food production has increased relative to population growth, resulting in less global hunger. The benefits of the green revolution and the efficiencies gained through comparative advantage have saved millions from hunger and starvation. But with that said, there is still much work to be done.
Before moving on, it is important to define the terms hunger and food insecurity. Hunger was traditionally used by geographers and others to describe a prolonged lack of food. Typically, places with high rates of hunger would have high rates of stunted growth and underweight people. Food security or insecurity is now preferred as a broader concept. Food security includes not only access to food but also quality and diversity necessary for a healthy diet. Hunger is one result of food insecurity.
Hunger and food insecurity are still grave problems in too many parts of the world. Figure 6.24 shows the wide variation by region in undernourishment. In the region of Middle Africa, over 40 percent of the people are undernourished, while East Africa is just slightly better off at over 30 percent. In the third-highest region, South Asia, over 15 percent of the population is undernourished.
Further evidence of hunger is shown in figure 6.25 that describes a sample of countries where over 20 percent of children under age 5 are underweight. Low weight for children is associated with increased risk of mortality as well as a child’s growth potential. It can lead to lifelong cognitive and physical impacts, which can limit economic opportunities for the individual and, collectively, for a country.
The economic foundation of food insecurity
Based on the world food supply per capita in figure 6.22, it is clear that there is more food than ever, yet hunger persists in some places. But availability of food must also be accompanied by accessibility and quality. Most hunger is due to a lack of access to food, while in some cases, it is caused by the wrong types of foods. Poverty is one of the most powerful causes of hunger, and it is typically the poorest of the poor within a country who have insufficient food. When a country is poor, such as in much of Africa and parts of Asia, higher numbers of people struggle to find adequate nutrition on a regular basis.
At the individual level through the societal level, poverty that results in food insecurity often leads to a vicious cycle of ongoing poverty and hunger. When people are hungry or undernourished, they are sicker and less economically productive, making it difficult to rise out of poverty and attain food security. This is obviously bad for individuals and households, but in aggregate, high rates of undernourishment can also hold back overall development of a country. For instance, the sub-Saharan country of Malawi loses about US $600 million annually due to child undernutrition. Poor health from undernourishment increases costs in medical care and lost income from family members who must care for the ill. From an educational standpoint, losses come from grade repetition and lower levels of school retention. Extra time spent repeating classes has a direct cost on schools, while children who drop out have lower levels of human-capital skills. Ultimately, a sicker and less-educated population lowers overall productivity of the workforce, thus reducing economic potential.
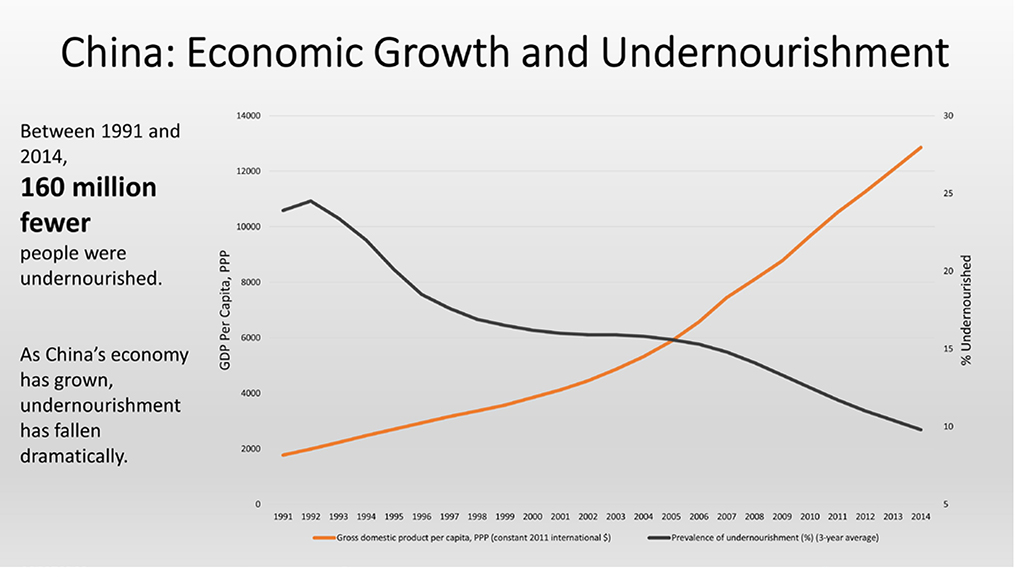
Economic growth is the surest way to reduce poverty and, in turn, food insecurity. In recent years, China’s economic growth has pulled millions of people out of poverty. As seen in figure 6.26, as GDP per capita has increased, the proportion of undernourished has decreased correspondingly. In 1991, nearly 24 percent of China’s population was undernourished, but by 2014, the proportion had fallen to under 10 percent. This represents 160 million fewer undernourished people between 1991 and 2014.
However, when economic growth is not inclusive, that is, when a substantial segment of the population does not benefit from a growing economy, then poverty and undernourishment can remain high. This was the case in the United Republic of Tanzania through much of the 1990s and 2000s (figure 6.27). In this case, economic liberalization unleashed economic growth, but many people, such as smallholder farmers without access to capital and export markets, were unable benefit from growth. Despite economic growth, the rate of undernourishment is higher than in the early 1990s.
To reduce food insecurity, countries need to ensure that smallholder farmers can increase productivity through training on land, soil, and water management and access to capital inputs such as fertilizer and improved seeds. Better access to markets, both domestic and international, can also help increase rural incomes. This requires improvements in transportation infrastructure as well as international trade agreements that benefit large and small farmers alike. With greater productivity and higher rural incomes, fewer people are likely to suffer from food insecurity. Targeted social protection programs can also help. For example, school lunch programs can ensure not only that more children attend but also that they have at least one adequate meal per day.
Protracted crises and food insecurity
Food insecurity and hunger also increase when a protracted crisis strikes a place. Crises can include conflict, such as warfare and civil unrest, and natural disasters, such as drought and disruption from climate change. With crises such as these, agricultural production is disrupted as agriculturalists become internally displaced or are forced to emigrate to other countries. Markets become disrupted as well because transportation routes become dangerous to travel and roads and bridges are destroyed. With a decline in food production and restricted market activity, prices rise, making the limited amounts of food unaffordable to many households. In the worst cases, situations of hunger and undernourishment can slip into famine, where there is an extreme lack of food, and starvation and death are clearly apparent.
Often, conflict and natural disaster intertwine to cause food insecurity. For instance, drought may reduce food supply, increasing competition between groups for scarce resources. This can take place in the form of competition between producers over limited water and arable land or between consumers facing rising food prices and scarcity. At the same time, conflict can exacerbate environmental stresses. A manageable drought can become unmanageable if conflict disrupts irrigation and transportation infrastructure or cuts off food aid to distressed locations.
Looking forward, climate change is likely to have an increasing impact on food insecurity. Sub-Saharan Africa will see lower yields of all-important cereal crops such as maize, as the frequency of extremely dry and extremely wet years increase. In Asia, higher temperatures will reduce yields of the region’s most important staple, rice. Likewise, wheat and maize yields will decline in North Africa and the Near East. Poor regions such as these that already have food insecurity will be less able to adapt to changes as economic resources to help agricultural producers adapt are limited.
In 2017, nearly five million people faced food crises, with 100,000 facing famine, in the young country of South Sudan. With its independence from Sudan in 2011, there was great hope that South Sudan would move in a direction of greater economic and social development. However, civil war based on political and ethnic divisions soon ripped the new country apart (figure 6.28). This led to millions of internally displaced people and refugees. Following the typical pattern, crop production fell, food could not get to markets, foreign aid supplies were interrupted, and prices skyrocketed.
Similarly, conflict in northern Nigeria in 2017 led to food crises. The terrorist organization Boko Haram, which affiliated itself with Islamic State, used violence and kidnapping in an attempt to carve out an independent state in this region, resulting in over 20,000. Combined with poverty and environmental degradation, the resulting large-scale displacement of people reduced crop production and markets.
In the Western Hemisphere, the poverty-stricken country of Haiti has faced severe food insecurity due to environmental shocks. A major earthquake devastated Port-au-Prince in 2010 (figure 6.29). Before it could fully recover, a major drought reduced food output in 2015, while a devastating hurricane struck in 2016. In a country where three-quarters of the population lives on less than $2 per day, the ability to absorb environmental shocks is severely limited. Current models predict that tropical regions of Latin American and the Caribbean, such as where Haiti is located, will face lower agricultural productivity from climate change–induced heat stress and drought.
Food insecurity in the developed world: Food deserts
Whereas food insecurity in developing countries such as South Sudan, Nigeria, and Haiti often manifests as a lack of calories, in the developed world, food insecurity more often consists of inadequate nutrition. In the United States in 2015, 5 percent of households had very low food security, where at least one person had disrupted food intake during the year. Another 7.7 percent of households faced low food security, where less diverse food was consumed or food was obtained from federal food assistance programs or community food pantries.
From a geographic standpoint, malnutrition can be seen as a combination of low income and low access to nutritious food. Food deserts are places where low levels of income and access act as barriers to food security. Some urban neighborhoods and rural communities are not served by supermarkets or grocery stores that provide healthy and affordable food. When this is combined with poverty, where people lack vehicles and adequate public transit, people are often forced to rely on local convenience stores or fast-food restaurants for meals. These typically offer fewer nutritious options, such as a large produce section, and charge higher prices than large, efficiently run supermarkets. Beer and candy may be readily accessible in local convenience stores, but fresh fruits and vegetables are less so.
In the United States, food deserts have been found in a number of urban and rural areas. Figure 6.30 shows food deserts in New Orleans. These places have been identified as census tracts where at least 100 households are low income, lack a supermarket within a half mile, and do not have a vehicle. With a substantial number of low-income households without vehicles, people in these areas are more likely to purchase food at nearby corner convenience stores or possibly fast-food restaurants. As seen in the figure, not all low-income census tracts are food deserts according to this definition. In many low-income communities, the vast majority of households have access to a vehicle and can drive to supermarkets that are outside of the immediate neighborhood. Likewise, there are supermarkets found in some low-income neighborhoods. It is the combination of poverty, lack of access, and lack of a vehicle that limits food options for people.
It should be noted, however, that access to nutritious foods does not guarantee that people will consume them. Some research shows that even when supermarkets with healthy options are opened in places that were formerly food deserts, people’s diets do not change. Two factors may explain why some people do not improve their diet when options become available. First, “junk food” with lots of calories per gram are substantially cheaper than healthier fruits and vegetables. Thus, for low-income households, it is cheaper to satiate hunger with less-healthy foods. Second, poor eating habits are closely associated with education levels, especially of mothers. Merely adding a grocery store to a community will have limited impact on eating habits when dietary knowledge is limited and unhealthy habits are ingrained.
The challenge of food loss and food waste
As a final note on hunger and food security, it is important to understand the role that food loss and food waste play in our global food supply. On a positive note, food production is up and malnutrition is down. Yet, populations continue to grow, and pockets of food insecurity persist. To reduce food insecurity and feed a growing world population, as much food as possible must get from the fields to people’s mouths. Yet, astonishingly, around one-third of the food produced for humans gets lost or wasted each year. Food loss occurs between production and arrival at a retail market, while food waste is when food spoils or is discarded by retailers or consumers (figure 6.31). Generally, there is more food loss in developing countries, while food waste is a greater problem in developed countries.
In Africa, a place with relatively high levels of food insecurity, food is lost to mold, insects, and rodents due to inadequate storage facilities. Without refrigeration, dairy and fish perish, while vegetables such as tomatoes rot and get crushed in transit on bumpy, slow roads. In India, another place with high levels of food insecurity, the same is found. But waste is not exclusive to poor developing countries and regions. In rich countries, crops are left in the field or turned into compost merely because they are not the right size, shape, or color.
Food waste is a greater concern in richer developed countries. There, consumers waste nearly as much food as that which is produced in sub-Saharan Africa on an annual basis. Waste occurs when consumers throw away food at restaurants and at home and when businesses throw away unsold product when new deliveries arrive.
In Europe alone, food waste could feed 200 million people, while food loss in Africa could feed an additional 300 million. To reduce food loss, better storage and transportation infrastructure is needed in developing countries, a great challenge given economic constraints. Getting people in developed countries to waste less may be just as difficult. Possible solutions include smaller restaurant portions and better descriptions of production “use by” dates so that people do not immediately toss items out. There are even businesses now that sell “ugly” or “imperfect” fruits and vegetables, creating a market for items that would have previously been thrown away by farmers or grocers.
Go to ArcGIS Online to complete exercise 6.4: “Food deserts and racial disparities,” and exercise 6.5: “Undernourishment and development.”
References
Boone-Heinonen, J., P. Gordon-Larsen, C. I. Kiefe, J. M. Shikany, C. E. Lewis, and B. M. Popkin. 2011. “Fast Food Restaurants and Food Stores: Longitudinal Associations with Diet in Young to Middle-aged Adults: The CARDIA Study.” Archives in Internal Medicine 171, no 13: 1162–70. doi: https://doi.org/10.1001/archinternmed.2011.283.
Bornstein, D. 2012. “Time to Revisit Food Deserts.” New York Times, April 25, 2012. https://opinionator.blogs.nytimes.com/2012/04/25/time-to-revisit-food-deserts/?_r=0.
Brouwer, C., and M. Heibloem. 1986. Irrigation Water Management: Irrigation Water Needs. Rome: Food and Agriculture Organization of the United Nations. http://www.fao.org/docrep/s2022e/s2022e00.htm.
California Department of Food and Agriculture (CDFA). 2015. 2015 Crop Year Report. Sacramento, CA: CDFA. https://www.cdfa.ca.gov/statistics.
Centre for the Promotion of Imports (CBI). 2015. CBI Trade Statistics: Fresh Fruit and Vegetables in Europe. The Hague, Netherlands: CBI Ministry of Foreign Affairs. https://www.cbi.eu/sites/default/files/market_information/researches/trade-statistics-europe-fresh-fruit-vegetables-2015.pdf.
Cho, R. 2012. “How Green Is Local Food?” State of the Planet. Earth Institute, Columbia University blog comments. http://blogs.ei.columbia.edu/2012/09/04/how-green-is-local-food.
Dallman, P. 1998. Plant Life in the World’s Mediterranean Climates: California, Chile, South Africa, Australia, and the Mediterranean Basin. Berkeley, CA: University of California Press.
Dean, A. 2007. “Local Produce vs. Global Trade.” Global Policy Forum. Carnegie Council for Ethics in International Affairs. https://www.globalpolicy.org/component/content/article/220/47372.html.
DeWeerdt, S. 2009. “Is Local Food Better?” World Watch Magazine 22, no. 3 (May-June). http://www.worldwatch.org/node/6064.
Diamond, J. M. 2017. Guns, Germs, and Steel: The Fates of Human Societies. New York: W.W. Norton.
Economic Research Service, US Department of Agriculture (USDA). 2017. Food Access Research Atlas. Washington, DC: USDA. https://www.ers.usda.gov/data-products/food-access-research-atlas.
The Economist. 2014. “The New Green Revolution: A Bigger Rice Bowl.” The Economist, May 10, 2014. http://www.economist.com/news/briefing/21601815-another-green-revolution-stirring-worlds-paddy-fields-bigger-rice-bowl.
Evenson, R. E. 2003. “Assessing the Impact of the Green Revolution, 1960 to 2000.” Science 300, no. 5620: 758–62. doi: https://doi.org/10.1126/science.1078710.
Federación Nacional de cafeteros. “Colombian Coffee Is Unique.” https://www.federaciondecafeteros.org/particulares/en/nuestro_cafe/el_cafe_de_colombia.
Folger, T. 2014. “The Next Green Revolution.” National Geographic, October, 2014. http://www.nationalgeographic.com/foodfeatures/green-revolution.
Food and Agriculture Organization of the United Nations (FAO). 2015. The State of Food Insecurity in the World (SOFI) 2015. FAO Agriculture and Economic Development Analysis Division. http://www.fao.org/3/a-i4646e.pdf.
———. “Climate Change, Agriculture, and Food Security.” The State of Food and Agriculture 2016. FAO. http://www.fao.org/publications/sofa/2016/en.
Food Security Information Network (FSIN). 2017. Global Report on Food Crises 2017. Rome: FSIN. http://www.fao.org/3/a-br323e.pdf.
Fuller, D. Q., T. Denham, M. Arroyo-Kalin, L. Lucas, C. J. Stevens, L. Qin, R. G. Allaby, and M. D. Purugganan. 2014. “Convergent Evolution and Parallelism in Plant Domestication Revealed by an Expanding Archaeological Record.” Proceedings of the National Academy of Sciences 111, no. 17: 6147–52. doi: https://doi.org/10.1073/pnas.1308937110.
Hakim, D. 2016. “Doubts About the Promised Bounty of Genetically Modified Crops.” New York Times, October 29, 2016. https://www.nytimes.com/2016/10/30/business/gmo-promise-falls-short.html?_r=0.
International Coffee Organization. 2016. “Trade Statistics Tables.” http://www.ico.org/trade_statistics.asp?section=Statistics.
Jennings, R. 2013. “What Makes Champagne Special? A Brief History.” The Huffington Post, December 6, 2013. https://www.huffpost.com/entry/what-makes-champagne-spec_b_4278904.
MacDonald, J. M., P. Korb, and R. A. Hoppe. 2013. Farm Size and the Organization of U.S. Crop Farming. Washington, DC: US Department of Agriculture, Economic Research Service.
Mailin, J. 2017. “The 100-Year-Old Loophole That Makes California Champagne Legal.” VinePair blog. https://vinepair.com/wine-blog/loophole-california-champagne-legal.
Martin, K., and J. Sauerborn. 2013. “Origin and Development of Agriculture.” In Agroecology. Netherlands: Springer.
McMillan, T. 2016. “Shift to ‘Food Insecurity’ Creates Startling New Picture of Hunger in America.” National Geographic, July 2016. http://news.nationalgeographic.com/news/2014/07/140716-hunger-america-food-poverty-nutrition-diet.
Nair, K., G. W. Crawford, K. Mellanby, W. D. Rasmussen, G. Ordish, and A. W. Gray. et al. 2017. “Origins of Agriculture.” Encyclopædia Britannica. https://www.britannica.com/topic/agriculture#toc10760.
Nunn, N., and N. Qian. 2010. “The Columbian Exchange: A History of Disease, Food, and Ideas.” Journal of Economic Perspectives 24, no.2: 163–88. doi: https://doi.org/10.1257/jep.24.2.163.
National Coffee Association of USA. “Coffee Around the World.” http://www.ncausa.org/About-Coffee/Coffee-Around-the-World.
National Geographic Society. 2012. “Ranching.” National Geographic Society Resource Library. https://www.nationalgeographic.org/encyclopedia/ranching.
Olmsted, L. 2016. “Most Parmesan Cheeses in America Are Fake, Here’s Why.” Forbes, November 19, 2016. https://www.forbes.com/sites/larryolmsted/2012/11/19/the-dark-side-of-parmesan-cheese-what-you-dont-know-might-hurt-you/#4b00374e4645.
Parker-Pope, T. 2007. “A High Price for Healthy Food.” New York Times, December 5, 2007. https://well.blogs.nytimes.com/2007/12/05/a-high-price-for-healthy-food/?_r=0.
Pirog, R, and McCann, N. 2009. “Is Local Food More Expensive? A Consumer Price Perspective on Local and Non-Local Foods Purchased in Iowa.” Leopold Center for Pubs and Papers 63. Iowa State University. https://lib.dr.iastate.edu/leopold_pubspapers/63/l.
Price, T., and Bar-Yosef, O. 2011. “The Origins of Agriculture: New Data, New Ideas: An Introduction to Supplement 4.” Current Anthropology 52, no. S4: S163−74. doi: https://doi.org/10.1086/659964.
Reardon, T. 2016. “Growing Food for Growing Cities: Transforming Food Systems in an Urbanizing World.” Chicago Council on Global Affairs. https://www.thechicagocouncil.org/publication/growing-food-growing-cities-transforming-food-systems-urbanizing-world.
Royte, E. 2014. “One-Third of Food Is Lost or Wasted: What Can Be Done.” National Geographic, October 13, 2014. http://news.nationalgeographic.com/news/2014/10/141013-food-waste-national-security-environment-science-ngfood.
Schiere, H., and L. Kater. 2001. Mixed Crop-Livestock Farming: A Review of Traditional Technologies Based on Literature and Field Experience. Rome: Food and Agriculture Organization of the United Nations, Animal Production and Health Division.
Simon, J. 2017. “Clashes Over Grazing Land in Nigeria Threaten Nomadic Herding.” NPR, April 23, 2017. http://www.npr.org/sections/goatsandsoda/2017/04/23/525117431/clashes-over-grazing-land-in-nigeria-threaten-nomadic-herding.
Thompson, F. 1968. “The Second Agricultural Revolution, 1815−1880.” The Economic History Review, 21, no. 1, new series: 62-77. doi: https://doi.org/10.2307/2592204.
Thornton, P. K., and M. Herrero. 2015. “Adapting to Climate Change in the Mixed Crop and Livestock Farming Systems in Sub-Saharan Africa.” Nature Climate Change 5, no. 9: 830–36. doi: https://doi.org/10.1038/NCLIMATE2754.
United Nations World Food Programme. 2015. The Cost of Hunger in Malawi. http://www.wfp.org/content/cost-hunger-malawi.
US Department of Agriculture (USDA). 2012. “2012 Census of Agriculture.” USDA National Agricultural Statistics Service. https://www.agcensus.usda.gov/Publications/2012.
———. 2015. “A Data Portrait of Smallholder Farmers.” USDA fact sheet. http://www.fao.org/family-farming/detail/en/c/385074.
Utting, P. 2015. Revisiting Sustainable Development. Geneva: United Nations Research Institute for Social Development.
Whittlesey, D. 1936. “Major Agricultural Regions of the Earth.” Annals of the Association of American Geographers 26, no. 4: 199–240.
World Health Organization. 2014. “Frequently Asked Questions on Genetically Modified Food.” http://www.who.int/foodsafety/areas_work/food-technology/faq-genetically-modified-food/en.
World Intellectual Property Association. 2015. “The King of Cheese and Its IP Crown.” http://www.wipo.int/ipadvantage/en/details.jsp?id=3664.
Zwerdling, D. 2009. “‘Green Revolution’ Trapping India’s Farmers in Debt.” NPR, April 14, 2009. http://www.npr.org/2009/04/14/102944731/green-revolution-trapping-indias-farmers-in-debt.