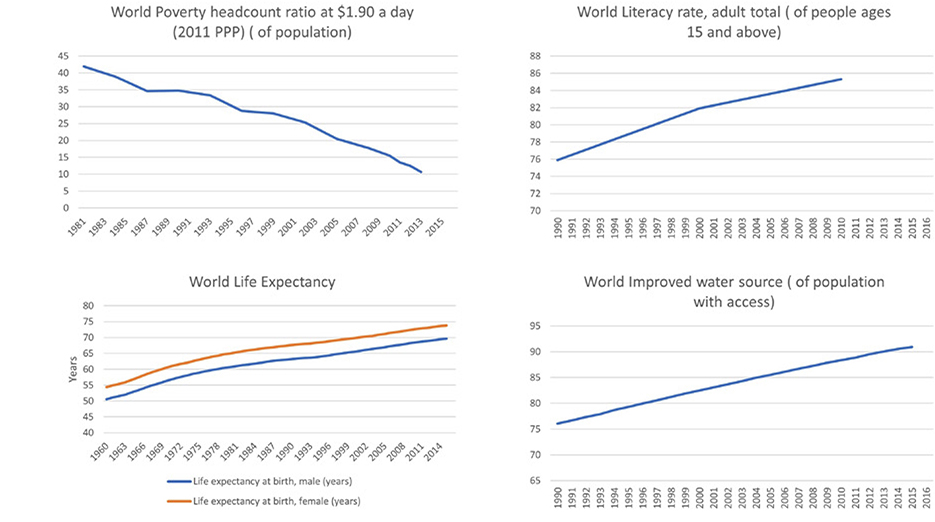
Figure 9.1.Improving human development: Selected measures. Data source: World Bank.
Chapter 9
Development
Famine, poverty, illiteracy, illness, early death. These are staples of the news we see each day. In many parts of the world, people struggling to survive or improve their lives are held back by poverty and lack of opportunity. But while these are very real and very serious issues, it is informative to first see how far we have come in advancing the human condition. Despite news stories that can leave one feeling down, in many ways, life on earth is better than ever.
Figure 9.1 illustrates some of the ways in which life has improved globally in recent decades. Extreme poverty, or the percentage of the world population living on less than $1.90 per day in constant 2011 purchasing power parity (PPP) dollars, has fallen from nearly 42 percent in 1981 to less than 11 percent by 2013. As extreme poverty has fallen, improvements in infrastructure and health have improved. In 1990, 76 percent of people had access to an improved water source, but by 2015, this number had increased to nearly 91 percent. This means that many more people have safe drinking water from sources such as indoor plumbing, public taps, and protected wells. Clean water, among other improvements, has resulted in better health. This can be seen in rising life expectancy. In 1960, women lived an average of about 54 years and men lived an average of 50. By 2015, life expectancy had increased significantly, with women living to nearly 74 and men to almost 70. Additional improvements in well-being are seen in literacy rates, which rose from 76 percent in 1990 to 85 percent in 2010.
The list of improvements goes on and on. Infant and child mortality are down, maternal mortality is down, more people have access to electricity, child labor is down, school enrollment is up, and immunization rates have increased. So, while it is important to continue working toward a better future, the gains of the past cannot be ignored. These are truly impressive improvements in the human condition.
The good news is that nearly all measurements of development are moving in positive directions. But the bad news is that too many people still suffer from poverty, illness, and a general lack of opportunity. A baby is twenty-three times more likely to die in Cambodia than in Canada, and a woman giving birth is over six times more likely to die. The GDP per capita in the US is over three times that in Mexico. Even between developing countries there are great variations. A young Brazilian woman is nearly four times as likely as a young woman in the Central African Republic to be literate (figure 9.2). A person in Iraq is over ten times more likely than someone in Liberia to have electricity.
This spatial variation in level of development is intertwined with much of the material from previous chapters of this book. Development affects birth and death rates, migration flows, rates of urbanization, and economic activity in agriculture, manufacturing, and services. Understanding the spatial patterns of development and the forces that drive them can lead to further improvements in health, economics, and opportunity, improving the quality of life for people around the world.
Figure 9.1.Improving human development: Selected measures. Data source: World Bank.
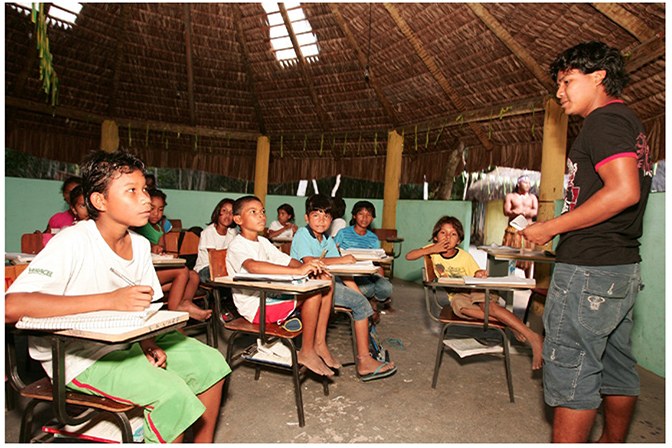
Figure 9.2.Rising levels of education. An indigenous school classroom in Jaqueira Village in the city of Porto Seguro, Brazil. Photo by Joa Souza. Stock photo ID: 552399136. Shutterstock.com.
Defining development
Geographers study these spatial patterns to understand why some places develop while others lag. Development geography and development studies are large fields, but the definition of development has no single, clear definition. The terms more developed country (MDC) and less developed country (LDC) are often used, but in which category countries fit is very subjective. Furthermore, the concept of development has changed over time, once being viewed simply as GDP per capita but at other times being seen in terms of income distribution, or the meeting of basic needs, such as food and shelter.
The United Nations focuses the definition on human development. Human development includes traditional economic development but moves far beyond it. The goal of human development is to create an environment where people and groups can develop their full potential and lead productive and creative lives based on choice. Economic opportunity is important, so places need adequate jobs and incomes that provide for a decent material quality of life. But health and education are also important. People must be physically and mentally healthy and have access to knowledge and skills to pursue opportunities. Choice is also key. If participation in society is restricted by gender, race, ethnicity, or any other characteristic, then material wealth, health, and education can be meaningless. Education does not confer choice if women or a minority ethnic group are not allowed to play a role in government or the workforce.
By studying multiple development variables, it is possible to get a good feel for the places where people have the economic opportunity, physical health, and education that allows members of society, both male and female, to pursue the life trajectory of their choice.
Spatial distribution at a global scale: Measuring and mapping development
Since 1990, the United Nations has been calculating the human development index based on a combination of data on life expectancy, income, and level of education. In a sense, these can be seen as surrogate measures of health, wealth, and opportunity.
The human development index is derived from measurements of four variables. As described in chapter 2, life expectancy at birth represents the years a newborn child is expected to live. This is strongly influenced by the infant mortality rate but can also be influenced by epidemics or conflict as well as medical care and nutrition of older age groups. Expected years of schooling is the number of years a child entering school should expect to complete given current enrollment rates. This variable gives a forward-looking indication as to how educated children are likely to be. Mean years of schooling represents the average years of education of those age 25 and older. This is more of a backward-looking indicator, showing the level of education that current adults received in the past. Gross national income (GNI) per capita is a measurement of all the income generated by a country, both domestically and from overseas, such as by companies that invest abroad, divided by the total population. In this case, GNI per capita is in PPP, which needs to be discussed in more detail before moving on.
Gross national income per capita in purchasing power parity
PPP is a concept used to compare prices across countries, essentially to account for differences in the cost of living. To do this, a sample basket of goods and services is used to determine the overall difference in prices. For instance, imagine that you buy a pound of apples, a pair of jeans, and a cell phone in the United States. You also get a haircut and pay your electrical bill. Now imagine that you buy the exact same goods and services in Mexico. Would you pay the same amount in dollars in the US as in Mexico? It is unlikely. Some goods and services will be cheaper in Mexico, while others may be higher. Overall, however, prices are likely to be lower in Mexico. It is for this reason that some Americans move to Mexico to stretch their retirement incomes. An American retiree living in the US may be middle class, but that same retiree may be upper-middle class when living in Mexico, since the cost of living is lower. Therefore, when comparing incomes across countries, it is important to adjust values based on PPP. Saying that a person in the US making $53,000 per year (roughly the US GNI per capita) has the same standard of living as a person in Mexico making $53,000 per year would be incorrect. An income of $53,000 in Mexico will buy much more than in the US (figure 9.3).
When viewing GNI per capita values in PPP, think of it this way: If you made $53,000 per year in the US, what would your standard of living be? Now look at the GNI per capita in PPP in France. It is about $38,000. If you were still in the US, what would your standard of living be with $38,000? A typical person in France has the standard of living of an American living on $38,000. In terms of income, the French are poorer than the Americans.
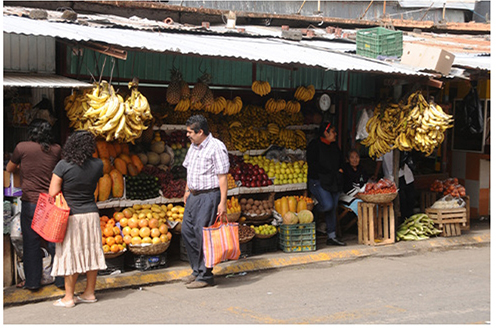
Figure 9.3.Street market in San Andres Tuxtla, Mexico. Many goods are cheaper in places such as Mexico. Consequently, income comparisons are often adjusted for purchasing power parity. Photo by Gerardo C. Lerner. Stock photo ID: 327438326. Shutterstock.com.
Figure 9.4 shows wide spatial variation in GNI per capita. In the top quintile of countries, per capita GNI is over $28,000. These countries are largely clustered in Western Europe and North America, but the Pacific nations of Japan, Australia, and New Zealand also stand out, as do several countries in the Middle East. Much of Asia and Latin America fall into midrange quintiles, while at the lowest end of the income spectrum is a clear cluster in sub-Saharan Africa.
Looking in more detail, the degree of inequality between countries becomes even more apparent. To get a better grasp of these differences, it is useful to start with a familiar place such as the United States. There, the GNI per capita is just over $53,000 per year. At the high end, Qatar has an astonishing value of nearly $130,000. And remember, these values are in PPP, so an average Qatari would live like an American with $130,000. Not bad! In Singapore, the GNI per capita is over $78,000, and in Norway it is nearly $68,000. Most Western Europeans have a somewhat lower GNI per capita than residents of the United States, however, falling largely in the $30,000 to $40,000 range.
Much of Eastern Europe, Russia, and parts of the Middle East and Latin America fall into the next-highest quintile. Mexico’s GNI per capita of just over $16,000 helps explain why many migrate north to the United States. The same is true for Eastern Europeans, many of whom migrate to higher-income Western Europe: Poland’s GNI per capita is just $24,000 compared to Germany’s at $44,000.
The relative wealth of countries such as Mexico, Chile, Argentina, and Uruguay also pulls migrants from nearby places. For a Guatemalan, where GNI per capita is only $7,000, Mexico may offer a chance to earn more money. Likewise, many Bolivians, where GNI per capita is just over $6,000, see countries to its south as places of opportunity. In Central Asia, Uzbeks, Tajiks, and others are pulled to Russia’s relative wealth.
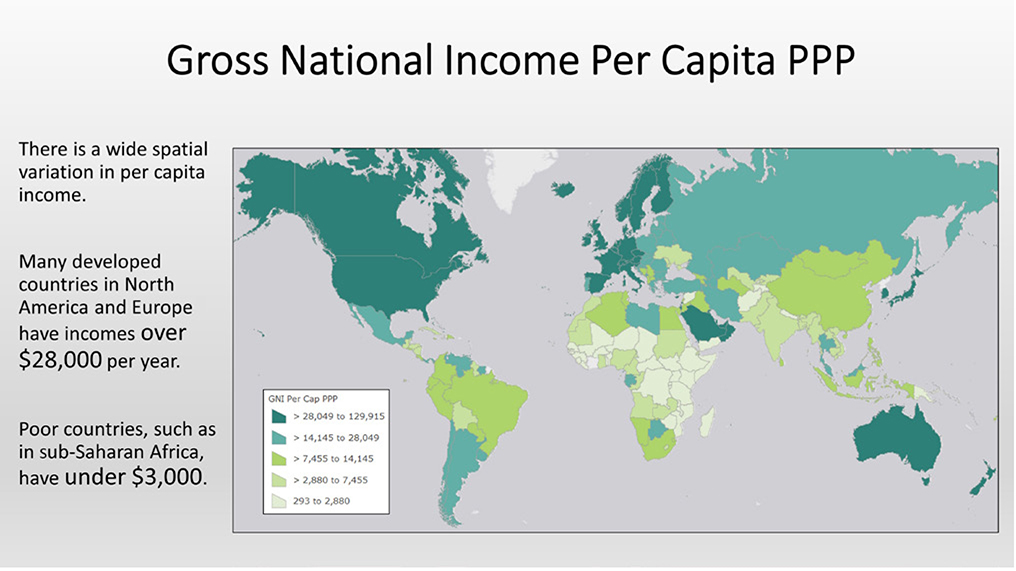
Figure 9.4.Gross national income per capita PPP. Explore this map at https://arcg.is/G8CLq. Data source: United Nations, Human Development Report 2016.
At the bottom of the scale is sub-Saharan Africa. Here is the largest concentration of low-income countries, where low-productivity agriculture, basic manufacturing, and small-scale services offer meager wages to large segments of the population. It is here that many people live in extreme poverty. Recall that the World Bank and United Nations define extreme poverty as earning less than $1.90 per day. Taken on an annual basis, that comes to $693. In countries such as Burundi, Liberia, the Democratic Republic of Congo, the Central African Republic, and Somalia, GNI per capita falls lower, meaning the average person in these countries lives in extreme poverty. To put this level of poverty in perspective, recall that these values are in PPP, so the Central African Republic’s GNI per capita of $587 per year would be like living in the United States on that amount of money. Just imagine how you would survive with only $587 to cover all your needs for an entire year.
Income distribution and the Gini coefficient
Thus, there are vast spatial differences in levels of wealth around the globe. However, GNI per capita merely shows average values. Few people actually have incomes right at the average. As a student, you probably earn less than the US GNI per capita of $53,000, while Mark Zuckerberg of Facebook earns a lot more. For this reason, an analysis of development must consider income distribution within countries. One common measure of income distribution is the Gini coefficient, which measures income distribution from a scale of zero to 100. Zero represents perfect equality, where everyone has exactly the same income, while 100 represents perfect inequality, where one person receives all income.

Figure 9.5.Gini coefficient for income, 2010–15. Explore this map at https://arcg.is/G8CLq. Data source: United Nations, Human Development Report 2016.
A cluster of countries with low Gini coefficients is found in Europe (figure 9.5). Among the most well-known egalitarian countries are those of Scandinavia—Norway, Sweden, and Denmark. These are relatively affluent places, with large middle classes and few people who are extremely rich or extremely poor. Here, residents pay among the highest effective tax rates in the world, but much of the money goes toward subsidizing public transportation, child day care, health care, education (including free university), and myriad antipoverty programs. Eastern Europe stands out as well. This region is not as affluent as Scandinavia, but extreme wealth and extreme poverty are limited enough that overall equality levels are high.
Among the affluent countries of Europe and North America, the United States ranks as more unequal. For historical and philosophical reasons, the United States has followed a more individualistic development model, whereby success can be rewarded with great wealth, but programs to help those in need are more limited than in other affluent countries.
The most unequal countries lie in Latin America and sub-Saharan Africa. In countries such as South Africa, Brazil, Colombia, and the Central African Republic, the divide between rich and poor is vast. In these places, GNI per capita values paint a misleading picture, since few people have incomes near the average. Instead, incomes tend to fall at the extremes. South Africa and Brazil have GNI per capita values of $12,000 and $14,000 respectively. These are reasonable levels of wealth, but few people earn those incomes. Rather, a small group of elites in politics and business earn incomes in the millions, leaving much of the remaining population with incomes in the low thousands. For instance, in Brazil, the rich go to work by helicopter or in luxury (and sometimes armor-plated) automobiles, while the poor have brutal commutes by bus through snarling traffic. The rich live in luxury apartments with live-in servants, while the poor live in dangerous squatter settlements, some of which even the police will not enter (figure 9.6).

Figure 9.6.Inequality in Brazil. View of a squatter settlement with luxury apartments in the background, Rio de Janeiro. Photo by Andre Luiz Moreira. Stock photo ID: 611832305. Shutterstock.com.
So, per capita measures of economic development are useful, but how wealth is shared among the population can be equally important. Economic growth is essential, but high levels of inequality can negate its development impact on the general population.
Life expectancy at birth
A country’s wealth and how it is distributed can translate into overall health of the population, reflected in life expectancy at birth. Life expectancy at birth is discussed in more detail in chapter 2, but as with per capita income, there is great spatial variation. Generally, wealthier places have higher life expectancies, while poorer places have lower ones. In most European countries, life expectancy is around 80 years or more, but in sub-Saharan Africa, it is under 60 years (figure 9.7). Latin America, falling between wealthy Europe and poor sub-Saharan Africa in terms of income, has average life expectancies of around 75 years.

Figure 9.7.Life expectancy at birth. Selected countries. Data source: United Nations, Human Development Report 2016.
Variation in life expectancy is closely tied to the health of populations. Globally, it increased by four years between 2000 and 2015, in part due to declining deaths from HIV/AIDS and other communicable diseases, malaria, improved maternal and neonatal care, and better nutrition. Most positively, gains in life expectancy were greatest in regions where people lived shorter lives. In sub-Saharan Africa, the increase was 8.8 years, while in South Asia, it was 5.5 and in Latin America, 3.8 years. These trends are obviously positive, but much work remains to pull all societies up to the levels found in the most-developed countries.
Years of schooling
In a sense, measures of education reflect opportunity. With education, people have more options in where to work and how to pursue their goals. When education is limited, so too is choice. People are forced to work in whatever low-skill opportunity that presents itself and are more likely to remain in that line of work with limited chances for advancement or professional growth.
Mean years of schooling reflects the average number of years that those over 25 years of age have completed. After age 25, most people have finished their education, so this measure illustrates how educated the adult population is and gives a good indication of a society’s level of innovation and productivity. When mean years of education are low, it is unlikely that a country will benefit from economic and technological changes in agriculture, manufacturing, and services. Rather, poorly educated workers will likely toil in low-wage and low-productivity jobs rather than in mechanized and knowledge-intensive occupations.
Again, there are vast differences in the mean years of schooling by region. In the advanced countries of Europe and North America, for instance, the adult population has over twelve years of education. This means that, on average, people have some postsecondary schooling. But moving to Latin America, it is evident that adults have only about eight years of education, just over middle-school levels. Lack of sufficient education goes far in explaining why many places in Latin America struggle with low wages and low productivity. Limited literacy and numeracy means that workers simply do not have the skills to work in higher-wage technology and information-intensive jobs. Looking at sub-Saharan Africa, years of schooling for women averages about 4.5 years, while men do only slightly better at 6.3 years. With education hovering around elementary-school levels, economic activity will inevitably be limited.
Expected years of schooling paints a better, more optimistic picture of the future (figure 9.8). This measure looks at the expected number of years of schooling that entering students are likely to receive during their lifetime. In many cases, access to education has improved substantially in recent years, meaning that children will have much greater educational opportunity than their parents had. So, while adults in sub-Saharan Africa have only four to six years of schooling on average, a child in that region today is expected to have nine to ten. In Latin America, children are expected to have about six more years of schooling than previous generations, reaching around fourteen years of education. In the most-developed countries, children are expected to see gains as well, attaining over sixteen years of education.

Figure 9.8.Expected years of schooling. Explore this map at https://arcg.is/G8CLq. Data source: United Nations, Human Development Report 2016.
Human development index
By combining measures of GNI per capita, life expectancy at birth, and levels of education, countries of the world can be classified by their level of human development. Figure 9.9 illustrates spatial patterns of development that vary substantially by region. Those that rank the highest are clustered in Europe and North America but also include parts of South America, Saudi Arabia, and the Pacific nations of Japan, Australia, and New Zealand. The least developed are clustered in sub-Saharan Africa, along with the war-torn states of Afghanistan, Syria, and Yemen.

Figure 9.9.Human development index, 2016. Explore this map at https://arcg.is/G8CLq. Data source: United Nations, Human Development Report 2016.
The gap in development between those countries at the top of the list and those at the bottom is immense. Life expectancy for the most-developed countries averages around twenty-five years more than in the least. Income per capita in PPP averages over forty times greater. Looking at the future children face in terms of education, those in the most-developed countries are expected to attain an average of twice as many years of schooling. Much work is left to be done to raise the level of development for people in countries at the bottom of the index and bring them closer to those that are most well-off.
Gender inequality
Development measures at a national scale can often mask important differences within countries. As discussed previously, income distributions can be skewed so that the rich earn much more than the poor. Also, subgroups within a population can see different levels of well-being, be it by race, ethnicity, sexual orientation, religion, gender, or any number of other categories. In the case of gender, women often have lower levels of human development, especially in terms of income and education. Women face myriad cultural, political, and economic barriers that limit access to paid work outside the home, educational opportunities, and political power.
The gender inequality index, a subsection of the human development index, attempts to measure aspects of women’s development in terms of health, empowerment, and work. Places where women have greater equality have low rates of maternal mortality (deaths related to pregnancy), low rates of adolescent births, a higher proportion of women in government positions, more women with at least some secondary education, and greater participation of women in the labor force. When childbirth is safe and done by choice, women are more likely to be able to pursue their goals. Death from childbirth is an obvious barrier to equality, but having children during adolescence also limits a woman’s ability to pursue education and career opportunities. Women’s empowerment comes from both education and political power. When women have more education, their life choices are much broader than when education levels are low. Likewise, when women have political power, there is a greater chance that gender-specific issues are addressed within a country. Finally, when women participate in the paid labor market, they have greater autonomy in their lives and are better positioned to care for themselves and their children.
Figure 9.10 shows that the greatest gender inequality runs from sub-Saharan Africa through parts of the Middle East and into South and Southeast Asia. Part of this inequality is because much of those regions are poor, and in poor countries, maternal mortality and adolescent birth rates are higher and education levels lower than in more affluent places. For instance, the maternal mortality rate in sub-Saharan Africa is a shocking thirty-nine times higher than in the most-developed countries and even three times greater than in South Asia, the region with the second-highest rate. The same holds true for adolescent births. The rate in sub-Saharan Africa is six times greater than in the most-developed countries and 1.6 times higher than in Latin America. Based on sub-Saharan Africa’s low levels of economic development and high proportions of rural residents, poor health outcomes and high teen fertility rates will tend to be more common.
But high gender inequality is also due to more limited female roles in government and in the workforce. This difference is greatest in the Arab world, where conservative cultural mores stress greater social distance between men and women. In sub-Saharan Africa, interestingly, these types of gender differences are much lower, with some indicators putting women in a better position relative to men than in even the most-developed countries.
The Arab world has the lowest proportion of women in parliaments, at just over 15 percent. This number contrasts with nearly 26 percent of parliament seats in the most-developed countries. Possibly surprisingly, women in Latin America hold over 28 percent of the seats, higher than the average for the most-developed countries, while in sub-Saharan Africa, they hold a relatively healthy 23 percent.

Figure 9.10.Gender inequality index. Explore this map at https://arcg.is/G8CLq. Data source: United Nations, Human Development Report 2016.
The Arab world also has the smallest share of women in the workforce, at 22 percent. In the most-developed countries, the share is about 53 percent, while in sub-Saharan Africa, a much larger 65 percent of women participate in the workforce. Not only do lower proportions of women work outside of the home than men in all regions, those who do so earn less. Once again, Arab women come out poorly. In their part of the world, women earn the least relative to men, at 23 percent in GNI per capita. In the most-developed countries, the female GNI per capita is about 58 percent that of men’s. However, the developing regions of both East Asia and sub-Saharan Africa have rates higher than that, where female GNI per capita is over 60 percent that of males.
The relationship between gender and education paints an interesting picture. In all regions and at all levels of development, women are less likely than men to have at least some secondary education and fewer overall years of schooling. However, the picture changes when looking at the expected years of education young children are likely to receive. For these children, girls should end up with more years of schooling than boys in all regions except those at the lowest levels of development. By region, girls in East Asia, South Asia, and Latin America will all have more education than boys. However, girls in the Arab states and sub-Saharan Africa will continue to have less schooling than their male counterparts.
Gender inequality will continue to be of concern in human development. Many countries are attempting to increase female empowerment via greater political power and education. In some places, female participation in politics is increasing through quotas, whereby some parliamentary seats are reserved for women, or where a specified proportion of candidates must be female. At the same time, as female education surpasses that of men in many parts of the world, opportunities for work may improve. However, continuing structural and cultural barriers that put more responsibility for child and home care on women will make gains in politics and the paid workforce difficult.
Sustainable development
If initial attempts to measure development focused on economic measures and later attempts focused on human measures, the idea of sustainable development adds a third dimension: the environment. In 2015, the United Nations established the Sustainable Development Goals. These goals are based on the view that development includes three essential components: economic, social, and environmental. To this end, seventeen areas were identified for measurement and improvement (table 9.1).
As with other measures of development, these goals begin with economic concerns, such as poverty, economic growth, and inequality. With over 800 million people living in extreme poverty, the majority in Southern Asia and sub-Saharan Africa, and with tens of millions of young men and women without work, economic growth is an essential first step in development. However, it must be inclusive. Between 1990 and 2010, inequality increased globally, as the wealthy benefited more from economic growth than the poor.

Table 9.1.UN Sustainable Development Goals. Data source: United Nations.
With sufficient economic growth, countries can put resources into the development of infrastructure. Over half a billion people still lack access to treated drinking water, and nearly five times that number lack toilets or latrines (figure 9.11). Without water and sanitary infrastructure, nearly 1,000 children die daily due to diarrheal diseases. A lack of access to electricity infrastructure means than many people, especially women, must spend hours daily searching for firewood, which emits lung-damaging smoke when used for cooking and heating. Road and communications infrastructures are also important. When people have access to these foundational services, they can get goods to market, find the best price for their produce, access more information and education, and generally improve their lives.
Development of economies and infrastructures feeds improvements in health and education. With one in nine people still undernourished and over 100 million children still lacking basic literacy skills, development programs must still focus on these areas. And as discussed previously, programs often need to explicitly target women, who typically lag behind men in education and opportunity.

Figure 9.11.Need for clean water and sanitation. Women draw water from a well in Nepal. Untreated water is a serious source of illness in much of the developing world. Photo by Aleksandar Todorovic. Stock photo ID: 155539829. Shutterstock.com.
What makes the sustainable development approach different from other schemes is its focus on making improvements long lasting so that generations can benefit well into the future. This means that climate change must be addressed, along with conserving resources on the land and in the sea. Rising sea levels, extreme weather, and changing weather patterns will disproportionately impact the poor, who lack resources to mitigate the impacts. Without financial resources, they will struggle to relocate, purchase irrigation systems, and build more resilient homes to withstand environmental change. Furthermore, since three billion people depend on the oceans for their primary source of protein, and since 80 percent of human diet comes from plants, development must focus on sustainable maintenance of oceans and land.
Sustainability is also tied to the political arena in terms of peace, justice, and good institutions. Over $1 trillion are lost annually to corruption, tax evasion, bribery and theft. This is a huge sum of money that could be used to reduce poverty if only countries move toward better governance. Reducing war and conflict is also a necessary condition for developing in a sustainable manner, since improvements in health, wealth, and opportunity are nearly impossible without peace. Lastly, fair and efficient judicial systems are needed if development is to be inclusive. When the law supports only those with wealth and power, those without have no recourse to fight for their rights, be it to protect their land from unlawful expropriation or to enforce protections for women, children, and other disadvantaged groups.
Go to ArcGIS Online to complete exercise 9.1: “The human development report: Patterns of human well-being.”
Spatial distribution at a national scale: Development within the United States
The United States scores well on most measures of development. It ranks in tenth place out of 188 countries in the human development index, with relatively high levels of income, life expectancy, and schooling. However, within the United States, as within all countries, there is great variation in levels of development. Zooming in to a state level of analysis, or even larger scales, differences in development become more apparent; the wealth, health, and opportunity of people are influenced by where they live.
Figure 9.12 shows median earnings per household, the proportion of people age 25 or older with at least a bachelor’s degree, and life expectancy at birth by state. The New England and Mid-Atlantic regions score well in all three areas, reflecting generally high levels of human development from Vermont down through the Washington, DC region. The Pacific Coast also does relatively well, with combined levels of education, earnings, and life expectancy that reflect decent levels of development. But looking at much of the South up through Appalachia, the picture is very different. Here, life expectancy, earnings, and education levels are substantially lower.

Figure 9.12.Development indicators in the United States. Explore this map at https://arcg.is/nDeWH. Data sources: Centers for Disease Control and Prevention, US Census Bureau.
The states that rank high all have major urban areas that drive their economies and overall well-being. Cities such as Los Angeles, New York, San Francisco, Boston, and Washington, DC, are globally connected places where major corporations and other high-paying employers concentrate. Education levels are high, and both skilled and unskilled immigrants flow in to their thriving and dynamic economies. Global and domestic investment flows to these places as well, feeding a cycle of growth.
But outside of globally connected urban areas, levels of development can be much lower. Where education levels are low, so too are earnings. Few cities in the South and Appalachia have the human capital or levels of education that attract global corporate headquarters and their corresponding high wages. The same is true for rural places and smaller urban areas even in states with high development. California’s Central Valley, just a couple of hours drive from Silicon Valley or Los Angeles, has a population of low-income agricultural workers with low levels of education.
Levels of education and earnings are closely related to health and life expectancy. In the most thriving states, life expectancy is on par with that in the affluent countries of Western Europe, such as Sweden, France, and Spain. But in the least-thriving states, it is closer to that of much less-developed places. For instance, life expectancy in Mississippi is similar to that in Iraq, Thailand, and El Salvador. Life expectancies in other pockets around the country are similarly at levels of much poorer countries. Poor health is often related to income and access to health care, but those who live in areas of the US that are underdeveloped also suffer disproportionately from risky health behaviors, such as smoking, poor diet, physical inactivity, and drinking to excess.
Theories of development: Why do spatial differences exist?
From Adam Smith in the 1700s and Karl Marx in the 1800s to more recent policy debates at the United Nations and in national capitols, there has been a wide range of views on the causes of development and underdevelopment. For some, underdevelopment is due to exploitation by those in power, where a small elite squeezes the wealth out of people and places for their own benefit. Others see underdevelopment as due to a lack of sufficient private investment and trade, so that poverty is found where people and places are not well integrated into broader national and international economic systems. Measuring and mapping levels of development is relatively easy, but explaining why it happens is much more contested.
Exploitation-based theories
In the 1950s, many development specialists viewed poverty and underdevelopment in Africa, Asia, and Latin America as being the result of exploitation stemming originally from the colonial era but continuing on well into the twentieth century. Dependency theory argued that the colonial powers of Europe, and later the United States, established trade relationships to extract the wealth from colonized territories. Colonies were used to produce raw materials and food, such as minerals and agricultural goods, which were sent to the colonial powers to feed growing urban populations and as inputs to their expanding manufacturing sectors. Thus, Great Britain imported tea, tobacco, sugar, coffee, and cotton from its colonies around the world. The wages paid to workers in colonial territories was minimal, meaning that these goods were obtained relatively cheaply and that workers would remain poor. At the same time, colonial powers used their territories to expand markets for manufactured goods. For example, cotton that was imported cheaply could be turned into manufactured clothing that was then sent back to colonial territories for sale.
In essence, cheap imported raw materials were extracted from the colonies, and then higher-value manufactured goods were sold back to them, enriching the colonial powers. Back in the colonial territories, the vast majority of the population remained poor, while a small elite that worked closely with the colonial powers became rich and perpetuated the systems of uneven spatial development.
Dependency theory was expanded and refined into the world systems theory. This theory uses the dependency framework, whereby trade relationships shape the “winners” and “losers” in global development. This framework is conceptualized as countries that fall into the core, semi-periphery, and periphery. The core countries are those with great economic, political, and military influence. They contain the most sophisticated industry, financial services, and information-intensive sectors. Core countries include the United States and most Western European countries as well as places such as Australia, Japan, and New Zealand. The periphery includes countries that largely export raw materials (figure 9.13). These tend to be the poorest countries, where wages and skill levels are low. For instance, in much of Africa, agricultural and mineral exports still dominate. Sierra Leone earns fully 61 percent of GDP from agricultural exports, especially cocoa for feeding the chocolate cravings of the developed world, while Botswana exports diamonds and Zambia exports copper. The semi-periphery falls in-between and is where lower-skill and lower-wage manufacturing takes place alongside the production of raw materials.
The concept of core and periphery is also seen at more local scales in the form of dualism, where there are two distinct levels of development within a country. In this case, dualism can reflect exploitative relationships between urban areas and rural hinterlands. Raw materials from rural farms and mines are shipped to core urban areas for manufacturing, while finished goods are then sold back to rural residents. This pattern has been seen in thousands of cities around the world, from Chicago in the United States to Santiago in Chile to Guangdong in China. In each case, wealth is extracted from the countryside (the periphery) and accumulates in the city (the core).

Figure 9.13.Commodity dependency. Explore this map at https://arcg.is/1WWfej. Data source: United Nations.
Policy responses to exploitation
With a diagnosis of exploitative trade relationships behind underdevelopment, a set of policy solutions to counter this exploitation became popular in many less-developed countries. One that was widely adapted was import substitution industrialization (ISI). As its name implies, this policy sought to substitute imports with locally made industrial goods. The logic was that it was a losing strategy to export raw materials and import higher value-added manufactured goods. Why import expensive goods when you can make them domestically yourself? India, in the 1950s, for instance, told General Motors India and Ford Motor Company India that they could no longer import car parts for mere assembly in India. If they wanted to continue operating in India, both companies would have to manufacture automobiles, not just assemble them with foreign-made parts. Both companies decided not to manufacture in India and left the country. This gave a huge boost to locally produced Indian cars, such as the Hindustan Ambassador (figure 9.14).
In addition to manufacturing licensing requirements, ISI policies used tariffs and quotas to limit foreign-produced goods. Import tariffs are essentially taxes placed on imported goods, while quotas limit the total quantity of a good that can be imported each year. Brazil, during the 1950s and 1960s, imposed an average tariff on manufactured goods of over 100 percent, so many goods that were imported were twice as expensive as they would be without a tariff. Obviously, this tariff priced imported goods beyond the reach of most Brazilians, forcing them to purchase locally manufactured goods instead.

Figure 9.14.An Indian-made Ambassador automobile. As part of India’s import substitution industrialization policies, the country made its own cars while restricting imports of foreign made cars. Photo by Anandoart. Stock photo ID: 665948647. Shutterstock.com.
Even in the mid-2010s, some countries continued using ISI-inspired protectionist trade policies. Brazil and Argentina during this time had numerous import restrictions and taxes, resulting in high prices on foreign goods. For instance, in 2014, an iPhone that cost $815 in the US sold for $1,196 in Brazil. The price of an iPhone was even higher in Argentina where its sale was banned. There, a law required that cell phones be produced locally. While some manufacturers agreed to open factories in Argentina, Apple refused, making it available only on the black market. As a result, in many cases, it was cheaper to fly from Argentina to Miami to buy an iPhone than to buy one in Argentina.
Market-based theories
Modernization theory
Others view market forces as the cause of spatially uneven development. By this line of thought, it is countries and places that promote private property ownership, entrepreneurship, trade, and technology that thrive, while those that limit them remain underdeveloped.
One of the most influential development theorists in the twentieth century was W. W. Rostow, who wrote The Stages of Economic Growth: A Non-Communist Manifesto in 1960. His work drew on the successes of the Marshall Plan in rebuilding Europe after World War II and became highly influential in President John F. Kennedy’s foreign policy and development of the Peace Corps. Rostow’s work contributed significantly to modernization theory, claiming that all countries follow a process of stages from traditional to modern.
In the Rostow model, societies can be divided into five stages of development. In the first stage, the traditional society, places are prescientific, meaning that advances in technology are haphazard and limited in their ability to substantially improve productivity. Social mobility to higher or lower status is limited, and social organization is based on family and clan. Political power is held regionally by the landowning class. Examples of traditional societies were ancient Chinese dynasties and Middle Eastern civilizations as well as medieval Europe.
The second stage is the precondition for take-off. In this stage, political change results in the formation of centralized nation states that replace landed regional power structures. Modern science evolves and is applied to new production techniques in agriculture and industry. Importantly, private entrepreneurs and the government become willing to invest profits and take risks in the pursuit of modernization, such as new transportation and communications networks. Yet progress is slow, as wide sections of the economy continue with low-productivity production and old social structures and values. Western Europe entered this stage in the late seventeenth and early eighteenth centuries, as powerful states began to expand trade and seek resources in far-flung colonies.
Third comes the take-off stage. In this stage, both technological innovation and political priorities lead to greater diffusion of economic progress throughout a country. Technology, such as railroads and other industrial machinery expand, but so too does the power of a political class that expressly promotes modernization. Investment as a proportion of income increases, fueling advances in agricultural and industrial productivity. Great Britain was the first to go through this this stage in the late 1800s, followed by other European countries and Japan through the early 1900s. By the 1950s, both China and India were in this stage of development as well.
Stage four is the drive to maturity. By this time, investment rates have increased substantially, leading to agricultural and industrial output that grows faster than population. Countries in this stage are tightly tied to the international economy, with sizable levels of imports and exports. Technological innovation becomes more complex, shifting production from coal, iron, and heavy industry to machine tools, chemicals, and electrical equipment. Typically, this stage comes sixty years or so after the beginning of the take-off stage.
Finally, the last stage is that of the age of high mass consumption. In this stage, consumer goods and services are commonplace. People have incomes that allow them to purchase many items beyond basic food, shelter, and clothing. Most people live in cities and work in offices or skilled factory jobs. Social welfare spending increases, as governments attempt to soften the impacts of poverty, malnutrition, inadequate housing, and illness. By the 1950s, the United States, Western Europe, and Japan had entered this last stage of development.
Policy response to modernization theory
In Rostow’s view, investment and technology propelled societies to modernization through the effort of both private entrepreneurs and the government. This approach was more top-down than later market-based explanations of development in that national and international organizations helped focus and promote capital investment in modernization programs.
From a policy standpoint, this meant that governments of the most-developed countries could accelerate modernization in lower-stage places through technology transfer and technical assistance. Development would result from greater diffusion of technology and know-how. Given the geopolitical situation of the 1960s, much development policy that arose from Rostow’s modernization theory was oriented toward assistance that would help contain the expansion of communism. National governments in the developed world, such as the United States and many countries of Western Europe, increased foreign aid. At the same time, global organizations such as the World Bank and International Monetary Fund, which were formed at the end of World War II to help foster global economic development, helped finance and promote projects.
Many projects in the 1960s focused on technology transfer and technical assistance in the form of large infrastructure projects such as power plants, telecommunications, and transportation (figure 9.15). For instance, the United States helped finance and build electrical distribution systems in rural Vietnam, while the World Bank financed railway construction in Tanzania. All over the developing world—from Latin America to Africa, Asia, and the Middle East—cooperation between national governments, international organizations, and private business expanded electrical systems, built highways and railroads, financed the construction of factories, expanded water and sewer systems, developed rural irrigation, and much more. Again, the idea was that by transferring technology of this sort and training local workers to manage and operate it, developing countries would more quickly move through the stages to modernization.

Figure 9.15.Guri hydroelectric power, Venezuela. The World Bank helped finance numerous power generation projects as part of a push to modernize developing countries. Photo by Paolo Costa. Stock photo ID: 297629225. Shutterstock.com.
Neoliberalism
Proponents of the neoliberal model argue that development is best achieved through market forces, with as little government intervention as possible. This philosophy grew from Adam Smith’s famous eighteenth-century idea of the “invisible hand,” whereby individuals working for their own benefit inadvertently contribute to the common good of society. Unlike modernization theory, which saw benefits in private-public cooperation, and very unlike the statist ideas of dependency and world systems theory, neoliberalism sees the greatest development in places that unleash the power of the private sector. Individual entrepreneurs contribute to societal development in a political framework whereby government’s role focuses on protecting private property rights, free markets, and free trade.
This development theory gained strength in the 1980s and was promoted strongly by Ronald Reagan in the United States and Margaret Thatcher in the United Kingdom. The World Bank and International Monetary Fund also began using this framework in promoting development around the world. By the end of the 1980s, neoliberal development theory became known as the Washington Consensus, a set of ideas agreed upon by most major multinational agencies and many national governments.
Policy response to neoliberalism
Neoliberal development theory, as implemented via the Washington Consensus, involved a range of policies meant to guide development. Countries seeking to receive development assistance, be it from national governments such as the United States or from multinational organizations such as the World Bank and International Monetary Fund, had to follow neoliberal prescriptions as a condition of aid.
Fiscal discipline was required so that government budget deficits were kept low. This could be accomplished, in part, by reorienting public expenditure away from inefficient spending, such as gasoline subsidies that go disproportionately to higher-income car owners, and toward more efficient spending in health, education, and infrastructure. Wasteful government spending and inefficient production could also be achieved through privatization, whereby government assets are sold to private investors. In many cases, telecommunications companies, water and power companies, and many other companies were owned and operated by national governments. However, these companies were often run inefficiently, with managers and workers receiving their positions because of political connections rather than merit and state subsidies covering ongoing financial losses.
Figure 9.16 shows how influential privatization became through the 1990s. Prior to 1990, no World Bank project explicitly involved privatization, but that quickly changed, with dozens being funded through the 1990s and into the early 2000s. Most of the early privatization projects took place in the former Soviet Bloc countries that were just shedding their communist systems. These projects included privatization of electrical utilities, banks, agribusinesses, and more in places such as Albania, Kazakhstan, Serbia, and Romania. Other countries throughout Africa, Asia, and Latin America received assistance as well, under the neoliberal view that private companies operate more efficiently than the state, facilitating more rapid growth and development.
Property rights were to be protected, as well, so that governments could not unjustly confiscate land, firms, or other assets held by individuals. With strong property rights, individuals can invest without fear of losing hard-earned wealth, contributing to development of the country. Furthermore, deregulation was prescribed. Government rules and regulations were to be kept to a minimum to allow greater freedom for firms to invest, build, hire and fire workers, and perform other economic functions. Many aid programs thus focused on assisting governments with legal and regulatory reforms to codify these changes.

Figure 9.16.World Bank privatization projects. Neoliberal development theory gained traction in the 1990s when the World Bank and other institutions began promoting privatization of state-owned assets and agencies. Data source: World Bank.
Trade liberalization was encouraged so that goods and services could be imported and exported freely, without heavy import tariffs, quotas, or other restrictions. Comparative advantage was encouraged so that each country could focus on what it produces most efficiently. As part of trade liberalization, foreign direct investment was promoted. This allowed multinational companies to invest around the world, seeking the best locations for production of agricultural goods, manufactured goods, and services.
As more countries adopted free trade policies by reducing tariffs, quotas, and other trade barriers, global trade increased substantially. The promotion of global trade was coordinated first by the General Agreement on Tariffs and Trade (GATT), which was founded in 1947, and then by the World Trade Organization (WTO), which replaced GATT in 1995. GATT, in 1947, consisted of just twenty-three countries, but by 2016, 164 countries were members of the WTO. As more countries joined these organizations, trade expanded (figure 9.17). Bumps and troughs along the way correspond to new countries joining the organization, as well as fluctuations in the global economy, such as the Great Recession of 2008.
In the United States, trade has been promoted in several important ways. First, it is a member of the WTO. This means that the United States, along with all the member countries, has a common set of rules for trade and dispute resolution. Members cannot put up trade barriers that disadvantage some countries, so trade flows more freely among all.
Going beyond WTO requirements, the US also has bilateral and multilateral free trade agreements. These agreements further lower trade barriers between participating countries, bringing down tariffs and other policies that limit trade. The first US free trade agreement was with Israel in 1985. It was followed by the North American Free Trade Agreement (NAFTA) in 1989, which promotes trade between Canada, the United States, and Mexico. Since then, free trade agreements have been made with a total of twenty countries (figure 9.18). Most are in Latin America, where free trade agreements run from Mexico through Central American and along the Pacific coast of South America. The remaining partners are in North Africa and the Middle East as well as the Asia-Pacific region with South Korea, Singapore, and Australia.

Figure 9.17.World Trade (percent of global GDP). Data source: World Bank.
Go to ArcGIS Online to complete exercise 9.2: “The invisible hand: How do market forces impact development?”
Density, distance, division: A geographic framework for understanding development
Most development approaches today are more aligned with market-based theories than with those that are exploitation based, although pure neoliberalism has lost some of its allure. While some politicians, economists, and development specialists see markets in a negative light and push for protectionist policies that limit imports and restrict markets, the vast majority understand that, historically, the best route to prosperity has been through open economies and trade.
The World Bank developed a framework for understanding development that is explicitly geographic, focusing on the role played by density, distance, and division. Within this framework, development can be understood at three scales of analysis. At the local scale, dense cities function as engines of development. At a country scale, the connectedness between leading urban areas and rural hinterlands drives the spatial distribution of development within countries. At an international scale, divisions, or the lack of them, in terms of trade influence the degree of development between countries.

Figure 9.18.US free trade agreements. Data source: Office of the United States Trade Representative.
Density
As has been discussed in previous chapters, urban agglomerations offer great benefits to firms and workers. Productivity increases with density, as large groups of people and companies interact in complex webs of economic activity. Knowledge and innovation are passed more readily between people. Companies have access to necessary goods and services used in production. Infrastructure costs, such as for water, electricity, and roads, are shared among a large population.
The resulting productivity gains from this interaction create much greater economic output per square mile than in less-dense areas. For this reason, urban areas are typically wealthier and more developed than lower-density places. Figure 9.19 illustrates how China’s largest prefectures, those with over thirteen million residents in 2016, had the highest disposable incomes. Places such as Shenzhen, Shanghai, and Beijing consist of massive urban areas with dense networks of people and companies, which function as leading areas in the economy. In contrast, most low-density prefectures in the interior of the country have substantially lower disposable incomes.
At the aggregate level, countries with higher levels of urbanization also have higher GDP per capita (figure 9.20). When a greater share of a country’s population lives in denser cities, more people benefit from agglomeration, working in higher-productivity industries and sharing knowledge and innovation. This is especially significant in the early stages of urbanization, with the most rapid gains in income accrued as the first 50 percent or so of the population becomes urban. This represents a period when large numbers of low-productivity agricultural workers shift to higher-productivity manufacturing and services jobs in urban areas (figure 9.21).

Figure 9.19.Density and development in China. Data sources: Esri, HERE, Garmin, NGA, USGS | Copyright: © Michael Bauer Research GmbH 2016 based on © National Bureau of Statistics of China.

Figure 9.20.GDP per capita (PPP) by percentage urban. Data source: World Bank.

Figure 9.21.Shanghai, China. Dense urban areas are more productive, innovative, and wealthy than less dense areas. Photo by DB_Crazyhorse. Stock photo ID: 555822043. Shutterstock.com.
Some development specialists once attempted to restrict urban growth by establishing policies that resisted the market forces of agglomeration. The belief was that rapid urbanization led to too many deglomeration effects, such as shortages of housing and infrastructure. But urbanization is now seen as having more benefits than costs and so should be promoted, albeit with careful planning. This means that while market forces should be the primary drivers of development, the government should play a role as well. This role includes providing law and order via strong police, court, and regulatory institutions. It also includes developing urban infrastructure, such as roads, water, and sewer systems. Housing policies to upgrade slums are implemented as well, along with flexible zoning laws that guide development without stifling it. By harnessing the forces of growth conferred by the private sector, but with guidance of the state in areas of market failure, cities can form as powerful nodes of development.
Distance
Cities function as leading areas of development. What this implies is that places farther from cities often lag in terms of income, health, education, and other indicators of development. Thus, distance is an important variable in the development of a country. Places far from leading cities cannot benefit from the sharing of knowledge and innovation. They cannot benefit from the efficiencies of large populations and interconnected firms. Furthermore, infrastructure can be limited, meaning that electricity may be spotty and roads may be of low quality and poorly maintained (figure 9.22).
Returning to figure 9.19, it is evident that the prefectures in China’s West, those which are farther from its dynamic coastal cities, lag in terms of disposable income. A similar pattern can be found in Brazil, where wealth and development are greater in the Federal District and southern cities such as Sao Paulo and Rio de Janeiro, while poverty is in the more distant northeast and Amazonia (figure 9.23). In fact, per capita disposable income is nearly 4.5 times greater in the wealthy Federal District than in Brazil’s poorest state of Maranhao.

Figure 9.22.Guilin, China. Places with lower levels of density are poorer and less developed than those with high population densities. Photo by Feiyuezhangjie. Stock photo ID: 116434333. Shutterstock.com.

Figure 9.23.Distance and development in Brazil. Data sources: Esri, HERE, Garmin, NGA, USGS | Copyright: © Michael Bauer Research GmbH 2016 based on © Instituto Brasileiro de Geografia e Estatística (IBGE).
Overcoming distance and its barrier to development requires work in several areas. First, people should be allowed, and even encouraged, to move to dynamic and growing cities. Rural-to-urban migration should not be restricted, since people become more productive and have better access to services when they live in urban areas. This also relieves pressure on labor markets in rural areas, as fewer workers remain there to compete for limited work. Second, there must be investment in infrastructure that connects places. Interstate highways, railroads, and public transportation help link places together. With high-quality transportation, the costs of moving goods and people diminish, reducing the relative distance between places. Communications infrastructure, such as cell phone connections and internet networks, are important for transmitting information. When farmers can find the best market rate for their crops rather than relying on the word of a single trader from the city, they are more likely to get a good price for their produce. Third, programs that target lagging areas can help boost education, skills, and health of workers. These programs can improve rural productivity and further integrate distant economies into the network of larger urban areas.
Division
Dense cities function as nodes of development at a local scale, while diminishing the friction of distance facilitates development at a country scale. At the international scale, divisions between countries influence levels of development. Generally, the free flow of goods and capital, people, and ideas around the world has stimulated economic growth and development. When countries are divided from each other through restrictions in these areas, they tend to lag behind others that are more integrated into the global economy.
Reducing divisions in terms of goods and capital means opening economies to free trade and investment. As discussed previously, free trade allows for countries to focus on their comparative advantage, producing goods and services in areas where they are most efficient. In turn, they import goods and services they are less efficient at making. This efficiency boosts productivity and growth, providing resources for improved education, health, and material standards of living. Countries with more open borders grow faster than those with closed ones.
The World Bank’s Doing Business project ranks countries by ease of trade, measured by the time and cost to import and export goods. Figure 9.24 shows how countries rank on this variable and illustrates that, generally, open countries are more developed and closed countries are less developed. The countries of Europe and North America are the most open to trade, while much of Africa and the Middle East as well as parts of Latin America remain more divided from the global economy. In the United States, for instance, it takes less than eight hours and under $300 to import or export a shipment of goods in New York. In contrast, importing and exporting a shipment in Lagos, Nigeria, costs over $1,000 and between 250 and 450 hours for compliance. This difference in time and cost has a dramatic impact on moving goods, increasing Nigeria’s costs for both exports sold to other countries and imports to be consumed by the Nigerian people.

Figure 9.24.Trading across borders rank. Data source: World Bank, Doing Business.
The economic case for removing the divisions between people is clear as well. As discussed in chapter 3, when there are free flows of migration, people move in pursuit of opportunity. In aggregate, this helps receiving countries by providing additional workers. Be it a Middle Eastern country that relies on foreign labor to run oil fields and construct buildings or a European country that needs young workers to offset declining birth rates, many places benefit from immigration.
Sending countries, which tend to be those that are less developed, also benefit from migration. Migrants send remittances back to family, and they acquire new skills and knowledge while living and working abroad. In many cases, these skills include habits of good governance. Given that much migration is circular rather than permanent, when workers return to their native country, their skills and habits can help transform local business and institutions. In fact, it is believed that liberalizing migration would do more to help developing countries than any other form of aid.
But while the overall economic benefits of free migration are clear, it has numerous critics. Economic benefits for receiving countries are diffuse, while costs are concentrated. Immigration may help boost the GDP for a country, but it is individual neighborhoods and workers that have to deal with an influx of newcomers that compete in specific job categories and may bring different languages and cultural habits. For this reason, immigration policy remains highly contested in countries around the world.

Figure 9.25.Press freedom: Percentage of countries by region and category. Data source: Reporters without Borders. © 2016 Reporters without Borders.
Finally, a free flow of ideas between countries is important in promoting development. When knowledge passes easily from place to place, it facilitates the development of new ideas and new technologies. A free press is one key component of the free flow of ideas. When information of all sorts, even information that is critical of those in power, can be shared, it increases public accountability, challenging corrupt political and business elites that stifle competition for their own gain.
According to Reporters without Borders, in 2017, European countries were predominately good or fairly good with press freedom (figure 9.25). However, in no other region did the majority of countries score in the top two most-free categories. In the Asia-Pacific, Middle East and North Africa, and Eastern Europe and Central Asia regions, over half of the countries ranked bad or very bad. These regions include China, where the state controls nearly all media, many Western social media platforms are banned or highly restricted, and journalists are frequently jailed. It also includes Saudi Arabia, where there is no independent media at all and social media platforms are heavily monitored for posts critical of powerful political and religious leaders. Punishment can include public flogging for writers who publish critical views. Russia also falls into this group, where independent media have been increasingly brought under control of the government and where numerous bloggers and others have been jailed and, in some cases, assassinated for their writing.
Ultimately, development is the result of economic forces guided by geography and government policy. Entrepreneurs and market forces can lead to efficient, wealth-producing organizations that finance a high quality of life, but the state needs to provide a fair and stable legal framework in which to operate. The state must also play a role in areas of market failure, ensuring that services for the common good benefit all, not just those with the immediate means to pay for them. Market forces will drive dense urban development, but adequate housing, transportation, and municipal infrastructure must keep pace. Firms in distant regions will contribute to national development, but they need good transportation and communications connections with leading urban areas. Workers and employers thrive when divisions between countries are reduced. Government restrictions on the free flow of information should be close to zero, while trade and immigration should be encouraged for their positive economic outcomes, keeping in mind those groups who may be negatively impacted.
World development has made great strides in terms of wealth, health, and opportunity, yet much more is needed. Millions have been lifted out of poverty and are living longer, healthier lives, but many millions remain poor and sick. Oppression and lack of opportunity have improved in many countries around the world, yet women and minority groups still face discrimination and limited life choices in too many places. Constant effort needs to be made to further improve the lives of an ever-greater number of people on our planet.
Go to ArcGIS Online to complete exercise 9.3: “Density: The rural-urban divide in the United States,” exercise 9.4: “Distance: How does proximity to urban areas impact development?,” and exercise 9.5: “Division: Globalization or protectionism? Trade and development.”
References
Abreu, M. de P. 2004. The Political Economy of High Protection in Brazil Before 1987. Buenos Aires: IDB-INTAL.
Aires, B. 2016. “Why Black Market iPhones Are a Hot Commodity in Argentina.” CNNMoney, September 14, 2016. http://money.cnn.com/2016/09/14/technology/argentina-iphone-black-market/index.html.
Burd-Sharps, S., and K. Lewis. 2015. Geographies of Opportunity. Measure of America. Social Science Research Council. http://www.measureofamerica.org/congressional-districts-2015.
Kathuria, S. 1987. “Commercial Vehicles Industry in India: A Case History, 1928−1987.” Economic and Political Weekly 22, no. 42/43: 1809−23. http://www.jstor.org/stable/4377638.
Peterson, A. P. 2011. “Academic Conceptions of a United States Peace Corps.” History of Education 40, no. 2: 229–40. doi: https://doi.org/10.1080/0046760X.2010.526966.
Reporters without Borders. 2016. “2016 World Press Freedom Index.” https://rsf.org/en/news/2016-world-press-freedom-index-leaders-paranoid-about-journalists.
Rostow, W. W. 1999. The Stages of Economic Growth: A Non-communist Manifesto. Cambridge, MA: Cambridge University Press.
United Nations Development Programme. 2017. “Human Development Reports.” http://hdr.undp.org/en.
United Nations. 2017. “Sustainable Development Goals.” http://www.un.org/sustainabledevelopment/sustainable-development-goals/#prettyPhoto.
Williamson, J. 2004. “The Washington Consensus as Policy Prescription.” https://piie.com/publications/papers/williamson0204.pdf.
World Bank. 2009. World Development Report 2009: Reshaping Economic Geography. Washington, DC: World Bank.
———. 2017. “Doing Business—Measuring Business Regulations.” https://www.loc.gov/item/lcwa00095490/.