CHAPTER 4
![]()
Elements of the Normal Neonatal EEG
Visual analysis of the neonatal electroencephalogram (EEG) requires the recognition of the conceptional age-dependent features characteristic of specific epochs of development. These electrographic features are presented here in four different formats: a table that lists specific elements (Table 4.1), a narrative that describes the continuum of development, and a summary by epoch of conceptional age (CA) of the expected elements. In addition, representative samples of EEG recordings in each epoch are provided.
Visual analysis and interpretation require determination of the degree of continuity of background activity (Figure 4.1), and a degree of interhemispheric synchrony of the background activity (Figure 4.2). They also require recognition of specific waveforms and patterns that occur with increasing age (Figure 4.3), the appearance of wake/sleep cycles (Dos Santos et al., 2014; Dreyfus-Brisac, 1968; Scher, 2011), and the age-dependent response of the EEG to stimulation of the infant.
CONTINUUM OF DEVELOPMENT
Continuity
When the brain’s electrical activity, as revealed by the EEG first appears, it is discontinuous, with long periods of quiescence; this pattern is referred to as tracé discontinu (Dreyfus-Brisac, 1962). As age increases, periods of inactivity shorten (Figure 4.1) (Anderson et al., 1985; Connell et al., 1978; Hahn et al., 1989; Selton et al., 2000). The longest acceptable single interburst-interval durations in relation to CA have been reported to be: 24 to 26 weeks CA, 60 seconds (Vecchierini et al., 2003); 26 weeks CA, 46 seconds; 27 weeks CA, 36 seconds; 28 weeks CA, 27 seconds (Selton et al., 2000); less than 30 weeks CA, 35 seconds; 31 to 33 weeks CA, 20 seconds; 34 to 36 weeks CA, 10 seconds; and 37 to 40 weeks CA, 6 seconds (Clancy et al., 2003; Hahn et al., 1989).
At a CA of approximately 30 weeks, continuous activity appears and is present only during rapid eye movement (REM) sleep. At about 34 weeks CA, the EEG is also continuous in the awake state. This continuous polyfrequency pattern has been traditionally referred to as activité moyenne (Lamblin et al., 1999). Continuity appears in non-REM (NREM) sleep at about 36 to 37 weeks. However, from that time until about 5 to 6 weeks post-term, the EEG during periods of NREM sleep shows occasional semiperiodic episodes of generalized voltage, attenuation (not quiescence) lasting from 3 to 15 seconds; a pattern that has been called tracé alternant (Dreyfus-Brisac and Blanc, 1956). Examples of CA-dependent discontinuity are shown in Figures 4.4 to 4.39.
Bilateral Synchrony
Before 27 to 28 weeks CA, EEG activity typically occurs in generalized bisynchronous bursts with a discontinuous background in the interburst intervals (Selton et al., 2000). However, the bursts may also appear asynchronously (Figure 4.8). After 27 to 28 weeks CA, the activity is generally asynchronous in homologous regions of the hemispheres (the greater the distance from the midline, the greater the degree of asynchrony). With increasing maturity, the degree of asynchrony diminishes. The degree of asynchrony reflects not only maturation but also the wake/sleep state. Thus, asynchrony is most prominent in NREM sleep and is least prominent in REM sleep. The only exception to these general rules is that from the time frontal sharp waves first appear, at about 35 weeks CA, they are bilaterally synchronous. Examples of EEG demonstrating increasing interhemispheric synchrony with increasing CA are shown in Figures 4.6 to 4.39.
Table 4.1 Developmental EEG Characteristics of Premature and Term Infants
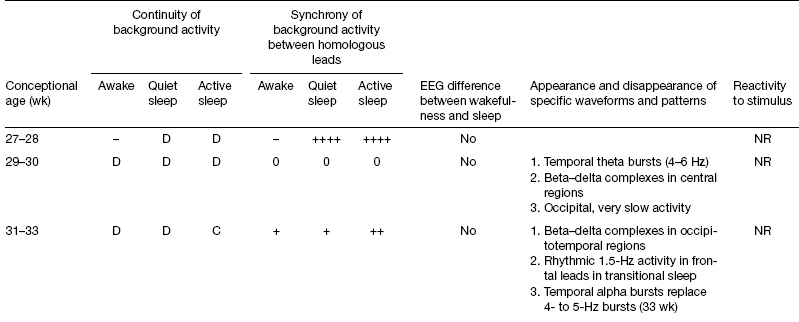
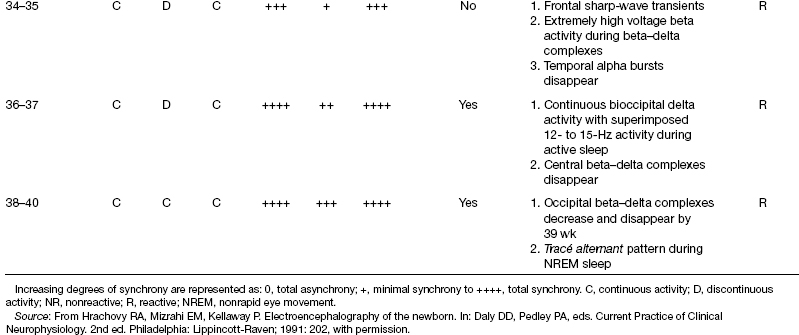
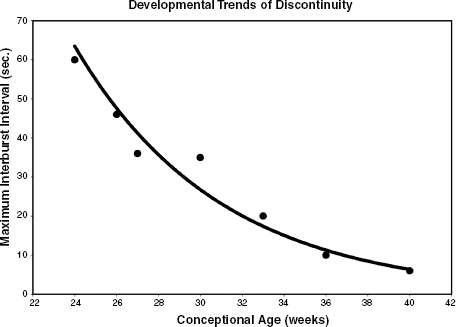
Figure 4.1 Average duration of discontinuous periods in NREM sleep in the EEG of a premature infant. Data points are taken from Verrichierni et al. (2003) (24–26 weeks CA), Selton et al. (2000) (26–28 weeks CA), and Hahn et al. (1987), Clancy et al. (2003) (30–40 weeks CA) and a curve derived from exponential regression.
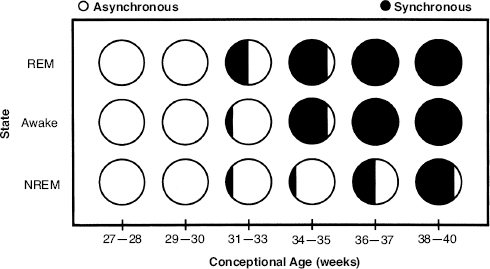
Figure 4.2 Development of interhemispheric synchrony in the EEG of the premature infant. See text for details and references. (Hrachovy, 2000, with permission.)
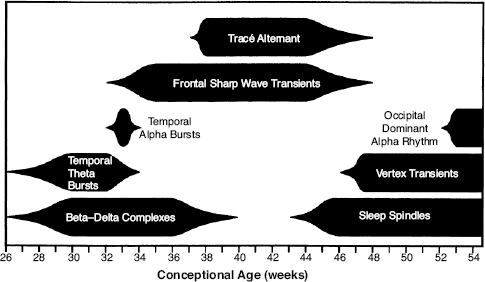
Figure 4.3 Appearance and disappearance of developmental EEG landmarks from prematurity to 3 months post-term. See text for details and references. (Hrachovy, 2000, with permission.)
EEG Developmental Landmarks
An orderly appearance and disappearance of specific waveforms and patterns occurs with increasing CA (Figure 4.3).
Beta–Delta Complexes
The presence of these complexes constitutes the prime hallmark of prematurity and is present from about 26 to 38 weeks CA. They consist of random 0.3- to 1.5-Hz waves of 50 to 250 µV, with superimposed bursts of low- to moderate-voltage fast activity. The frequency of the fast activity may vary, even in the same infant. Two frequencies predominate: 8 to 12 Hz and, more commonly, 18 to 22 Hz. The voltage of the fast activity varies throughout each burst but rarely exceeds 75 µV. Figures 4.6 to 4.22 show typical beta–delta complexes at varying CAs. Various names have been given to these complexes: “spindle-delta bursts,” “brushes,” “spindle-like fast waves,” and “ripples of prematurity.” Dreyfus-Brisac et al. (1956), who first described the complexes, referred to them as “rapid bursts,” emphasizing, as in other names, the fast component. An important feature of beta–delta complexes is that they typically occur asynchronously in derivations from homologous areas and show a variable voltage asymmetry on the two sides.
These complexes first appear as a dominant feature in the EEG at about 26 weeks CA. When first present, these occur infrequently and largely in the central regions. During the next 5 to 6 weeks, they become progressively more persistent, and the voltage of the fast component usually increases. Until 32 weeks CA, the fast component has a predominant frequency of 18 to 22 Hz; thereafter, the slower frequency (8–12 Hz) is most often present. The special distribution of the beta–delta complexes also changes with CA, becoming more prominent in the occipital and temporal regions with increasing age.
From the time beta–delta complexes first appear and changes in the wake/sleep cycle can be appreciated, the presence of beta–delta complexes is a prominent feature during REM sleep—a state characterized by virtually continuous EEG activity after 30 weeks CA. At 33 weeks CA, beta–delta complexes are maximally expressed in NREM sleep, rather than REM sleep, and appear more prominently in the temporal-occipital areas. From 33 to 37 weeks CA, beta–delta complexes continue to occur primarily in NREM sleep.
Temporal Theta and Alpha Bursts
A useful developmental EEG marker is the appearance of rhythmic 4 to 6 Hz waves occurring independently in short bursts of rarely more than 2 seconds arising independently in the left and right midtemporal areas. Voltage varies from roughly 20 to 200 µV. Individual waves often have a sharp configuration (Hughes et al., 1987; Werner et al., 1977) (Figures 4.10, 4.11, 4.13–4.15). This activity appears at about 26 weeks CA, is expressed maximally between 30 and 32 weeks, and then rapidly disappears. It is replaced by temporal alpha bursts that otherwise have characteristics of amplitude, burst duration, and spatial distribution similar to temporal theta bursts (Figures 4.16–4.18). The presence of temporal alpha bursts can be considered a very specific marker for 33 weeks; they appear at that CA and are no longer present at 34 weeks CA.
Frontal Sharp Waves
Isolated sharp waves of blunt configuration, usually with an initial surface-negative phase followed by a surface-positive phase, have been referred to as encouche frontales (Dreyfus-Brisac, 1962; Kellaway and Crawley, 1964). They may be present at 34 weeks CA but attain maximum expression at about 35 weeks CA. They diminish in number and voltage after 44 weeks CA and are only rarely seen in infants older than 6 weeks post-term.
These frontal sharp transients are bilaterally synchronous and symmetrical from the time of their first appearance, although there may be some variable lateralization (Figures 4.19 and 4.27) (Crippa et al., 2007). The initial surface-negative component lasts about 200 msec. The succeeding surface-positive component lasts somewhat longer, but this is quite variable and is often difficult to measure because intervening background activity obscures the termination of the waveform (Figures 4.20 and 4.24–4.28). They typically occur randomly as single events, predominantly in transitional rather than in REM or NREM sleep. However, they may also recur in brief runs and may also be mixed with other normal features of near-term infants such as bifrontal delta activity (Figures 4.26 and 4.28–4.29).
Distinguishing Between the Waking and Sleep EEG
Until 36 to 37 weeks CA, distinguishing the various states of the wake/sleep cycle is based upon empirical factors such as behavior and polygraphic parameters. Eye opening is associated with the awake state, and eye closure is associated with sleep. Regular respiration, random eye movements, and variable muscle tone are associated with NREM sleep while irregular respiration, REMs and decreased muscle tone are associated with REM sleep.
Electrographically at about 30 weeks CA, the background activity is continuous in REM sleep and discontinuous during wakefulness and NREM sleep. However, the EEG activity in all states is characterized by the presence of beta–delta complexes with their CA-dependent abundance, spatial distribution, and degree of synchrony (Figures 4.21–4.23).
By 36 to 37 weeks CA, a clear distinction can be made between the waking EEG and the sleep EEG based upon their inherent features, without reliance on clinical or polygraphic data (Figures 4.31–4.37). In the awake EEG, beta–delta complexes are rarely present and the awake background activity consists chiefly of continuous polyfrequency activity, traditionally referred to as activité moyenne. This polyfrequency activity is characterized by random, very slow, low-voltage activity best described as baseline shifting, with superimposed semirhythmic 4 to 8 Hz activity in all regions. In addition generalized, very low voltage 18 to 22 Hz activity and anteriorly distributed, very low voltage 2 to 3 Hz activity may be present. From the standpoint of determining CA, disappearance of the beta–delta complexes when the infant appears behaviorally awake constitutes an important marker of 36 to 37 weeks CA.
Before about 36 weeks CA, the background activity in NREM sleep is discontinuous (Figure 4.22). Between 36 and 38 weeks CA, two NREM EEG patterns emerge. The first is continuous high-voltage slow-wave activity in all regions. The second pattern is known as tracé alternant and is characterized by a modulation of generalized activity with alternating periods of high and low voltage activity (Figures 4.33–4.35). This pattern may occur in infants through 44 weeks CA. After that period, NREM sleep is characterized by continuous slow-wave activity with the eventual emergence of sleep spindles after about 46 weeks CA—although rudimentary spindles may occur earlier (Figures 4.38 and 4.39).
The EEG character of REM sleep is similar to that of the awake recording from about 30 weeks CA. Infant behaviors and polygraphic recordings of respiration, eye movements, and submental EMG distinguish awake from REM sleep.
The terms transitional sleep or indeterminant sleep are used to characterize the state of the infant when it cannot be precisely determined by specific EEG criteria.
Reactivity to Stimulation
Changes in EEG activity in response to stimuli do not clearly emerge until about 33 to 34 weeks CA (Figure 4.23), and by 37 weeks CA, these responses can be easily elicited. The response to a stimulus is related to the character of the ongoing activity at the time of the stimulus. If high voltage, very slow activity is present, an effective stimulus may produce abrupt and pronounced generalized attenuation of voltage lasting as long as 5 to 10 seconds (Ellingson, 1958; Kellaway and Crawley, 1964).
Spontaneous episodes of attenuation may be associated with self-arousal (Figures 4.23 and 4.37). They occur in infants until about 2 months post-term, possibly in response to interoceptive stimuli. Such episodes should not be interpreted as evidence of immaturity or be confused with the repetitive episodes of generalized or regional attenuation that occur in abnormal conditions of diffuse cerebral dysfunction, such as neonatal encephalopathy.
Additional Special Waveforms and Patterns
Some special waveforms and patterns, particularly in the near-term and term infant, are considered to be within the range of normal variation although they are not developmental milestones, per se. They are bifrontal delta activity and some forms of temporal sharp waves.
Bifrontal Delta Activity
Bifrontal delta activity appears in the near-term or term infant as intermittent semirhythmic 1.5 to 2 Hz high-voltage activity in the frontal regions bilaterally (Figures 4.28 and 4.29). This activity may occur in close association with frontal sharp transients, most prominently during transitional sleep. This pattern has been referred to as “anterior dysrhythmia.” However, this is a misnomer, because its presence does not suggest abnormality and it is considered within the range of normal variation (Clancy et al., 2003).
Temporal Sharp Waves
Temporal sharp waves are discussed in detail in the following chapter that concerns findings of uncertain diagnostic significance. That discussion describes criteria used to differentiate normal temporal sharp waves from those that are clearly abnormal. Temporal sharp waves that can be considered to be normal have a simple diphasic morphology, with the initial component appearing as surface-negative polarity, and occur randomly, usually asynchronously on the two sides and during sleep (Figure 4.30). Complex morphology, positive polarity, persistent localization and occurrence during wakefulness, are criteria for abnormality (see Chapter 5).
SUMMARY OF CONCEPTIONAL AGE-DEPENDENT FINDINGS
24 to 26 Weeks Conceptional Age (Figures 4.4 and 4.5)
• Continuity. There are brief bursts of activity between periods of electrical quiescence. The interburst interval is CA dependent and is at its longest at this age.
• Synchrony. Bursts of activity during this epoch are typically synchronous, but may also appear asynchronously on the two sides.
• Landmarks. Beta–delta complexes may be present during this epoch.
• Wake/sleep cycles. Cycles are not well defined by behavior or polygraphic changes. No evidence is seen on EEG of wake/sleep cycling.
• Reactivity. No reactivity to stimulation occurs.
27 to 28 Weeks Conceptional Age (Figures 4.6–4.8)
• Continuity. Electrical activity is episodic. Brief periods of generalized moderate-voltage activity may appear between periods of generalized electrical quiescence. The interburst intervals are relatively long compared to those present at later ages.
• Synchrony. The bursts of electrical activity are asynchronous on the two sides.
• Landmarks. Beta–delta complexes are present in the central region and rudimentary temporal theta bursts are present.
• Wake/sleep cycles. Cycles are not well defined by behavior or polygraphic changes. No evidence of wake/sleep cycles is found on EEG.
• Reactivity. No reaction to stimulation occurs.
29 to 30 Weeks Conceptional Age (Figures 4.9–4.12)
• Continuity. The EEG remains discontinuous, although brief periods occur in which behavioral and physiologic parameters suggest REM sleep when the EEG activity is relatively continuous. When the EEG is discontinuous, the duration of the interburst intervals is CA dependent and is less than in preceding epochs.
• Synchrony. Asynchrony between the two hemispheres is a predominant feature.
• Landmarks. Beta–delta complexes are present in the central regions. Temporal theta bursts are a consistent feature during this epoch. Occipital slow (delta) activity emerges during this epoch.
• Wake/sleep cycles. The EEG is continuous during periods when behavioral and physiologic parameters indicate REM sleep. There is no clear-cut relation between the stages of wakefulness and sleep on EEG except for a tendency for greater continuity of the background activity during REM sleep.
• Reactivity. No reaction to stimulation occurs.
31 to 33 Weeks Conceptional Age (Figures 4.13–4.18)
• Continuity. Continuous activity remains an aspect of REM sleep, but the EEG is discontinuous at other times.
• Synchrony. The degree of synchrony between hemispheres increases; however, this epoch is still marked by asynchrony when compared to epochs of infants at older ages.
• Landmarks. Beta–delta complexes are present and are more prominent in the occipital and temporal regions than in the central regions. Temporal theta bursts persist until 32 weeks CA and are largely replaced by temporal alpha bursts at 33 weeks CA.
• Wake/sleep cycles. The EEG is continuous during REM sleep and discontinuous during wakefulness and NREM sleep.
• Reactivity. No reaction to stimulation occurs.
34 to 35 Weeks Conceptional Age (Figures 4.19–4.22)
• Continuity. During wakefulness and REM sleep the EEG is continuous, but is still discontinuous during NREM sleep, although the degree of discontinuity is less than during the previous epoch.
• Synchrony. Synchrony continues to be greater during this epoch than in early epochs, but asynchrony persists, chiefly in NREM sleep.
• Landmarks. Frontal sharp transients (enchoches frontales) become well-defined by week 35 CA, although they may appear in rudimentary form during week 34 CA. During this epoch, beta–delta complexes persist. Temporal alpha bursts disappear by 34 weeks CA.
• Wake/sleep cycles. The EEG is continuous during wakefulness and REM sleep, but discontinuous during NREM sleep.
• Reactivity. The background activity is reactive to stimulation of the infant. The response and its character are dependent upon the state of the infant at the time of stimulation (Figures 4.23 and 4.37).
36 to 37 Weeks Conceptional Age (Figures 4.23 and 4.24)
• Continuity. During wakefulness and REM sleep, the EEG is continuous, but episodes of discontinuity may occur in NREM sleep.
• Synchrony. Synchrony continues to be greater during this epoch than in earlier epochs, now with most of the activity synchronous on the two sides.
• Landmarks. Frontal sharp transients persist. During this epoch, beta–delta complexes become less frequent. No new characteristic waveforms emerge, although bifrontal delta activity (a normal phenomenon) may be present during this epoch.
• Wake/sleep cycles. EEG and physiologic features of wakefulness, REM sleep and NREM sleep are present. At 36 weeks CA, a clear distinction can be made, based upon EEG criteria, between the awake and NREM sleep.
• Reactivity. The background is reactive to stimulation.
38 to 40 Weeks Conceptional Age (Figures 4.25–4.37)
• Continuity. The EEG is continuous in all states of sleep and in wakefulness.
• Synchrony. All activity becomes synchronous on the two sides by 40 weeks CA.
• Landmarks. Frontal sharp transients persist. During this epoch beta–delta complexes disappear from NREM sleep and are not present after 40 weeks CA.
• Wake/sleep cycles. EEG and physiologic features of wakefulness, REM sleep and NREM sleep persist. During this epoch, during NREM sleep, a modulation of the amplitude of the slow activity occurs with alternating periods of high amplitude and low voltage (tracé alternant).
• Reactivity. The background is reactive to stimulation.
41 to 44 Weeks Conceptional Age (Figure 4.38)
• Continuity. The EEG is continuous in wakefulness and all stages of sleep.
• Synchrony. Synchrony is virtually complete as in the previous epoch.
• Landmarks. Frontal sharp transients persist. No other immature waveforms are present.
• Wake/sleep cycles. Wakefulness and all stages of sleep are present. Tracé alternant begins to resolve by 44 weeks CA. NREM sleep is characterized by continuous slow-wave activity. Toward the end of this epoch rudimentary sleep spindles may appear. By 46 to 48 weeks CA, they are seen in all infants (Figure 4.39).
• Reactivity. The background is reactive to stimulation.
LIST OF FIGURES
Age-Dependent Evolution
Figure 4.1 Average duration of discontinuous periods in NREM sleep in the EEG of a premature infant.
Figure 4.2 Development of interhemispheric synchrony in the EEG of the premature infant.
24 to 26 Weeks Conceptional Age
27 to 28 Weeks Conceptional Age
Figure 4.6 Tracé discontinu and a burst of bilateral, polyfrequency activity.
Figure 4.7 Central beta–delta complexes and temporal theta burst.
Figure 4.8 Tracé discontinu and with asynchronous bursts of beta–delta complexes.
29 to 30 Weeks Conceptional Age
Figure 4.9 Central beta–delta complexes and discontinuity of the background.
Figure 4.10 Central beta–delta complexes and temporal theta bursts.
Figure 4.11 Bilateral, independent temporal theta bursts.
Figure 4.12 Occipital slow activity and central beta–delta complexes.
30 to 32 Weeks Conceptional Age
Figure 4.13 Beta–delta complexes in temporal regions and temporal theta bursts.
Figure 4.15 Extrauterine development of graphoelements.
33 Weeks Conceptional Age
Figure 4.16 Bilateral, asynchronous, temporal alpha bursts.
Figure 4.17 Temporal alpha burst, occipital beta–delta complexes, and tracé discontinu.
Figure 4.18 Beta–delta complexes in the temporal regions.
34 to 35 Weeks Conceptional Age
Figure 4.19 Beta–delta complexes in the central and temporal regions and frontal sharp transients.
Figure 4.20 Frontal sharp transients.
Figure 4.21 Awake: relative continuous background activity with some interhemispheric asynchrony.
Figure 4.22 NREM (quiet) sleep: discontinuous background activity.
36 to 37 Weeks Conceptional Age
38 to 40 Weeks Conceptional Age
Figure 4.25 Frontal sharp transients with continuous background activity.
Figure 4.26 Repetitive frontal sharp transients.
Figure 4.27 Symmetrical and asymmetrical frontal sharp transients.
Figure 4.28 Rhythmic bifrontal delta activity in transitional sleep.
Figure 4.29 Intermittent bifrontal delta activity.
Figure 4.30 Temporal sharp waves.
Figure 4.31 Awake: continuous, synchronous polyfrequency activity.
Figure 4.32 NREM (quiet) sleep: continuous slow activity.
Figure 4.33 Tracé alternant in deep NREM (quiet) sleep.
Figure 4.34 Tracé alternant with repetitive periods of attenuation.
Figure 4.35 Tracé alternant with a brief period of attenuation.
Figure 4.36 REM (active) sleep.
Figure 4.37 Transient arousal: generalized voltage attenuation.
41 to 44 Weeks Conceptional Age
Figure 4.38 Rudimentary sleep spindles.
45 to 48 Weeks Conceptional Age
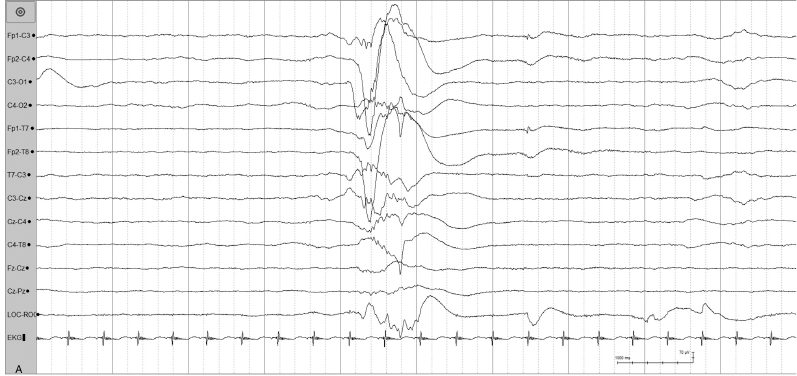
Figure 4.4 (A) and (B) 24 to 26 weeks CA. Tracé discontinu and bursts of bilaterally synchronous slow waves with superimposed fast activity. (A) This pattern is present in this 26-week CA infant.
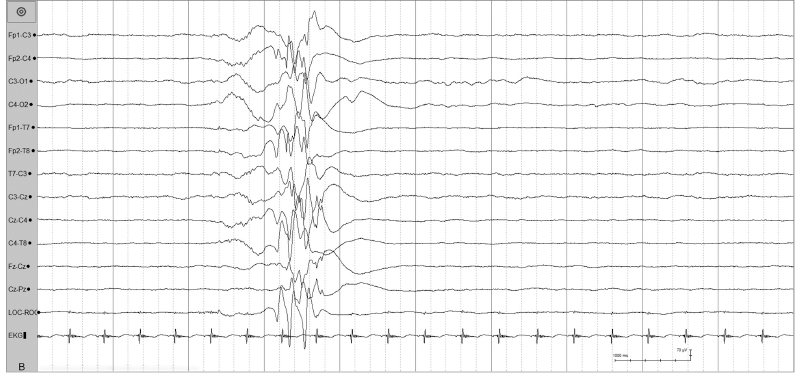
Figure 4.4 (B) Bilaterally synchronous burst with polyfrequency activity in the same infant.
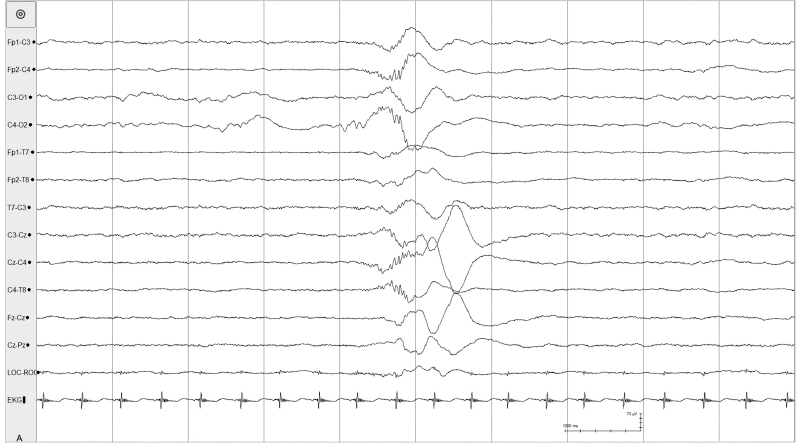
Figure 4.5 (A) and (B) 24 to 26 weeks CA. Tracé discontinu and bursts of bilaterally synchronous and asynchronous slow waves with superimposed fast activity. A burst of bilaterally synchronous beta–delta complexes in this 26-week CA infant.
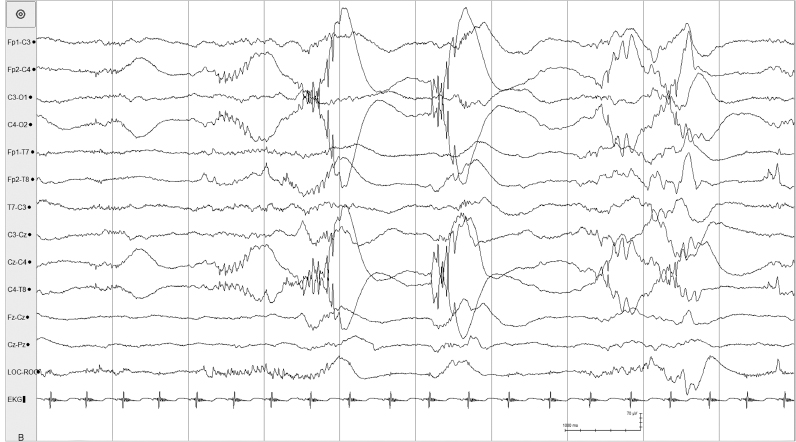
Figure 4.5 There are interburst intervals of varying durations in the same infant.
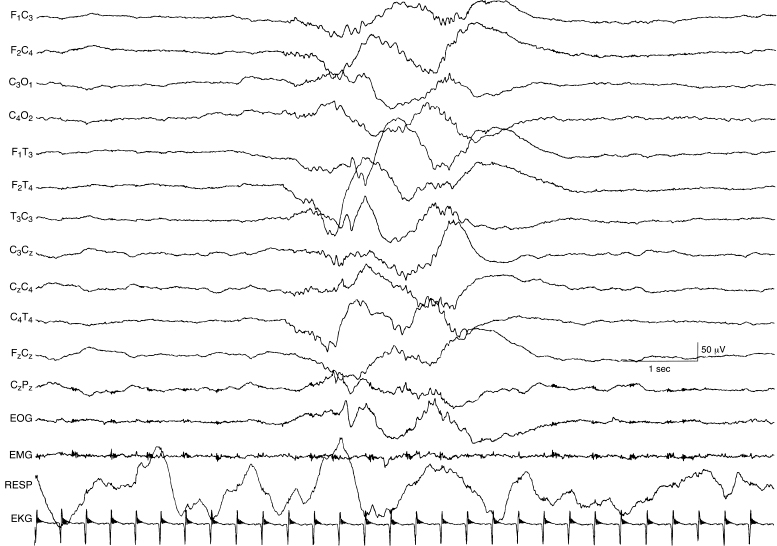
Figure 4.6 27 to 28 weeks CA. Tracé discontinu and a burst of bilateral, polyfrequency activity. The EEG demonstrates a tracé discontinu pattern. A burst of bilaterally symmetrical, somewhat asynchronous activity is present. This activity is slow with superimposed waves of faster frequency that resemble beta–delta complexes.
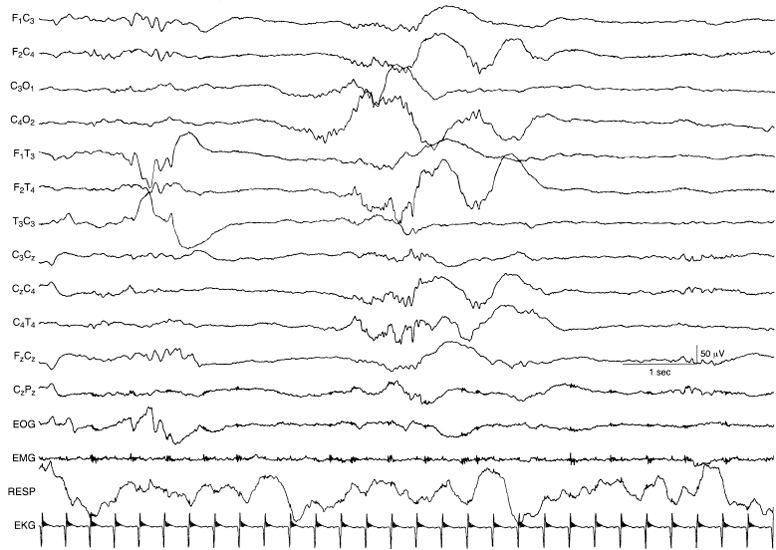
Figure 4.7 27 to 28 weeks CA. Central beta–delta complexes and temporal theta burst. The background is characterized by tracé discontinu. Beta–delta complexes are present, predominately in the right central region. A rudimentary theta burst is present in the left temporal region.
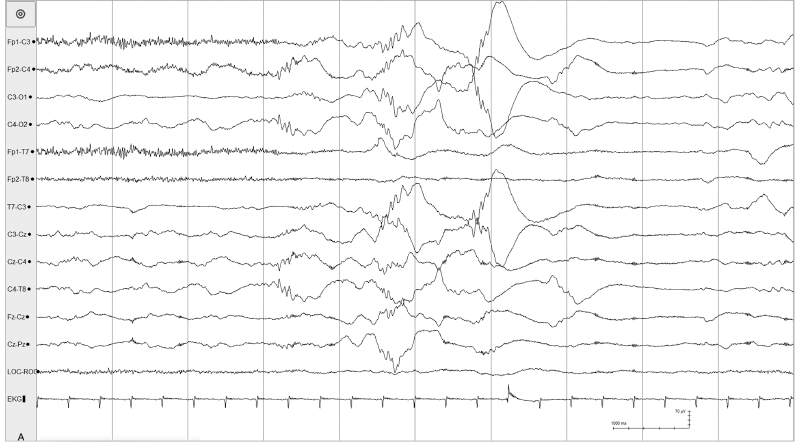
Figure 4.8 27 to 28 weeks CA. (A)–(C) Tracé discontinu and with asynchronous bursts of beta–delta complexes. (A) Bursts appear predominantly in the left and right central regions.
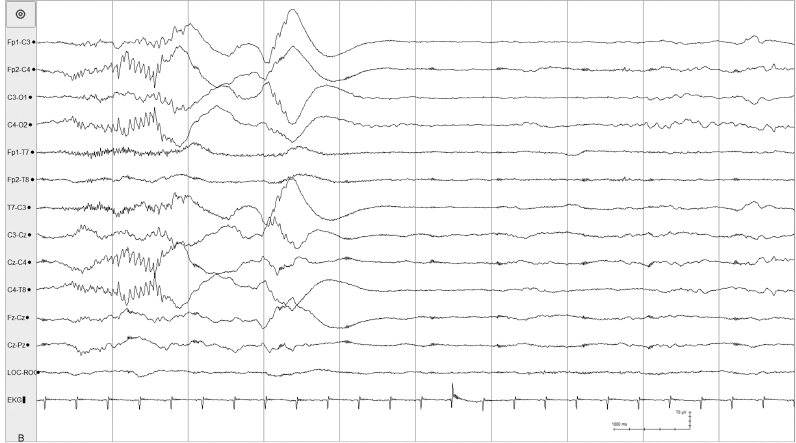
Figure 4.8 (B) Bursts appear predominantly in the right central region and also present in the left central region.
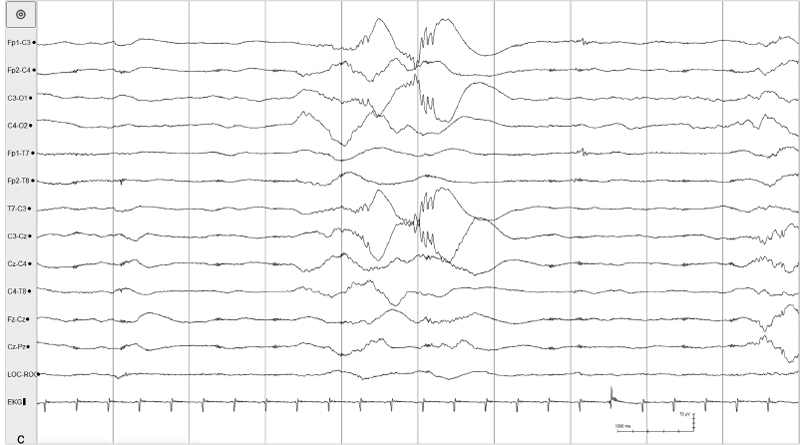
Figure 4.8 (C) Bursts appear in the left central region. All samples from the same recording of a 26- to 28-week CA infant.
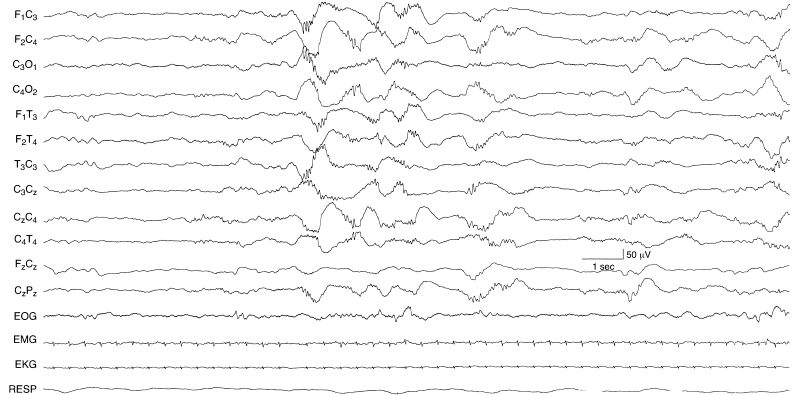
Figure 4.9 29 to 30 weeks CA. Central beta–delta complexes and discontinuity of the background. Beta–delta complexes are present in the central regions bilaterally, but occur asynchronously on the two sides. The background activity is discontinuous with some low-voltage activity superimposed.
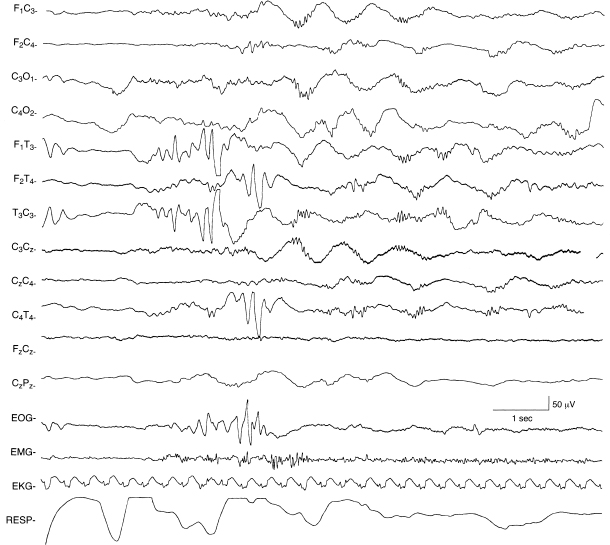
Figure 4.10 29 to 30 weeks CA. Central beta–delta complexes and temporal theta bursts. Theta bursts are present independently on the right and left temporal regions. Beta–delta complexes are present bilaterally, although asynchronous and more prominent on the left.
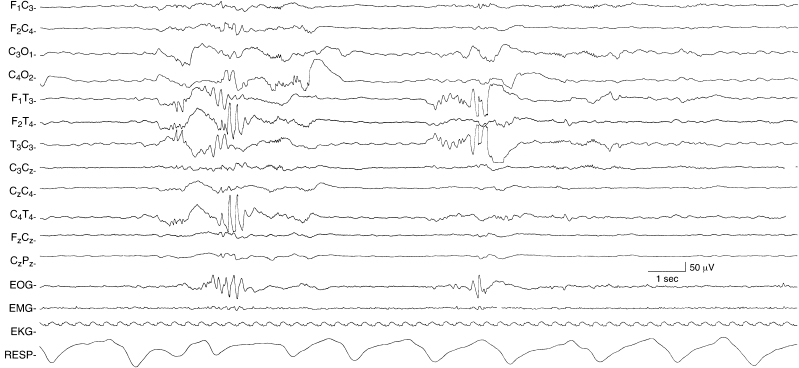
Figure 4.11 29 to 30 weeks CA. Bilateral, independent temporal theta bursts. Temporal theta bursts are present bilaterally, but independently. The background activity is discontinuous. The low-voltage rhythmic slow activity present during periods of quiescence is EKG artifact. This sample is from the same recording in Figure 4.12.
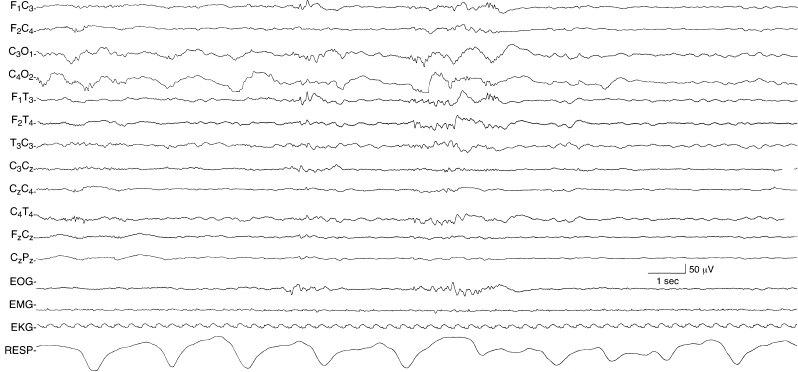
Figure 4.12 29 to 30 weeks CA. Occipital slow activity and central beta–delta complexes. There is moderate voltage, very slow activity in the occipital regions bilaterally in the early portion of the sample. Beta–delta complexes that are more central in location are present later. The recording then becomes discontinuous with EKG artifact superimposed. This sample is from the same recording in Figure 4.11.
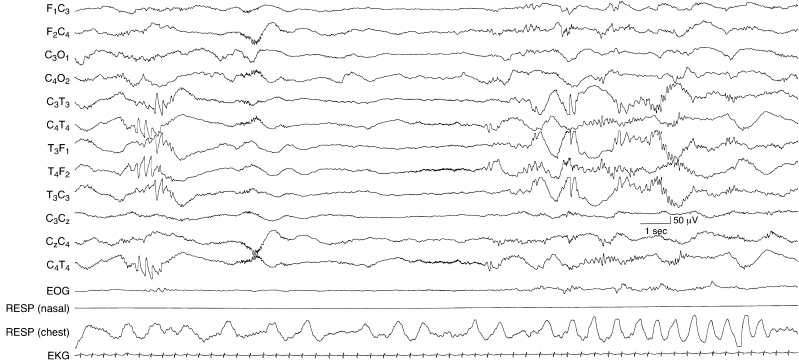
Figure 4.13 30 to 32 weeks CA. Beta–delta complexes in temporal regions and temporal theta bursts. Beta complexes are present in the temporal regions in the latter half of the sample. Earlier there is a beta–delta complex in the right central region. In the initial portion of the sample there are also theta bursts in the temporal regions bilaterally, but asynchronously. The background activity is discontinuous.

Figure 4.14 30 to 32 weeks CA. Beta–delta complexes in the occipital, temporal, and central regions, and temporal theta bursts. In the early portion of the sample, a beta–delta complex is present in the right occipital region. Then there are bilateral, independent temporal theta bursts. Later, beta–delta complexes are present in the central regions bilaterally. The background activity is discontinuous.
Figure 4.15 (A) and (B) 30 to 32 weeks CA. Extrauterine development of graphoelements. Beta–delta complexes, independent bitemporal bursts, decreased discontinuity, and increased synchrony are present in this 31-week CA infant born at 24 weeks CA and recorded at 7 weeks of life. (A) Beta–delta complexes in posterior regions and temporal theta burst on the right.

Figure 4.15 (B) Temporal theta burst on the left with variable synchrony and continuity.
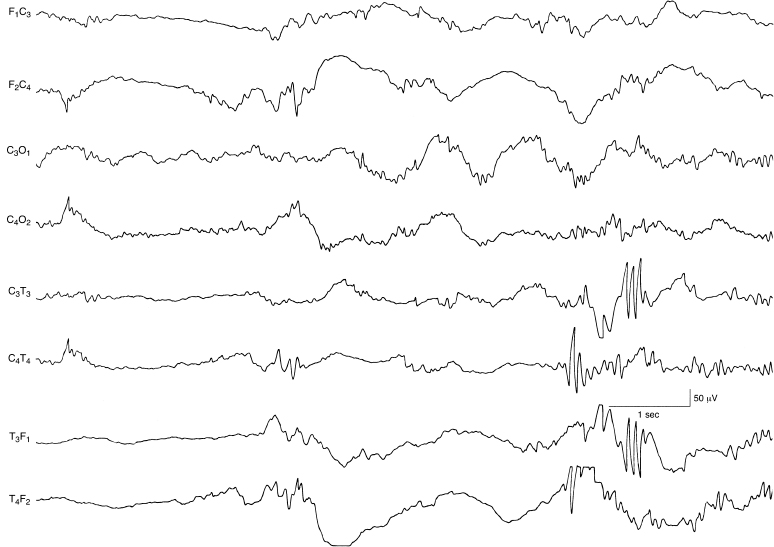
Figure 4.16 33 weeks CA. Bilateral, asynchronous, temporal alpha bursts. Alpha bursts are present in the temporal regions, appearing independently and asynchronously on the two sides.
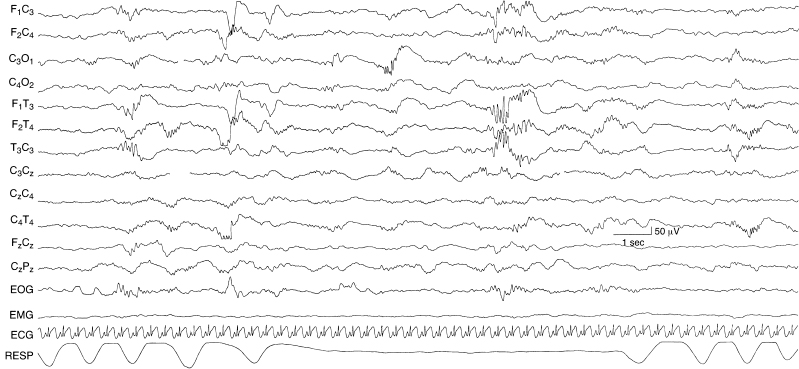
Figure 4.17 33 weeks CA. Temporal alpha burst, occipital beta–delta complexes, and tracé discontinu. Temporal bursts with a frequency in the alpha range are present on the left. Beta–delta complexes are most prominent in the occipital region on the right. The background activity is discontinuous, although less so than recordings of infants of a younger conceptional age.

Figure 4.18 33 weeks CA. Beta–delta complexes in the temporal regions. Beta–delta complexes are present in the temporal regions, greater on the left. There is a brief run of alpha frequency activity in the left temporal region early in the sample. The background activity is discontinuous. Periods of discontinuity are shorter and the periods of bursting activity are longer than in infants with a younger conceptional age.
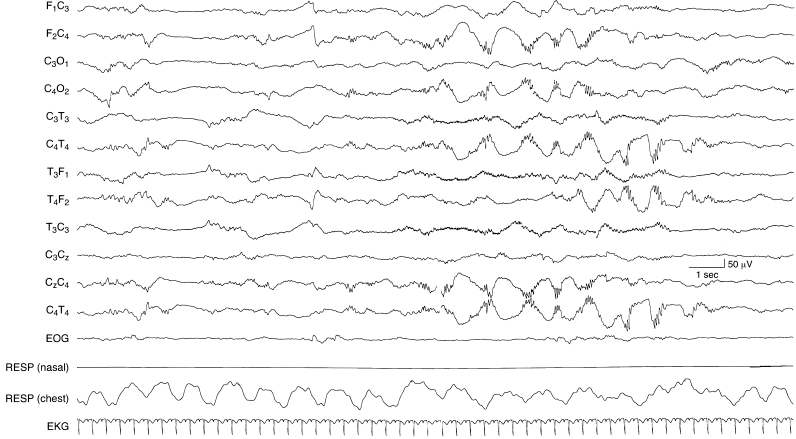
Figure 4.19 34 to 35 weeks CA. Beta–delta complexes in the central and temporal regions and frontal sharp transients. Beta–delta complexes are present in the right central region followed by beta–delta complexes in the right temporal region. There are rudimentary frontal sharp transients, higher in amplitude and more well formed on the right side in the early portion of the sample that suggests that the CA of this infant is early in the 34- to 35-week epoch.
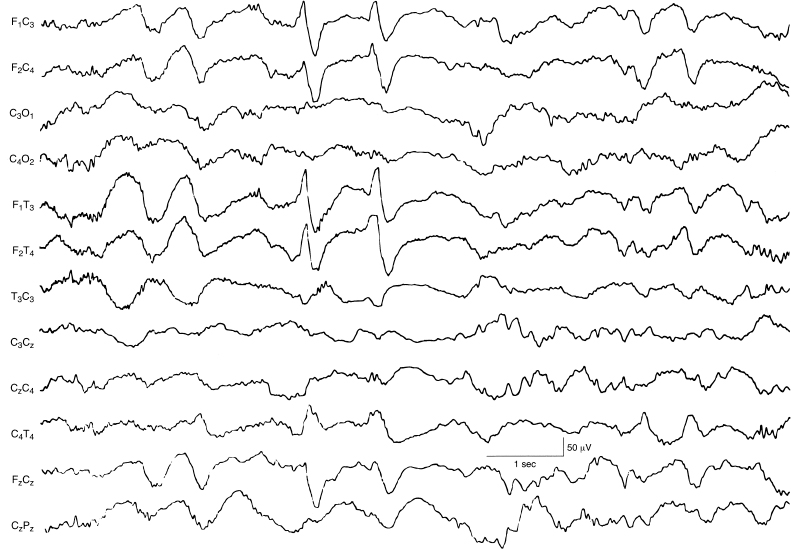
Figure 4.20 34 to 35 weeks CA. Frontal sharp transients. Bilateral, synchronous frontal sharp transients are present in the frontal leads bilaterally.

Figure 4.21 34 to 35 weeks CA. Awake: relative continuous background activity with some interhemispheric asynchrony. The background activity is continuous with intermittent beta–delta complexes in the occipital regions. This sample is from the same recording of the infant in Figure 4.22.
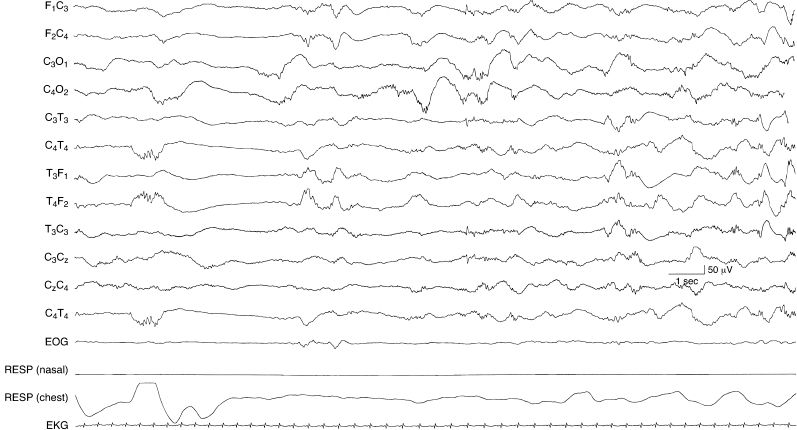
Figure 4.22 34 to 35 weeks CA. NREM (quiet) sleep: discontinuous background activity. There is a period of discontinuity similar to other periods of discontinuity in the same recording during this stage of sleep. This sample is from the same recording of the infant in Figure 4.21.
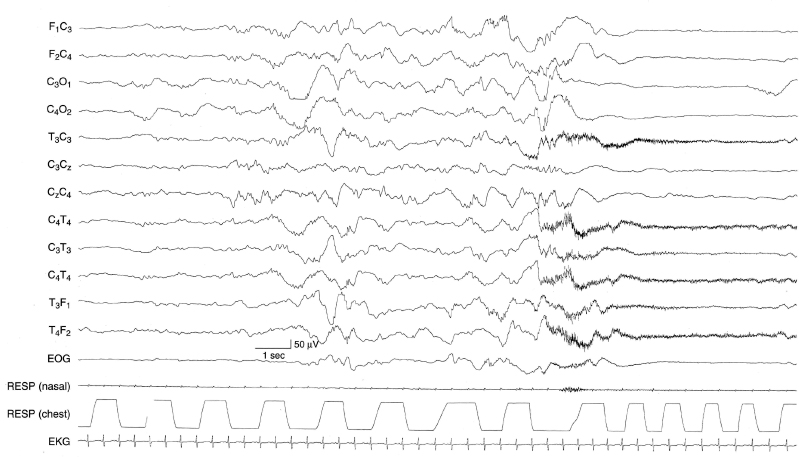
Figure 4.23 36 to 37 weeks CA. Arousal from NREM (quiet) sleep: generalized voltage attenuation associated with clinical arousal. The early portion of the sample demonstrates the discontinuity of NREM (quiet) sleep. The infant then self-arouses. This is associated with generalized voltage attenuation (and EMG artifact from the temporal muscles).
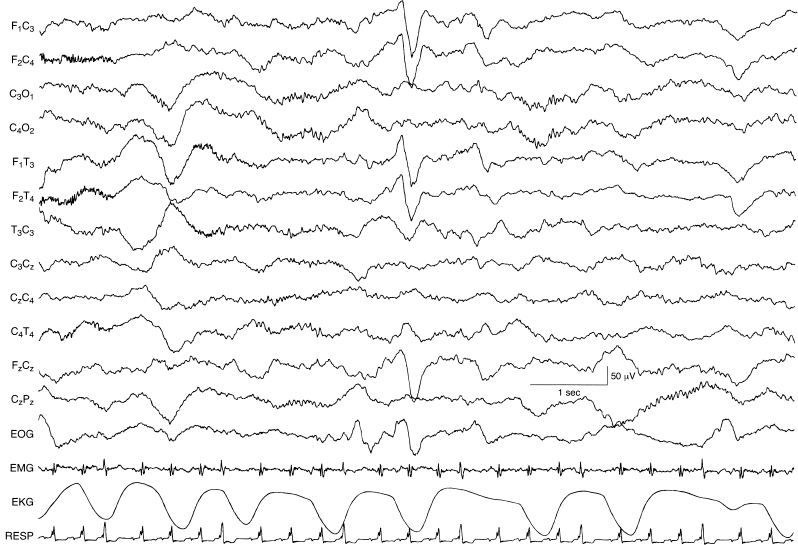
Figure 4.24 36 to 37 weeks CA. Frontal sharp transients, continuous polyfrequency activity, and a paucity of beta–delta complexes. Frontal sharp transients occur synchronously and symmetrically on the two sides. The background activity is relatively continuous with polyfrequency activity throughout.
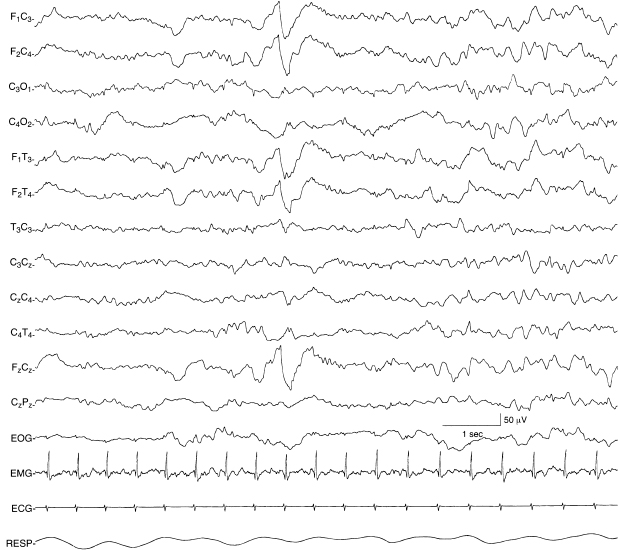
Figure 4.25 38 to 40 weeks CA. Frontal sharp transients with continuous background activity. Bilateral, synchronous, frontal sharp transients are present. They occur randomly. Their occurrence is similar to those of earlier conceptional ages when they first emerge as developmental landmarks, but at this CA frontal sharp transients occur with continuous background activity.
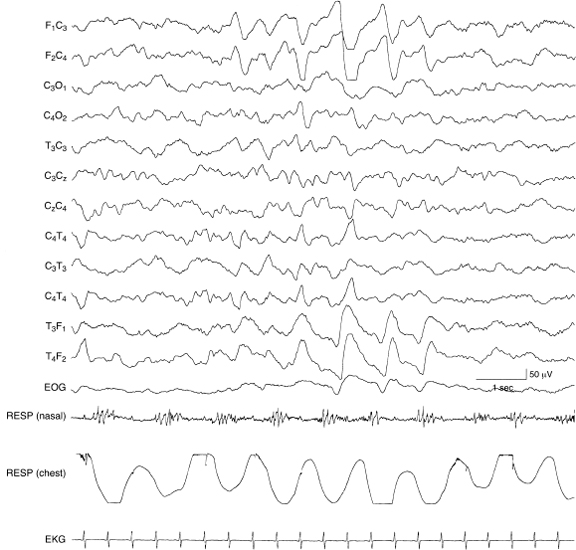
Figure 4.26 38 to 40 weeks CA. Repetitive frontal sharp transients. As at younger CAs, frontal sharp transients may occur in brief runs.
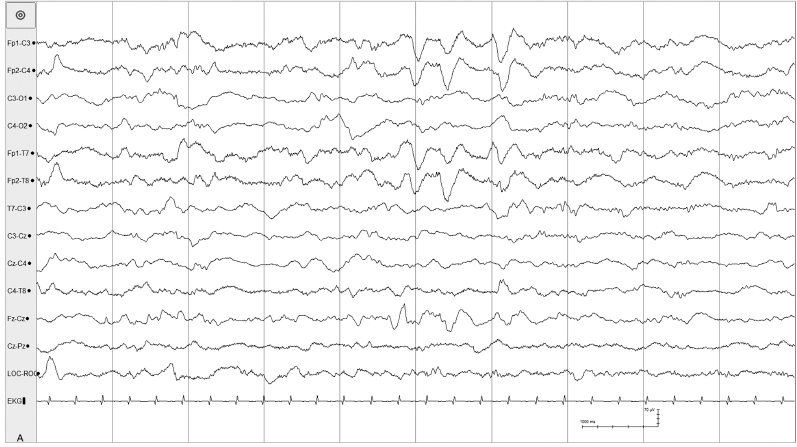
Figure 4.27 (A) and (B) 38 to 40 weeks CA. Symmetrical and asymmetrical frontal sharp transients. (A) Brief run of frontal sharp transients in a 38-week CA infant.
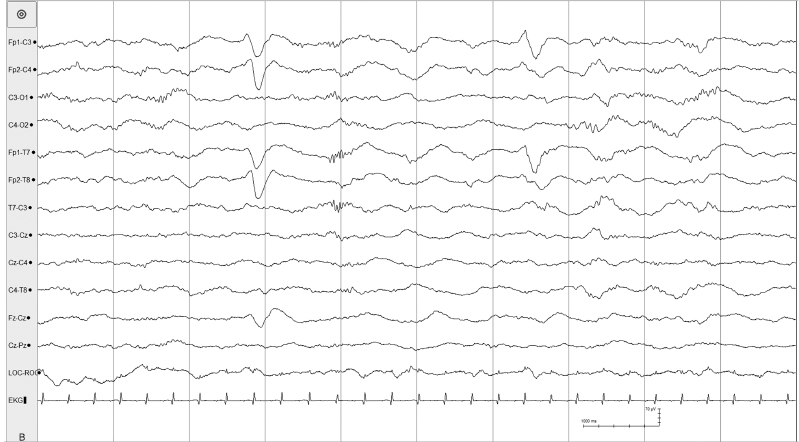
Figure 4.27 (B) Both symmetric and asymmetrical frontal sharp transients in the same infant.
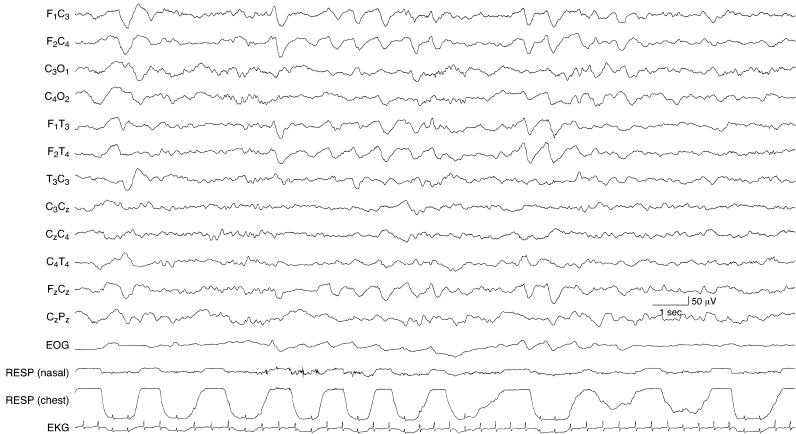
Figure 4.28 38 to 40 weeks CA. Rhythmic bifrontal delta activity in transitional sleep. There is intermittent bifrontal delta activity that, at times, is mixed with frontal sharp transients. Bifrontal delta activity is not a developmental landmark, per se, but this activity is considered a normal variation typically occurring in transitional or indeterminant sleep.
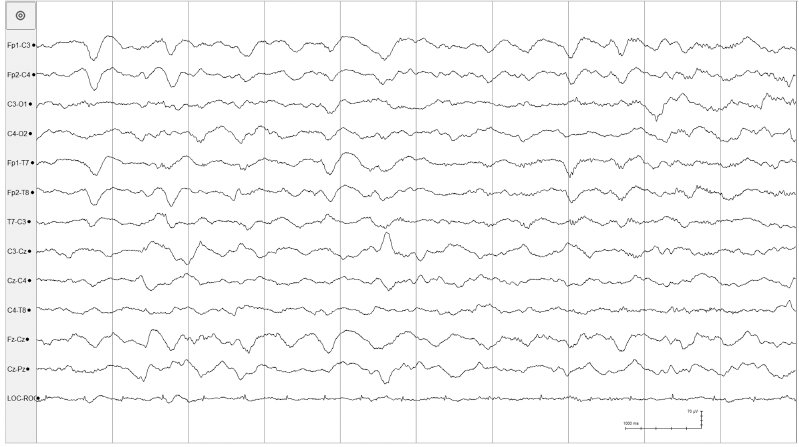
Figure 4.29 38 to 40 weeks CA. Intermittent bifrontal delta activity. Intermittent bifrontal delta activity with occasional frontal sharp transients is present in this 40-week CA infant with other normal features of the EEG.
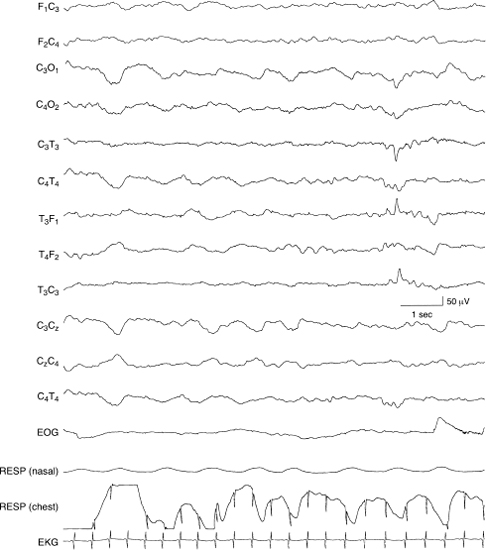
Figure 4.30 38 to 40 weeks CA. Temporal sharp waves. There is a moderate voltage sharp wave in the left temporal region that occurs in isolation. The background activity is normal for CA. Randomly occurring, moderate voltage sharp waves do occur in the EEGs that are otherwise normal and in neonates who also are normal. There is a continuum of the degree of normality to abnormality of these waveforms that is discussed in Chapter 5. This sample is presented to indicate that some temporal sharp waves can be considered normal although the presence of temporal sharp waves does not constitute a developmental landmark.
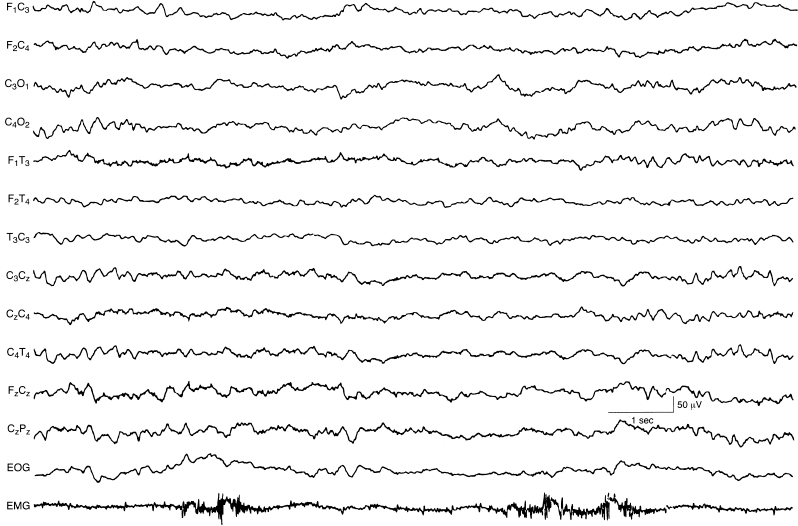
Figure 4.31 38 to 40 weeks CA. Awake: continuous, synchronous polyfrequency activity. There is continuous and synchronous polyfrequency activity that includes a mixture of alpha, beta, theta, and delta activity. (Hrachovy, 2000, with permission.)
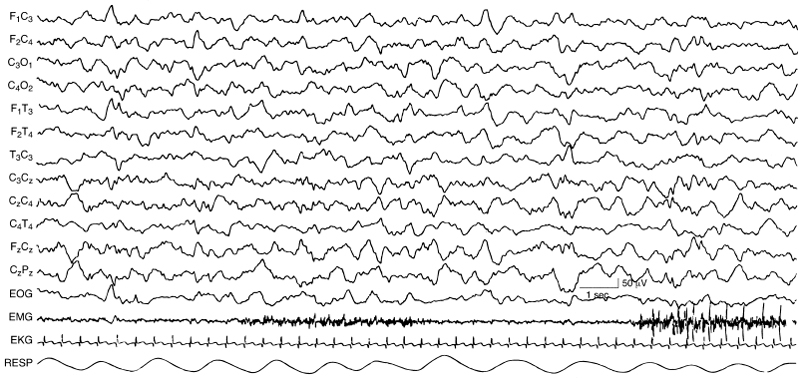
Figure 4.32 38 to 40 weeks CA. NREM (quiet) sleep: continuous slow activity. There is continuous, relatively slow activity that is synchronous on the two sides. Respiration is regular and there are no REMs. (Hrachovy, 2000, with permission.)
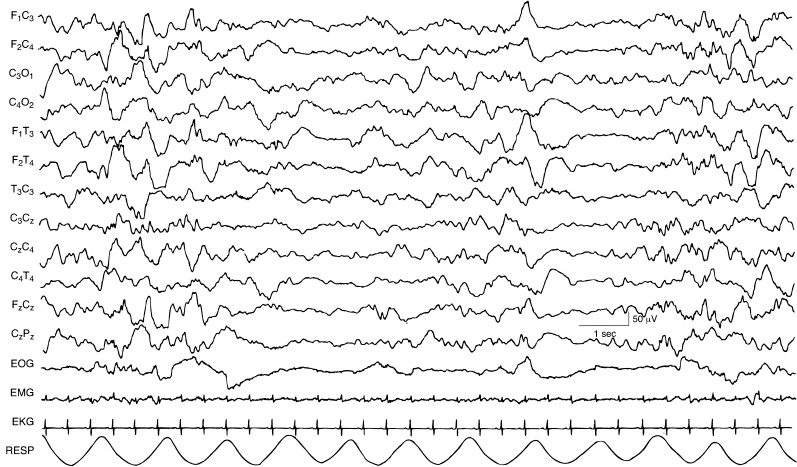
Figure 4.33 38 to 40 weeks CA. Tracé alternant in deep NREM (quiet) sleep. There are periods of discontinuity during deep NREM. (Hrachvoy, 2000, with permission.)
Figure 4.34 (A) and (B) 38 to 40 weeks CA. Tracé alternant with repetitive periods of attenuation. (A) Awake: continuous, synchronous, polyfrequency activity in a 40-week CA infant (15 second segment).
Figure 4.34 (B) NREM sleep: Tracé alterant sleep in the same recording of this infant (15 second segment).
Figure 4.35 (A) and (B) 38 to 40 weeks CA. Tracé alternant with a brief period of attenuation. (A) Awake: continuous, synchronous, polyfrequency activity with frontal sharp tranients in a 40-week-CA infant.
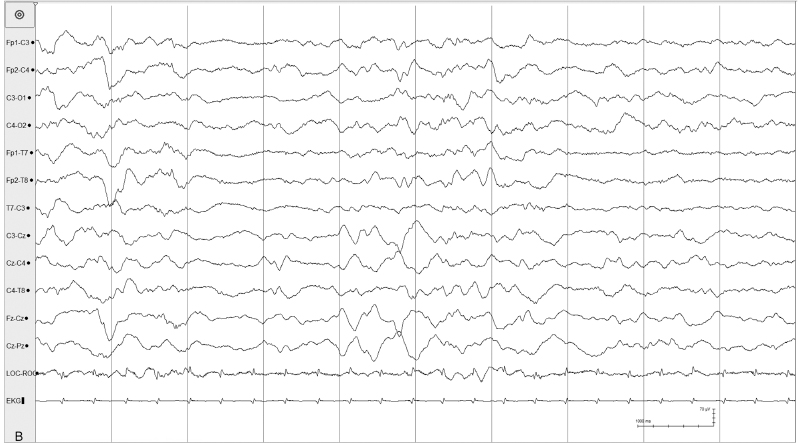
Figure 4.35 (B) NREM sleep: Tracé alterant in the same recording of this infant with relatively brief period of attenuation.
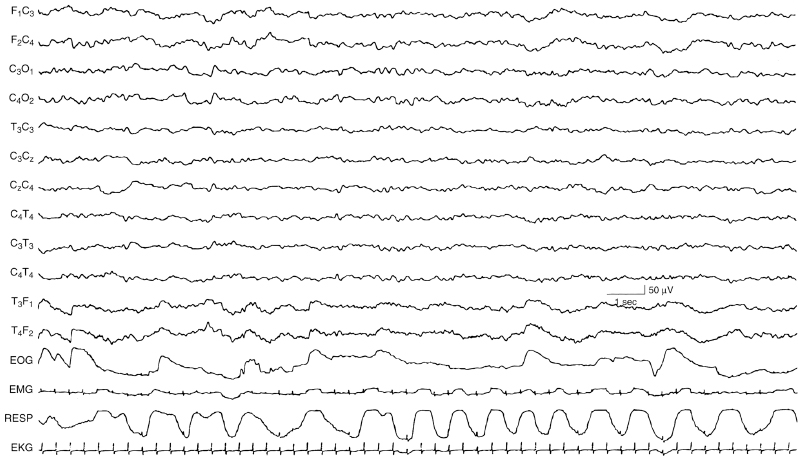
Figure 4.36 38 to 40 weeks CA. REM (active) sleep. There is continuous, synchronous EEG activity. Respiration is irregular and there are REMs (recorded on the EOG channel). (Hrachovy, 2000, with permission.)
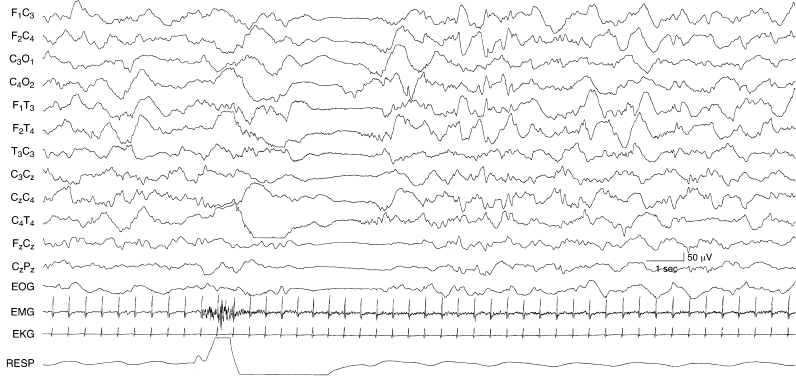
Figure 4.37 38 to 40 weeks CA. Transient arousal: generalized voltage attenuation. The background activity is consistent with NREM (quiet) sleep. There is a brief episode of generalized voltage attenuation associated with clinical arousal (the EMG and respiration channels indicate movement). After about 2 seconds, the EEG returns to NREM background.
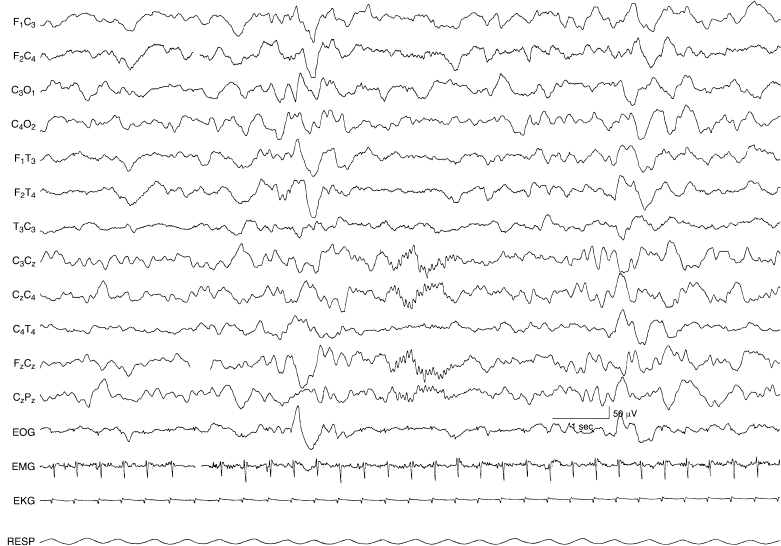
Figure 4.38 41 to 44 weeks CA. Rudimentary sleep spindles. Rudimentary sleep spindles are present in the midline central region in this 43-week CA infant during NREM (quiet) sleep. The background activity is continuous. This is not a typical finding in this CA epoch since spindles are most consistently present after 6 weeks post-term. However, on rare occasions rudimentary spindles do occur earlier and when they first appear are present in the midline central region as shown.
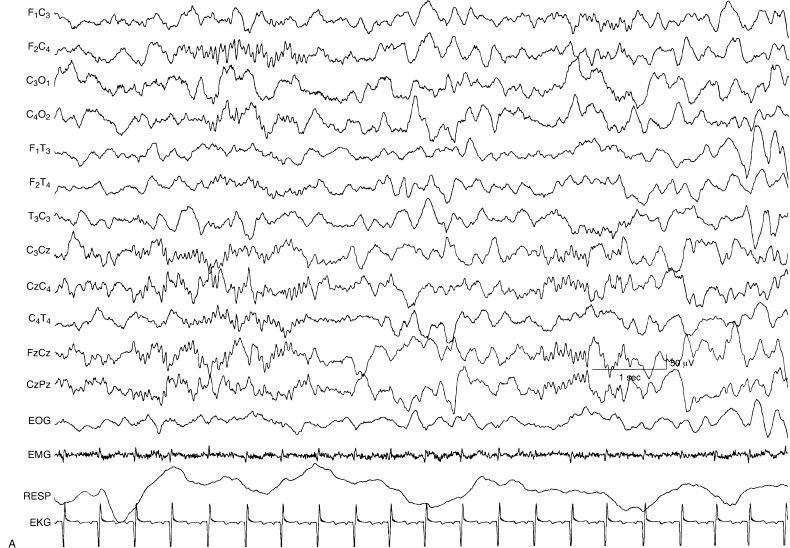
Figure 4.39 (A) and (B) 45 to 48 weeks CA. Sleep spindles. (A) Brief sleep spindles are present first in the right central and then in the left central regions in the EEG of this 46-week CA infant. Both bursts have some midline central localization.
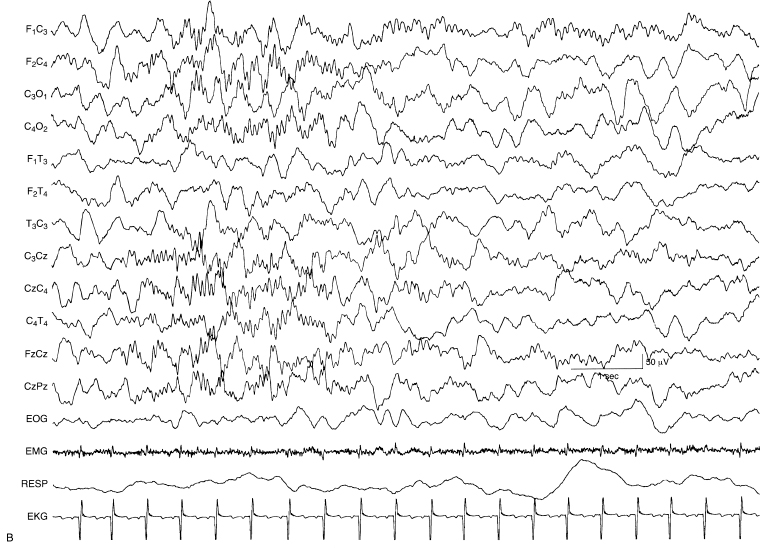
Figure 4.39 (B) This sample is a continuation of the previous sample (A). Now the spindles are longer with the one on the right beginning first, overlapping in time with that on the left. The spindles on the two sides occur simultaneous for a few seconds then the spindle on the right subsides while that on the left persists for several seconds.