Performance
It’s not the focus of this book to tell you how to optimize the performance of your implementation or even to tell you whether it’s necessary. Your implementation should be as fast as it needs to be: some APIs are performance critical and must be called many times per second, whereas other APIs are used infrequently and their speed is of less concern. However, a focus of this book is to show you how certain API design decisions can impact performance, and therefore how you can optimize the performance of your interface.
Your implementation may not need to be high performance, but your interface should still be as optimal as possible so that it is not actively undermining performance. Requirements change, and you may find yourself needing to optimize your implementation after the first version of your API has been released. In this situation you will wish that you had considered the performance impact of your API beforehand so that you are not forced to break backward compatibility in order to improve performance.
However, the most important point to make here is that you should strive to never warp your API for performance reasons. Good designs normally correspond with good performance (Bloch, 2008; Tulach, 2008). Your API should continue to provide a clean and logical representation of the problem domain even after you have optimized its implementation. There are cases where this is simply not possible. For example, if you are writing an API that must communicate across a Remote Procedure Call barrier, you may hit the case that the overhead for performing many individual API calls is too slow and instead you feel the need to introduce a vectorized API that batches up many calls into a single method. However, instances such as these are exceptional. A lot can be optimized behind the API—that’s why you are writing an API after all—so you should endeavor to limit the effect of any performance improvements to your implementation and not cause this work to change your interface.
There are several components to API performance, and I will consider each of these in the following sections.
1. Compile-time speed. The impact of your API on the time it takes to compile a client program. This can affect the productivity of your users.
2. Run-time speed. The time overhead for calling your API methods. This is important if your methods must be called frequently or must scale well with different input sizes.
3. Run-time memory overhead. The memory overhead for calling your API methods. This is important if you expect many of your objects to be created and kept in memory. It can also affect CPU cache performance.
4. Library size. The size of the object code for your implementation that clients must link into their applications. This affects the total disk and memory footprint of your clients’ applications.
5. Startup time. The time it takes to load and initialize a dynamic library that implements your API. Various factors can affect this, such as template resolution, binding unresolved symbols, calling static initializers, and library path searching.
In addition to specific API factors that affect these performance metrics, you should of course investigate your compiler’s options to see if there are any flags you can turn on or off to give a performance boost. For example, turning off Run-Time Type Information (RTTI) if you don’t need to use the dynamic_cast operator is one common decision (-fno-rtti for the GNU C++ compiler).
One of the most important lessons to learn about performance optimization is that you should never trust your instincts on which parts of your implementation you think will be slow. You should always measure the actual performance profile of your API in real-world situations and then focus your optimization effort on the areas that give you the biggest impact. A corollary to this is that you don’t need to start with the most efficient implementation: do it the easy way first and then figure out which parts of your implementation need to be optimized once everything is working.
At Pixar, we would regularly have various teams work on different components of a particular feature for one of our films. For example, the driving system in Cars involved work by the R&D team to implement a generic simulation plugin system, work by GUI engineers to provide direct manipulation controls for animators, and work by the production teams on the movie to integrate everything into their pipeline. Then, once all of the software was functional and integrated, we convened “speed team” meetings to assess where the bottlenecks were and assign work to the relevant engineers so that the overall system would meet specific performance criteria.
The important point is to always remember Amdahl’s law. This states that the overall performance improvement gained by optimizing a single part of a system is limited by the fraction of time that the improved part is actually used. You may increase the performance of one part of your API by a factor of 10, but if a client’s program only spends 1% of its time in that code, then the overall improvement is reduced to only a factor of 0.1 (10 * 0.01).
7.1 Pass Input Arguments by Const Reference
In Chapter 6, I recommended that you prefer const references over pointers to pass input parameters, that is, parameters that are not changed by the function. However, you should prefer pointers over non-const references for output parameters so that their mutability is clearly advertised to clients. This section now offers some additional performance reasons to prefer the use of const references to pass input arguments into a function.
By default, function arguments in C++ are passed “by value.” This means that the object being passed into the function is copied and then that copy is destroyed when the function returns. As a result, the original object that is passed into the method can never be modified. However, this involves the overhead of calling the object’s copy constructor and then destructor. Instead you should pass a const reference to the object. This has the effect of only passing the pointer to the object, but also ensuring that the object is not modified by the method. This can be particularly important for embedded systems where you have a very limited stack size.
void SetValue(std::string str); // pass by value
void SetValue(std::string &str); // pass by reference
void SetValue(const std::string &str); // pass by const reference
This rule only applies to objects. It is not necessary for built-in types, such as int, bool, float, double, or char, because these are small enough to fit in a CPU register. In addition, STL iterators and function objects are designed to be passed by value. However, for all other custom types, you should favor references or const references. Let’s look at a specific example.
MyObject(const MyObject &obj);
MyObject &operator = (const MyObject &obj);
void SetObjectByValue(MyObject obj);
If you assume that the SetObjectByValue() and SetObjectByConstReference() methods both simply assign their argument to the mObject member variable, then the sequence of operations that get performed when each of these methods is called is as follows.
The situation becomes worse if MyObject is derived from some base class because then the copy constructor and destructor of each base class in the object hierarchy would also have to be called for the pass by value case.
There is another reason to avoid passing arguments by value and that’s the “slicing problem” (Meyers, 2005). This is the problem that if a method accepts a base class argument by value and you pass a derived class, then any extra fields of the derived class will be sliced off. This is because the size of the object to be passed by value is determined, at compile time, to be the size of the base class. Passing arguments as const references instead of passing by value avoids the slicing problem.
7.2 Minimize #include Dependencies
The time it takes to compile a large project can depend greatly on the number and depth of #include files. As such, one of the common techniques for decreasing build times is to try to reduce the number of #include statements in header files.
7.2.1 Avoid “Winnebago” Headers
Some APIs provide a single large header file that pulls in all of the classes and global definitions for the interface. This can seem like a convenient affordance for your clients, however, it only serves to increase the compile-time coupling between your clients’ code and your API, which means that even the most minimal use of your API must pull in every public symbol.
For example, the standard Win32 header windows.h pulls in well over 200,000 lines of code (under Visual Studio 9.0). Every .cpp file that includes this header effectively adds over 4 MB of extra code that needs to be loaded from around 90 separate files and compiled for every source file. Similarly, the Mac OS X header Cocoa/Cocoa.h expands to over 100,000 lines of code at over 3 MB.
Precompiled headers can help alleviate this burden by preprocessing these large common include files to a more optimal form, such as a .pch or .gch file. However, a more modular and loosely coupled solution would involve providing a collection of smaller individual headers for each component of your API. Clients can then choose to #include only the declarations for the subset of your API that they are using. This can make for longer lists of #include statements in your client’s code, but the result is an overall reduction in the amount of your API that their code must pull in.
7.2.2 Forward Declarations
A header file, A, includes another header file, B, in order to pull in the declaration of a class, function, struct, enum, or other entity that is used in header A. The most common situation in an object-oriented program is that header A wants to pull in the declaration of one or more classes from header B. However, in many situations, header A does not actually need to include header B and can instead simply provide a forward declaration for the classes needed. A forward declaration can be used when
1. The size of the class is not required. If you include the class as a member variable or subclass from it, then the compiler will need to know the size of the class.
2. You do not reference any member methods of the class. Doing so would require knowing the method prototype: its argument and return types.
3. You do not reference any member variables of the class; but you already know to never make those public (or protected).
For example, you can use forward declarations if header A only refers to the name of classes from header B via pointers or references.
However, if you were to change the definition of class A so that that compiler needs to know the actual size of class B, then you must include the actual declaration of class B, that is, you must #include its header. For example, if you store an actual copy of B inside of A.
Obviously, you will need to #include the full header in any .cpp file that uses the classes in that header, for example, A.cpp must include B.h. A forward declare simply tells the compiler to add the name to its symbol table with a promise that you’ll provide full declaration when it actually needs it.
One interesting point is that a forward declaration is sufficient if you pass a variable to a method by value or return it by value (although you should of course prefer a const reference over passing a parameter by value). You might think that the compiler needs to know the size of the class at this point, but in actual fact it is only needed by the code that implements the method and any client code that calls it. So the following example is quite legal:
Note that it is generally safer to only use forward declarations for your own code. By using forward declarations, you are embedding knowledge of how symbols are declared in the header that you are eliding. For example, if you use forward declares for a foreign header and your API is used in environments with different versions of that header, the declaration of a class within that header could be changed to a typedef or the class could be changed to a templated class, which would break your forward declaration. This is one reason why you should specifically never try to forward declare STL objects, for example, always do #include <string>, never attempt to forward declare std::string.(Note, however, that when using streams, you can use the iosfwd include file to forward declare various template classes in iostreams.)
Finally, it is worth noting that a header file should declare all of its dependencies, either as forward declarations or as explicit #include lines. Otherwise, the inclusion of the header in other files may become order dependent. This is at odds with the statement to minimize the number of #include statements, but it is an important exception for the sake of API robustness and elegance. A good way to test this is to ensure that an empty .cpp file that only includes your public header can compile without error.
7.2.3 Redundant #include Guards
Another way to reduce the overhead of parsing too many include files is to add redundant preprocessor guards at the point of inclusion. For example, if you have an include file, bigfile.h, that looks like this
then you might include this file from another header by doing the following:
This saves the cost of pointlessly opening and parsing the entire include file if you’ve already included it. This may seem like a trivial optimization, and indeed it can be for small include hierarchies. However, if you have a large code base with many include files, this optimization can make a significant difference. Back in 1996, John Lakos performed several experiments to demonstrate the degree of performance improvements that this optimization can affect on a large project. The results were striking (Lakos, 1996). However, given that these results are from the mid-1990s, I designed a similar experiment to test this effect on a modern compiler, and the results correlate well with those of Lakos.
For a given number N, I generated N include files that each included the N − 1 other include files. Each include file also contained around 100 lines of class declarations. I also generated N.cpp files, where each .cpp file included only 1 header. I then timed how long it took to compile every .cpp file. This experiment therefore chooses a worst-case O(n2) include structure, although it also includes the time to run the compiler N times. The experiment was performed for a set of include files that used redundant include guards and a set that did not. Table 7.1 shows averaged results of this experiment using the GNU C++ compiler, version 4.2.1, on an Intel Core 2 Duo processor running Mac OS X 10.6 with 2 GB of RAM.
Table 7.1
Compilation time speedup from using redundant include guards for a worst-case include hierarchy containing N include files
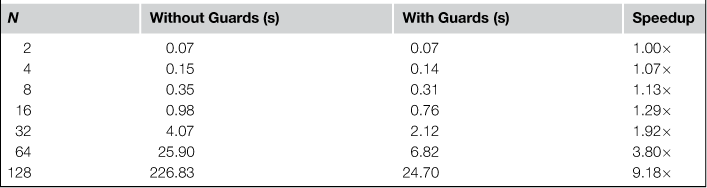
This behavior will, of course, vary by compiler and platform, so in the interest of good experimental technique, I repeated the experiment with the Microsoft C++ compiler, version 14.0, on an Intel Core 2 Quad CPU running Windows XP with 3.25 GB of RAM. Results in this case were even more pronounced, with a speedup of around 18 times for the N = 128 case.
By comparison, I found that the experiment showed almost no effect under Linux (1.03 × speedup for N = 128), where presumably the combination of the GNU compiler and the Linux disk cache produces a more efficient environment. However, users of your API may be using a broad range of platforms so this optimization could have a large impact on many of them. Even a speedup of only 1.29× could make a big difference to the amount of time that they spend waiting for a build to finish. The code to run the experiment is included in the full source code package on the accompanying Web site for this book so you can try it out for your own platforms.
This technique has been used to practical benefit by many large-scale APIs. To give a rather retro example, the Commodore Amiga platform used this technique to improve the performance of the AmigaOS APIs. For instance, here’s what the top of the intuition/screens.h header file looked like for the Amiga in the early 1990s:
7.3 Declaring Constants
Often you want to define a number of public constants for your API. This is a great technique for avoiding the proliferation of hardcoded values throughout your client’s code, such as maximum values or default strings. For example, you might declare several constants in the global scope of your header in this way.
The issue to be aware of here is that only very simple constants for built-in types will be inlined by your C++ compiler. By default, any variable that you define in this way will cause your compiler to store space for the variable in every module that includes your header. In the aforementioned case, this will likely happen for both the float and the string constant. If you declare many constants and your API headers are included in many .cpp files, then this can cause bloat in the client’s .o object files and the final binary. The solution is to declare the constants as extern.
Then define the value of each constant in the accompanying .cpp file. In this way, the space for the variables is only allocated once. This also has the additional benefit of hiding actual constant values from the header file: they are implementation details after all.
A better way to do this is if you can declare the constants within a class. Then you can declare them as static const (so they will not count toward the per-object memory size).
You can then define the value for these constants in the associated .cpp file.
You may think that this is a trivial optimization and will save an insignificant amount of space. However, at Linden Lab, we decided to clean up all of these instances in the Second Life Viewer source code. The end effect was an appreciable 10% reduction in the size of the generated files.
Another option to avoid the bloat issue in certain cases is to use enums as an alternative to variables or you could also use getter methods to return the constant values, such as
7.3.1 The New constexpr Keyword
The problem with all of the options just listed is that the compiler can no longer evaluate the const expression at compile time because the actual value is hidden in the .cpp file. For example, clients would not be able to do either of the following:
However, as part of the new C++11 specification, a new feature has been added to allow for more aggressive compile-time optimizations: the constexpr keyword. This can be used to indicate functions or variables that you know to be constant so that the compiler can perform greater optimization. For example, consider the following code:
This is illegal according to the C++98 standard because the compiler has no way of knowing that the value returned by GetTableSize() is a compile-time constant. However, under the new C++ specification you would be able to tell the compiler that this is in fact the case:
The constexpr keyword can also be applied to variables. However, the fact that it can be used to mark the result of a function as a compile-time constant opens up the door to letting us define constants using a function call while still allowing clients to use the constant value at compile time. For example,
7.4 Initialization Lists
C++ provides constructor initialization lists to let you easily initialize all of the member variables in your class. Using this feature can afford a slight performance increase over simply initializing each member variable in the body of the constructor. For example, instead of writing
you could write
Because member variables are constructed before the body of the constructor is called, in the first example the default std::string constructor will be called to initialize the mName member variable, then inside the constructor the assignment operator is called (DeLoura, 2001). However, in the second example, only the copy constructor is invoked. Using an initialization list therefore avoids the cost of calling the default constructor for each member variable that you include in the list.
Of course, in terms of good API design, you should hide as much implementation detail from your header files as possible. So the best approach is to define the constructor in your header file as follows:
Then provide the constructor and initialization list in the associated .cpp file:
Here are a few things to be aware of when using initialization lists:
1. The order of variables in the initialization list should match the order that the variables are specified in the class.
2. You cannot specify arrays in an initialization list. However, you can specify a std::vector, which may be a better choice of data structure anyway.
3. If you are declaring a derived class, the default constructor for any base classes will be called implicitly. You can use the initialization list to call a non-default constructor instead. If specified, a call to a base class constructor must appear before any member variables.
4. If you have declared any of your member variables as references or as const, then you must initialize them via the initialization list (to avoid the default constructor defining their initial, and only, value).
Furthermore, the new C++11 specification includes improvements in object construction that are relevant here. In C++98, constructors cannot call other constructors. However, this constraint has been loosened in the C++11 standard. Specifically, C++11 will let constructors call other constructors in the same class. This lets you avoid copying code between constructors by delegating the implementation of one constructor to another, such as in the following example:
While the same effect could be achieved by using a single constructor with a default argument, it would bake the default value into your client’s code. The new C++11 syntax lets you hide this value because you can (and should) define the initialization list in the .cpp file.
7.5 Memory Optimization
On modern CPUs, memory latency can be one of the largest performance concerns for a large application. That’s because while processor speeds have been improving at a rate of roughly 55% per year, access times for DRAM have been improving at around 7% per year (Hennessy and Patterson, 2006). This has resulted in the so-called Processor–Memory Performance Gap, as shown in Figure 7.1.
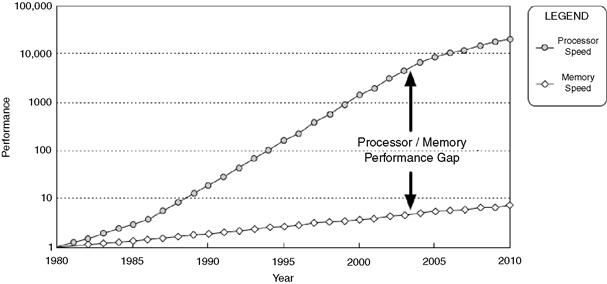
Figure 7.1 The widening gap in CPU performance improvements versus memory improvements. Note that the vertical axis is on a logarithmic scale. Adapted from Hennessy and Patterson (2006). Copyright © Morgan Kaufmann Publishers.
Because of this trend, memory overhead is now a principal factor in the execution time of most programs. This is further exacerbated by the fact that the cost for a cache miss, that is, the cost to access main memory, has increased from a few CPU cycles 30 years ago to over 400 cycles on modern architectures. The effect of this is that a seemingly elegant and demonstrably correct algorithm can behave poorly in real-world situations due to unanticipated cache behavior (Albrecht, 2009). As a result, cache-miss optimization has become an extremely important element of performance optimization activities in recent years.
While it is not the focus of this book to provide techniques to optimize your implementation details in the presence of caches, there are some API-related efforts that you can undertake to improve data cache efficiency. One key technique is to reduce the size of your objects: the smaller your objects are, the more of them can potentially fit into a cache. There are several ways that you can reduce the size of your objects.
1. Cluster member variables by type. Modern computers access memory a single “word” at a time. Your C++ compiler will therefore align certain data members so that their memory addresses fall on word boundaries. A number of unused padding bytes may be added to a structure in order to make this happen. By clustering all member variables of the same type next to each other, you can minimize the amount of memory lost to these padding bytes. Table 7.2 provides example alignment figures for member variable on the Windows platform.
Table 7.2
Typical alignment of member variables of different types under Windows on x86 CPUs (these sizes may vary by platform and processor)
| Type | Size (bytes) | Alignment (bytes) |
| bool | 1 | 1 |
| char | 1 | 1 |
| short int | 2 | 2 |
| int | 4 | 4 |
| float | 4 | 4 |
| double | 8 | 8 |
| pointer/reference (32 bit) | 4 | 4 |
| pointer/reference (64 bit) | 8 | 8 |
2. Use bit fields. A bit field is a decorator for a member variable that specifies how many bits the variable should occupy, for example, int tinyInt:4. This is particularly useful for packing several bools into a single byte or for squeezing two or more numbers into the space of a single int. The downside is that there is normally a performance penalty for using bit field sizes that are not a multiple of 8, but if memory is your biggest concern then this may be an acceptable cost. When implementing performance optimizations, you often have to trade speed for size, or vice versa. Remember, when in doubt about the impact of a feature, measure the real-world performance.
3. Use unions. A union is a structure where data members share the same memory space. This can be used to allow multiple values that are never used at the same time to share the same area of memory, thus saving space. The size of a union is the size of the largest type in the union. For example,
4. Don’t add virtual methods until you need them. I recommended this as a way to keep an API minimally complete back in Chapter 2, but there are also performance reasons to do this. Once you add one virtual method to a class, that class needs to have a vtable. Only one copy of the vtable needs to be allocated per class type, but a pointer to the vtable is stored in every instance of your object. This adds the size of one pointer to your overall object size (normally 4 bytes for a 32-bit application or 8 bytes for a 64-bit application).
5. Use explicit size-based types. The size of various types can differ by platform, compiler, and whether you are building a 32-bit or a 64-bit application. If you want to specify the exact size of a member variable, then you should use a type that specifically enforces this rather than assuming that types such as bool, short, or int will be a specific size. Unfortunately, the way to declare a fixed-size variable varies for different platforms. For example, on UNIX-based systems, the stdint.h header file provides types such as int8_t, uint32_t, and int64_t to specify an 8-bit integer, 32-bit unsigned integer, and a 64-bit integer, respectively. However, the Boost library provides platform-independent versions of these types in the boost/cstdint.hpp header.
Let’s look at an example. The following structure defines a collection of variables to describe a fireworks effect. It contains information about the color and color variance of the firework particles, some flags such as whether the effect is currently active, and a screen location for the effect to begin from. A real fireworks class would have a lot more state, but this is sufficient for illustration purposes.
The variables in this class are ordered roughly in terms of their logical function, without any consideration to how efficiently they are packed in terms of memory. Most member variables are ordered in this way, or sometimes even more randomly by simply adding new variables to the end of the class. For this particular example, the total size for the structure on a 32-bit computer is 48 bytes, that is, sizeof(Fireworks_A) == 48.
If you simply cluster the member variables based on their type and sort them based on the size of each type (bools, chars, then ints), then the size of the structure can be reduced to 32 bytes, a 33% reduction.
You can still squeeze a few more bytes out of the structure, however. By using bit fields you can make each of the bool flags occupy a single bit instead of an entire byte. Doing this lets you get the structure size down to 28 bytes, a 42% reduction.
Finally, you can step back and consider the actual size requirements for each variable rather than simply using ints for all integer values. Doing so, you might decide that the RGB variance values only need to be 1 byte, and the screen space coordinates can be 2 bytes each. I’ll use the types of char and short, respectively, to simplify what follows, but in reality you could use size-specific types such as int8_t and uint16_t.
This version of our structure occupies only 16 bytes: a reduction of 66% from the original unoptimized size of 48 bytes. That’s quite a massive memory savings, just by rearranging the member variables and thinking a little more about how large they need to be. Figure 7.2 shows you exactly where all your memory is going in each of these four configurations.
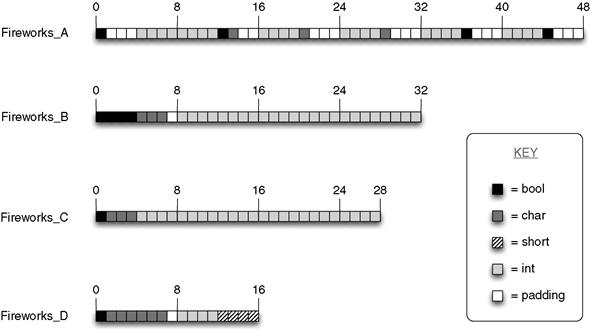
Figure 7.2 Memory layout for four different configurations of member variables in a class. Fireworks_A is the original unoptimized version, Fireworks_B employs type clustering, Fireworks_C uses bit fields to compress bool variables, and Fireworks_D uses smaller integer types.
7.6 Don’t Inline Until You Need To
This may seem like strange advice to give in a chapter on performance: don’t inline code! However, this is first and foremost a book about APIs, and inlining code in your header files breaks one of the cardinal rules of API design: don’t expose implementation details, which is not to say that you should never inline code. Sometimes your performance requirements demand it, but you should do so with your eyes wide open and with a full understanding of the implications, such as the following.
1. Exposing implementation details. As just covered, the primary reason for avoiding inlining in public API headers is that it causes you to expose the implementation of your API methods directly in the header. I spent an entire section in Chapter 2 detailing why you should not do that.
2. Code embedded in client applications. Inlined code in your API headers is compiled directly into your clients’ applications. This means that clients must recompile their code whenever you release a new version of the API with any changes to inlined code. They cannot simply drop a new version of your shared library into their installation and expect their application to just work. In other words, inlining breaks binary compatibility.
3. Code bloat. Excessive inlining can grow the size of your object files and resulting binary significantly. This is, of course, because each call to an inlined method is replaced by all of the operations of that method. This larger code size can negatively impact performance by causing more disk access and virtual-memory page faults.
4. Debugging complications. Many debuggers have problems dealing with inlined code. This is perfectly understandable: it’s difficult to put a breakpoint in a function that doesn’t actually exist! The common way to circumvent these problems is to turn off inlining for debug code.
As Donald Knuth famously stated: “Premature optimization is the root of all evil” (Knuth, 1974).
Despite these downsides, there still may be cases where you need to put inlined code into your API’s public headers. The two main reasons to do this are as follows.
1. Performance. Using getter/setter methods to wrap access to member variables can cause a performance impact in your code if those methods are called many times a second. Inlining can recover those performance losses while still allowing you to keep the getter/setter methods (the accompanying source code for this book has a simple program to let you test this for yourself). However, it should be pointed out that marking a function as inline may not necessarily give you performance gains. For one, this is simply a hint to the compiler that can be ignored. Some situations where the request is likely to be ignored are: using loops in the function, calling another inline function, or recursion. Even when the compiler does inline the method, the resulting code could be larger or smaller, and it could be faster or slower, depending on the original size of the method, your CPU’s instruction cache, and your virtual memory system (Cline et al., 1998). Inlining tends to work best for small, simple, frequently called functions.
2. Templates. You may also be using templates in your header and so are forced to inline the template implementation. Although as covered in the previous chapter on C++ usage, you can sometimes use explicit template instantiation to avoid this.
For those cases where you need to use inlined code, I will discuss the best way to do it. One way to inline code is simply to include the implementation of a method in the class body, such as
double GetX() const { return mX; }
double GetY() const { return mY; }
double GetZ() const { return mZ; }
void SetX(double x) { mX = x; }
void SetY(double y) { mY = y; }
This perfectly demonstrates the concern of including implementation details in your header files: a user of your API can look at your header and see exactly how an inlined method is implemented. In this example, the implementation is simple, but it could easily expose much more complexity.
Another way to inline code is by using the C++ inline keyword. This approach offers at least one improvement over the syntax I’ve just shown in that it lets you define the code for a method outside of the class body. Although the code is still in the header, at least you don’t obfuscate the class declaration with code.
inline void Vector::SetX(double x) { mX = x; }
inline void Vector::SetY(double y) { mY = y; }
inline void Vector::SetZ(double z) { mZ = z; }
inline double Vector::GetX() const { return mX; }
An even better style would be to hide the inline statements in a separate header, where the filename of that header indicates that it contains implementation details. This is the same technique suggested earlier for dealing with templates and is used by several industry-strength APIs, such as Boost headers. Boost uses the convention of a “detail” subdirectory to hold all private details that have to be exposed in header files and then #include those from the public header files. For example,
Boost headers also often use the convention of using a “detail” subnamespace to contain all private implementation code, for example, boost::tuples::detail. This is a good practice to further segment necessary private code in public headers.
7.7 Copy on Write
One of the best ways to save memory is to not allocate any until you really need to. This is the essential goal of copy-on-write techniques. These work by allowing all clients to share a single resource until one of them needs to modify the resource. Only at that point is a copy made. Hence the name: copy on write. The advantage is that if the resource is never modified then it can be shared for all clients. This is related to the Flyweight design pattern, which describes objects that share as much memory as possible to minimize memory consumption (Gamma et al., 1994).
For example, several string objects that store the same text could all share the same memory buffer. Then when one of the strings must modify the text, it creates a copy of the memory buffer so that the modification does not affect the other strings. Figure 7.3 illustrates this concept. Most STL string implementations use copy on write so that passing them by value is fairly inexpensive (Stroustrup, 2000).
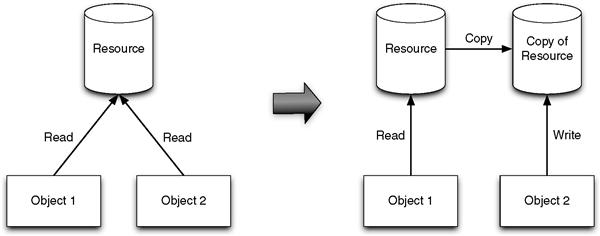
Figure 7.3 Illustrating copy on write: both Object1 and Object2 can share the same resource until Object2 wants to change it, at which point a copy must be made so that the changes do not affect Object1’s state.
There are several ways to implement copy on write. One popular way is to declare a class template that lets you create pointers to objects managed with copy-on-write semantics in the same way that you would create a shared or weak pointer template. The class normally contains a standard shared pointer, to track the reference count of the underlying object, and provides a private Detach() method for operations that modify the object and hence require detaching from the shared object and creating a new copy. The following implementation uses C++11 shared pointers. This is shown with inline methods within the class declaration for reasons of clarity. In real-world applications, you should of course hide these inline definitions in a separate header as they obscure the interface declarations. I have hidden the implementation code in this way for the version of the class in the source code package that accompanies this book.
template <class T> class CowPtr
typedef std::shared_ptr<T> RefPtr;
inline explicit CowPtr(T *other) : mPtr(other) {}
inline CowPtr(const CowPtr<T> &other) : mPtr(other.mPtr) {}
inline const T &operator*() const
inline const T *operator->() const
inline operator const T *() const
inline const T *constData() const
inline bool operator==(const CowPtr<T> &other) const
return mPtr.get() == other.mPtr.get();
inline bool operator!=(const CowPtr<T> &other) const
return mPtr.get() != other.mPtr.get();
inline CowPtr<T> & operator=(const CowPtr<T> &other)
mPtr = other.mPtr;inline CowPtr &operator=(T *other)
if (temp && ! mPtr.unique()) {
mPtr = RefPtr(new T(*temp));This class can then be used as follows:
CowPtr<std::string> string1(new std::string("Share Me"));
CowPtr<std::string> string2(string1);
In this example, string2 points to the same object as string1, whereas string3 points to a copy of the object because it needed to modify it. As already mentioned, many implementations of std::string will use copy-on-write semantics anyway. I’m simply using this as a convenient example.
There is a loophole that can be exploited in the CowPtr implementation I’ve presented here. It’s possible for users to dig into the copy-on-write pointer and access the underlying object in order to hold onto references to its data. They could then modify data directly, thus affecting all CowPtr variables sharing that object. For example,
CowPtr<std::string> string1(new std::string("Share Me"));
char &char_ref = string1->operator[](1);
In this code, the user takes a reference to a character in the underlying std::string of string1. After string2 is created, which shares the same memory as string1, the user then changes the second character in the shared string directly, causing both string1 and string2 to now equal “Spare Me.”
The best way to avoid this sort of misuse is simply to not expose CowPtr to your clients. In most cases, you don’t need your clients to be aware of the fact that you are using a copy-on-write optimization: it’s an implementation detail after all. Instead, you could use CowPtr to declare member variables in your objects and not change your public API in any way. This is called implicit sharing by the Qt library. For example,
where the implementation of MyObject may look like
MyObject::MyObject() : mData(0) {}
std::string MyObject::GetValue() const
void MyObject::SetValue(const std::string &value)
In this way, your clients can use your MyObject API without any knowledge that it uses copy on write, but underneath the covers the object is sharing memory whenever possible and enabling more efficient copy and assignment operations.
In this example, obj1 and obj2 will share the same underlying string object, whereas obj3 will contain its own copy because it modified the string.
7.8 Iterating Over Elements
Iterating over a collection of objects is an extremely common task for client code so it’s worth spending some time looking at alternative strategies that offer different strengths and weaknesses. That way you can choose the best solution for your particular API requirements.
7.8.1 Iterators
The STL approach to this problem is to use iterators. These are objects that can traverse over some or all elements in a container class (Josuttis, 1999). An iterator points to a single element in a container, with various operators available, such as operator* to return the current element, operator-> to access the members of the container element directly, and operator++ to step forward to the next element. This design intentionally mimics the interface of plain pointer manipulation in C/C++.
Clients can then use the begin() and end() methods on each container class to return iterators that bound all elements in the container or they can use various STL algorithms that return iterators within the set of all elements, such as std::find(), std::lower_bound(), and std::upper_bound(). The following code segment provides a simple example of using an STL iterator to sum all the values in a std::vector:
This is purely an illustrative example. If you really wanted to calculate the sum of all elements in a container, you should prefer the use of the STL algorithm std::accumulate.
In terms of your own API designs, here are some reasons why you may want to adopt an iterator model to allow your clients to iterate over data.
• Iterators are a well-known pattern that most engineers are already familiar with. As such, using an iterator model in your own APIs will minimize the learning curve for users. This addresses the ease-of-use quality introduced in Chapter 2. For example, most engineers will already be aware of any performance issues, such as knowing that they should prefer the preincrement operator for iterators (++it) as opposed to postincrement (it++), to avoid the construction and destruction of temporary variables.
• The iterator abstraction can be applied to simple sequential data structures, such as arrays or lists, as well as more complicated data structures, such as sets and maps, which are often implemented as self-balancing binary search trees such as red-black trees (Josuttis, 1999).
• Iterators can be implemented quite efficiently, even as simply as a pointer in some cases. In fact, std::vector iterators were actually implemented this way in Visual C++ 6 and GNU C++ 3 (although most modern STL implementations now use dedicated iterator classes).
• Iterators can be used to traverse massive data sets that may not even fit entirely into memory. For example, the iterator could be implemented to page in blocks of data from disk as needed and free previously processed blocks. Of course, the client can also stop traversing at any point without having to visit every element in the container.
• Clients can create multiple iterators to traverse the same data and use these iterators simultaneously. In the case where clients wish to insert or delete elements while traversing the container, there are established patterns for doing this while maintaining the integrity of the iterators.
7.8.2 Random Access
An iterator allows clients to traverse linearly through each element in a container. However, you may have cases where you wish to support random access to any element, such as accessing a specific element in an array or vector container. STL container classes that support random accesses provide this in a couple of ways.
1. The [] operator. This is meant to simulate the array indexing syntax of C/C++. Normally this operator is implemented without any bounds checking so that it can be made very efficient.
2. The at() method. This method is required to check if the supplied index is out of range and throw an exception in this case. As a result, this approach can be slower than the [] operator.
To illustrate these concepts, the iterator source example in the previous section can be recast in terms of the [] operator as follows:
In terms of performance, these two methods are essentially equivalent. Obviously one approach may prove to be marginally more efficient than the other for a given platform and compiler, but in general they should involve an equivalent degree of overhead.
If you plan to add random access functionality to your API, you should strive to adopt the [] operator and at() method to capitalize on consistency with the STL. However, if your API does not need to provide random access to underlying data, you should prefer using the iterator model over the [] operator approach, simply because an iterator expresses the user’s intent more clearly and results in client code that is more obvious and consistent.
7.8.3 Array References
As an alternative to iterators, some APIs use an approach where the user passes in an array data structure by reference. The API then fills the array with the requested elements and returns it to the user. The Maya API uses this pattern extensively. Autodesk Maya is a high-end 3D modeling and animation system used extensively in the film and game industry. The package includes a C++ and Python API that provides programmatic access to the underlying 2D and 3D data in a scene.
As an example of this pattern, the MfnDagNode::getAllPaths() method is used to return a sequence of node paths in the Maya scene graph. This is achieved by passing in an MDagPathArray object by reference, which is then populated with MDagPath references. Some reasons for this design, and hence reasons why you may prefer this approach for your own APIs, are as follows.
• The primary purpose of this method is performance. In essence, it is a way to collapse a series of connected nodes of a graph data structure into a sequential array data structure. This provides a data structure that can be very efficiently iterated over, but also locates elements adjacent to each other in memory. The result is a data structure that can take better advantage of CPU caching strategies, as opposed to a tree structure where individual nodes in the tree may be fragmented across the process’s address space.
• This technique is particularly efficient if the client keeps the same array around to service multiple calls to getAllPaths(). Also, any initial performance overhead to fill the array can be compensated if the array is kept around to support multiple iterations over its elements.
• This technique also offers a specific feature that the iterator model does not: support for non-contiguous elements, that is, a traditional iterator cannot handle different orderings of elements or omit certain elements from a sequence. Whereas using the array reference technique, you can fill the array with any subset of elements in any order.
This concept can be seen in other languages too, such as the iterator_to_array() function in PHP, which can be used to convert an iterator into an array for faster traversal in certain cases.
As an alternative to consuming a user-supplied array, you could also return a const container of objects and rely on the compiler’s return value optimization to avoid copying data.
7.9 Performance Analysis
As the final section in this chapter on performance, I will take a look at some tools and techniques to help you measure the performance of your system. Most of these are aimed at analyzing the performance of your implementation code and as such are not directly related to how you design your API. However, this is obviously still a very important part of producing an efficient API and therefore worthy of focus.
I will consider several different aspects of performance: time-based performance, memory overhead, and multithreading contention. Also, it should be pointed out that while all of the preceding sections in this chapter dealt with stable features of C++, the following text presents software products that may change over time. Products come, go, change ownership, and change focus. However, I have endeavored to make this list (and the related URLs) as up to date as possible at the time of publication. For a more current list of products, please refer to the accompanying Web site, http://APIBook.com/.
7.9.1 Time-Based Analysis
The most traditional interpretation of performance is how long it takes your code to perform various operations. For example, if you’re developing an image processing library, how long does your Sharpen() or RedEyeReduction() method take to run on a given image? The implication here is that you must write some sample or test programs that use your API so that you can then time your API’s performance under different real-world scenarios. Assuming that you have written such programs, there are several forms of performance analysis you could consider using:
1. In-house instrumentation. The most targeted and efficient profiling you can perform is the kind that you write yourself. Because every piece of software is different, the performance-critical sections of your code will be specific to your API. It is therefore extremely beneficial to have access to a fast timer class that can be inserted into your code at key points to gather accurate timing information. Results can be output to a file and analyzed off line or your clients could integrate a visual display of the timer results into their end-user applications.
The Second Life Viewer provides this capability via its LLFastTimer class. This works by inserting LLFastTimer() calls into critical sections of the code using an extensible label that identifies the area being analyzed, for example, LLFastTimer(RENDER_WATER). The Second Life Viewer itself then provides a debugging overlay display to view the cumulative result of the timers in real time. See Figure 7.4 for an example of this debugging view.
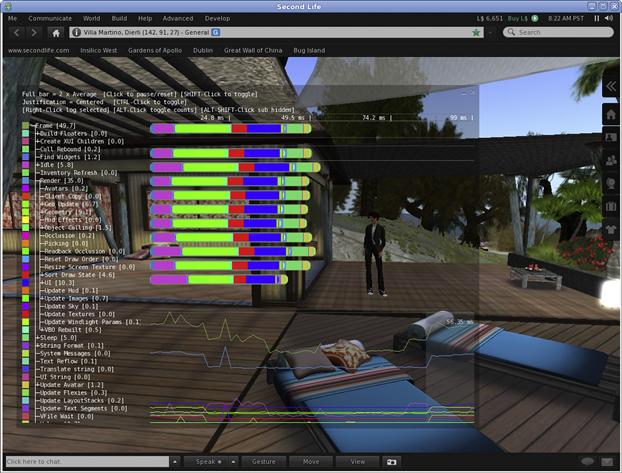
Figure 7.4 Screenshot of the Second Life Viewer showing its built-in view to display the results of various timers embedded in the code.
2. Binary instrumentation. This technique involves instrumenting a program or shared library by adding code that records details for each function call. Running the instrumented binary then creates an exact trace of the function calls for that particular session. Processing resulting data can then determine the top call stacks where the program spent most of its time.
One drawback of this approach is that the extra instrumentation overhead can slow down the program execution significantly, sometimes by as much as 10–100 times, although relative performance should still be preserved. Finally, this technique will obviously not be able to time functions that do not appear as symbols in the binary file, such as inline functions.
3. Sampling. This involves use of a separate program that samples your test application continually to determine its program counter. This is a low-overhead statistical technique, meaning that it may not log every single function call made by your application, but with a sufficiently high sample rate it can still be useful in telling you where your application is spending most of its time.
Sampling can be performed at a system level (e.g., to see if your application spends a lot of time in system calls, e.g., if it is I/O bound) or can be isolated to the functions in your application. In addition to recording time samples, this technique can also refer to sampling processor events, such as cache misses, mispredicted branches, and CPU stalls.
4. Counter monitoring. Many commercially available operating systems provide performance counters that report how well various subsystems are performing, such as the processor, memory, network, disk, and so on. For example, Microsoft provides the Performance Counters API to access counter data on the Windows platform. By monitoring these counters while your application is running you can determine system bottlenecks and also evaluate how inadequate system resources can affect your API’s performance.
Given this categorization of performance analyzing techniques, the following list provides a cross section of profiling tools that were on the market at the time of this book’s publication.
• Intel VTune (http://software.intel.com/en-us/intel-vtune/): This commercial performance analysis suite is available for both Microsoft Windows and Linux platforms. It includes a binary instrumentation feature (called call graph), time- and event-based sampling, and a counter monitor, among various other tools. It comes with extensive and powerful graphical tools to visualize resulting performance data.
• gprof (http://www.gnu.org/software/binutils/): gprof is the GNU profiler. It uses binary instrumentation to record the number of calls and time spent within each function. It is integrated with the GNU C++ compiler and is activated via the -pg command line option. Running an instrumented binary creates a data file in the current directory that can be analyzed with the gprof program (or the Saturn application on Mac OS X).
• OProfile (http://oprofile.sourceforge.net/): This is an open source performance tool for Linux. It is a system-wide sampling profiler that can also leverage hardware performance counters. Profile data can be produced at the function or instruction level, and the software includes support for annotating source trees with profile information.
• AMD CodeAnalyst (http://developer.amd.com/cpu/codeanalyst): This freely available profiler from AMD runs on Windows and Linux. It is based on OProfile with specific support for analyzing and visualizing the pipeline stages of AMD processors.
• Open SpeedShop (http://www.openspeedshop.org/): This is an open source performance measurement tool for Linux based on SGI’s IRIX SpeedShop and currently supported by the Krell Institute. Open SpeedShop uses a sampling technique with support for hardware performance counters. It provides support for parallel and multithreaded programs and also includes a Python scripting API.
• Sysprof (http://www.daimi.au.dk/~sandmann/sysprof/): This open source performance profiler for Linux uses a system-wide sampling technique to profile the entire Linux system while your application is running. A simple user interface is provided to browse resulting data.
• CodeProphet Profiler (http://www.codeprophet.co.cc/): This freely available tool uses binary instrumentation to collect timing information as your application runs. It supports 32-bit and 64-bit Windows platforms, as well as Windows Mobile installations. A CodeProphet View program is provided to visualize the resulting .cpg file.
• Callgrind (http://valgrind.org/): This is part of the valgrind instrumentation framework for Linux and Mac OS X. It uses a binary instrumentation technique to collect call graph and instruction data for a given program run. The separate KCachegrind tool can be used to visualize profile data. An optional cache simulator can be used to profile memory access behavior.
• Apple Shark (http://developer.apple.com/tools/sharkoptimize.html): Shark is a system-wide sampling profiler written by Apple and provided for free as part of their developer tools. It can also profile hardware and software events, such as cache misses and virtual memory activity. Shark includes an intuitive and easy-to-use interface to browse the hot spots of your Apple applications.
• DTrace (http://en.wikipedia.org/wiki/DTrace): This unique and powerful tracing framework can be used to monitor applications in real time. This is done by writing custom tracing programs that can define a list of probes and actions to be performed when a probe fires. Probes include opening a file, starting a process, or executing a specific line of code; actions can analyze the run-time context such as the call stack. Apple added DTrace to Mac OS X 10.5 with an accompanying GUI called Instruments. It is also available as ktrace on FreeBSD.
7.9.2 Memory-Based Analysis
As already stated in this chapter, memory performance can be just as important as time-based performance. Algorithms that allocate and deallocate memory frequently or whose memory allocation profiles do not map well to modern processor caches can end up performing much slower than expected. Also, memory bugs, such as double freeing or accessing unallocated memory, can corrupt data or cause crashes, and memory leaks can build up over time to the point that they consume all available memory and reduce the performance of your clients’ applications to a crawl or cause it to crash.
The following tools can be used to profile your API’s memory performance and to detect memory bugs.
• IBM Rational Purify (http://www.ibm.com/software/awdtools/purify/): This commercial memory debugger uses binary instrumentation to detect memory access errors in C/C++ programs. After a program run, Purify outputs a report file that can be browsed via a graphical interface. It also includes an API that you can access within your programs. Purify is available for Solaris, Linux, AIX, and Windows.
• Valgrind (http://valgrind.org/): Valgrind is an open source instrumentation framework for Linux and Mac OS X that began life as a memory profiling tool. However, it has since matured into a more general performance analysis tool. It works by performing binary instrumentation of your executable file and outputs a textual report when your program ends. Several front-end GUIs are available to browse the output file, such as Valkyrie and Alleyoop.
• TotalView MemoryScape (http://www.totalviewtech.com/): This commercial memory analysis tool available for UNIX and Mac OS X platforms works without binary instrumentation. It provides a real-time graphical view of your heap memory, including memory usage, allocation bounds violations, and leaks. It handles parallel and multithreaded programs and also incorporates a scripting language to perform batch testing.
• Parasoft Insure++ (http://www.parasoft.com/): This is a commercial memory debugger available for Windows, Linux, Solaris, AIX, and HP-UX. Insure++ performs instrumentation at the source code level by prepending your compile line with the insure program. You can even set your debugger to stop whenever it detects an error by adding a breakpoint in __Insure_trap_error(). Of course, there is a GUI tool to let you browse the detected memory errors.
• Coverity (http://www.coverity.com/): Coverity is a different kind of tool from the others listed. It’s a static analysis tool, which means that it checks your source code without actually executing your programs. It records all potential coding errors in a database using a unique ID for each error that is stable across multiple analysis runs. A Web interface is provided to view the results of the static analysis.
• MALLOC_CHECK_: The GNU C/C++ compiler supports an alternative memory allocator that is more robust to simple memory errors such as double frees and single-byte buffer overruns. The trade off is that this memory allocator is less efficient so you may not want to use it for production releases, although it can be useful for debugging memory problems. You can turn on this special allocator by setting the MALLOC_CHECK_ environment variable.
7.9.3 Multithreading Analysis
The final aspect of performance covered here is multithreaded performance. Writing efficient multithreaded code is a very difficult task, but luckily there are various tools out there to help you find logical threading errors in your code, such as race conditions or deadlocks, as well as profile the performance of your threaded code to find concurrency bottlenecks.
• Intel Thread Checker (http://software.intel.com/en-us/intel-thread-checker/): This is a commercial threading analysis tool available for 32-bit and 64-bit Windows and Linux. It can be used to discover logical threading errors, such as potential deadlocks. You can use it as a command-line tool that outputs a textual report or you can use the accompanying visual GUI that maps potential errors to source code lines.
• Intel Thread Profiler (http://software.intel.com/en-us/intel-vtune/): Thread Profiler lets you visualize your threaded application’s behavior by displaying a timeline that shows what your threads are doing and how they interact. This lets you determine if you’re getting the maximum concurrency from your code. It runs on Windows and Linux. Intel now packages Thread Profiler along with their VTune product.
• Intel Parallel Studio (http://software.intel.com/en-us/intel-parallel-studio-home/): Intel’s Parallel Studio provides a suite of tools to support parallel applications on multicore systems, including a utility to identify candidate functions for parallelizing, the Intel Threading Building Blocks (TBB) library, an inspector tool to detect threading and memory errors, and a performance analysis tool for parallel applications.
• RogueWave ThreadSpotter (http://www.acumem.com/): This tool lets you find performance problems in multithreaded and OpenMP applications on Solaris, Linux, and Windows. It contains all of the functionality of Acumem’s single-threaded profiler SlowSpotter (including profilers for memory bandwith/latency and data locality), with the addition of a thread communication and interaction module.
• Helgrind and DRD (http://valgrind.org/): Helgrind and DRD are both modules of the open source Valgrind instrumentation framework. They can be used to detect synchronization errors in pthreads-based applications, including misuses of the pthreads API, deadlocks, and race conditions. They can be used on Linux and Mac OS X.