Chapter 10. Implementing Chaos Engineering Observability
In this chapter you’re going to see how you can use existing Chaos Toolkit controls from the previous chapter to make your chaos experiments observable as they execute.
Observability is an important operational concern, because it helps you effectively debug a running system without having to modify the system in any dramatic way. You can think of observability as being a superset of system management and monitoring. Management and monitoring have traditionally been great at answering closed questions such as “Is that server responding?” Observability extends this power to answering open questions such as “Can I trace the latency of a user interaction in real time?” or “How successful was a user interaction that was submitted yesterday?”
When you execute automated chaos experiments, they too need to participate in the overall system’s observability picture. In this chapter you’re going to look at the following observability concerns and how they can be enabled for your own Chaos Toolkit chaos experiments:
-
Logging the execution of your chaos experiments
-
Distributed tracing of the execution of your chaos experiments
Adding Logging to Your Chaos Experiments
Centralized logging, made up of meaningful logging events, is a strong foundation of any system observability strategy. Here you’re going to add your automated chaos experiment execution into your centralized set of logging events, adding events for all the different stages an experiment goes through when it is run.
You will implement a logging control that listens to a running chaos experiment and send events to a centralized logging system. You are going to see log events being pushed to the Humio centralized logging system, as that is one of the existing implementations available in the Chaos Toolkit Incubator.
The following code sample, taken from a full logging control, shows how you can implement a Chaos Toolkit control function to hook into the life cycle of a running chaos experiment:
...defbefore_experiment_control(context:Experiment,secrets:Secrets):# Send the experimentifnotwith_logging.enabled:returnevent={"name":"before-experiment","context":context,}push_to_humio(event=event,secrets=secrets)...
With the Humio extension installed, you can now add a controls configuration block (see “Enabling Controls”) to each experiment that, when you execute it, will send logging events to your logging system:
{..."secrets":{"humio":{"token":{"type":"env","key":"HUMIO_INGEST_TOKEN"},"dataspace":{"type":"env","key":"HUMIO_DATASPACE"}}},"controls":[{"name":"humio-logger","provider":{"type":"python","module":"chaoshumio.control","secrets":["humio"]}}]...}
Alternatively, you can add a global entry into your \~/.chaostoolkit/settings.yaml file to enable the Humio control:
controls:humio-logger:provider:type:pythonmodule:chaosstuff.controlsecrets:humio
Centralized Chaos Logging in Action
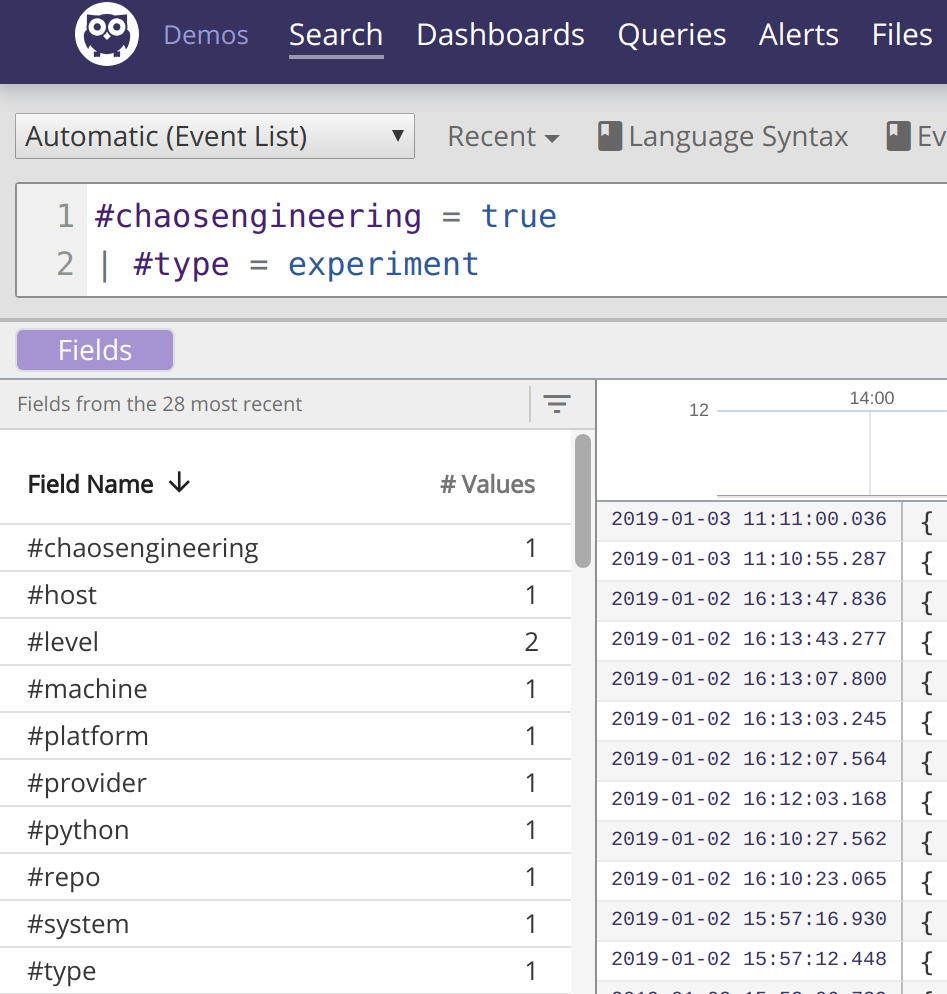
Once that is configured, and the logging extension is installed, you will see logging events from your experiment arriving in your Humio dashboard, as shown in Figure 10-1.

Figure 10-1. Chaos experiment execution log messages
Your chaos experiment executions are now a part of your overall observable system logging. Those events are now ready for manipulation through querying and exploring (see Figure 10-2), like any other logging events.

Figure 10-2. Querying chaos experiment executions
Tracing Your Chaos Experiments
Distributed tracing is critical to comprehending how an interaction with a running system propagates across the system. By enriching your logging messages with trace information, you can piece together the crucial answers to questions such as what events happened, in what order, and who instigated the whole thing. To understand how chaos experiments affect a whole system, you need to add your chaos experiments to the tracing observability picture.
Here you’re going to see how you can use a Chaos Toolkit control that will be able to push trace information into distributed tracing dashboards so that you can view your chaos experiment traces alongside your regular system interaction traces.
Introducing OpenTracing
OpenTracing is a helpful open standard for capturing and communicating distributed tracing information.
The Chaos Toolkit comes with an OpenTracing extension that provides an OpenTracing control, and it’s this control that you are going to use and see in action in this chapter.
Applying the OpenTracing Control
After you have installed the OpenTracing Chaos Toolkit extension, your experiments can be configured to use the OpenTracing control by specifying a configuration block:
{"configuration":{"tracing_provider":"jaeger","tracing_host":"127.0.0.1","tracing_port":6831},"controls":[{"name":"opentracing","provider":{"type":"python","module":"chaostracing.control"}}]}
This configuration turns on the control and points the OpenTracing feed at a destination. The destination in this case is a Jaeger tracing visualization dashboard, but it can be any tool that supports receiving an OpenTracing feed.
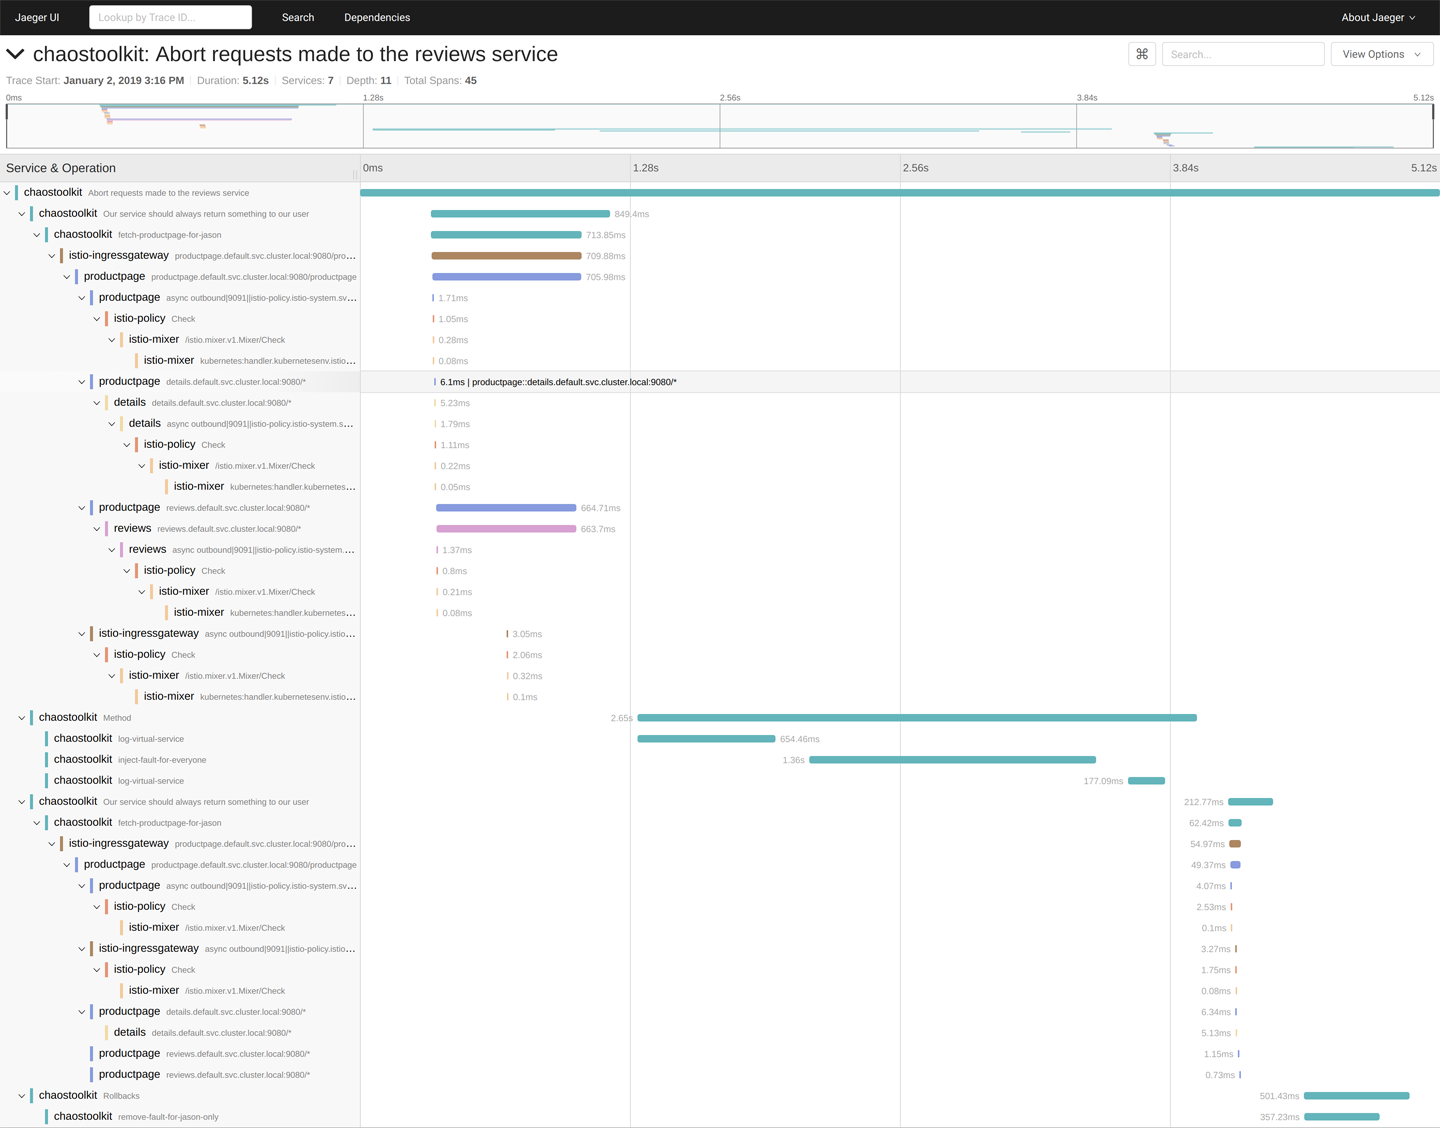
The preceding configuration tells the Chaos Toolkit to send an experiment execution’s traces to the Jaeger dashboard, where those traces can be displayed alongside all the other traces in your runtime system, as shown in Figure 10-3.

Figure 10-3. Application and chaos traces in the Jaeger dashboard
Summary
In this chapter you used existing Chaos Toolkit controls to add logging and distributed tracing operational concerns to your automated chaos experiments. Both of these controls are passive; they simply listen to the execution of your experiment and send information off to their respective systems. Now it’s time to create your own custom control—one that is not passive. Yours is going to provide real control over the execution of an experiment (refer back to Figure 9-1).