Chapter 7
What Can the 1929 Great Depression Teach Us about Today’s Crisis?
Many people have noted some of the similar characteristics of our credit crisis and the terrible times of the 1929 Depression. Some think we will have serious deflation like then. Others ask about how deep and long our current jobless crisis could drag on.
When difficult questions like these arise, my personal mantra is “Let’s look at the data.” In this chapter, I try to look under the hood and back in time to see if I can confirm—or refute—the positions of deflation and how deep the economic cycle might become. And then, based on my findings, I’ll share some further thoughts and conclusions.
This is a particularly difficult time to interpret because the size of the continuing collapse is like nothing we have seen since the Great Depression. It is a credit bubble that is becoming The Great Deleveraging. It is not a typical recession like has occurred about every four years in the usual business cycle (as I explained in Chapter 6, “The Big-Picture Model of Our Economy”). Those traditional recessions do not provide reliable yardsticks for severity and duration. We need to see the similarities of the two biggest stock bull markets and collapse to interpret what might happen today. So my method is to compare important economic measures then to now to see the differences and similarities. We are still living today’s crisis, so some of what is happening is in real time with history. I start with an example of my view of what I expected would be our path from 2006. The example shows there is a lot to learn from history.
Comparing the Stock Market during the Depression with the Current Economy
The stock market then and now as seen in the overlay shows a similar pattern if not as damaging a drop today as in the Great Depression.
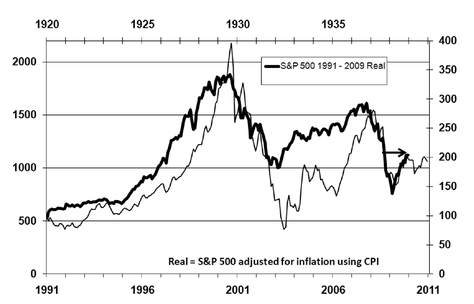
Figure 7.1 shows a stock market comparison that was published in 2006 that has already produced a valid prediction. It provided some reasons to be concerned about the direction of the stock market: It shows the stock market as it rose in 1929 and fell into the 1930s, overlaid by our current stock market to show a similar pattern. Both are in real terms corrected for inflation. The chart only shows the stock market up through 2006, but the ongoing pattern from 1937 was suggesting that the stock market would fall.
Figure 7.1 Although the Patterns of 1920 and 1990 Overlap, We Are Not in a Depression Now
SOURCE: Robert J. Shiller, Yale University.
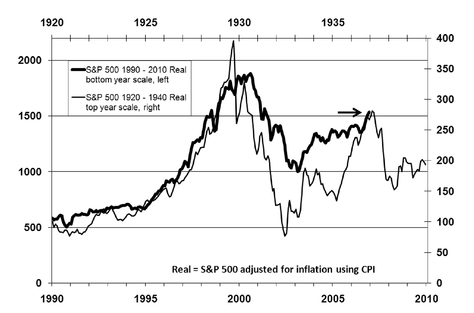
My prediction from that time was mostly right, as noted below:
Potential Concerns Going Forward
The question is whether the potential slowing we are already seeing from the housing bust will spread to other businesses, creating a longer-term slowing. The housing slowing will slow the consumer borrowing against that housing, which will cut consumer spending enough to cause corporate profits to fall. Falling profits will lead to cutting employment and that could slice spending again, in a self-defeating spiral.
A key tipping point will be how the current recession is handled. If the last recession is an example (and Bernanke gives every indication of following suit), the “Fix” will be for the Fed to lower rates and the government to add more deficits to keep the recession from becoming deep. The seeds planted by this reaction will lead to an inflationary recession, what I call stagflation. Other important drivers, like the demographics of old people putting demands on the Medicare and retirement systems, and potential skirmishes over scarce resources (energy) leading to perhaps serious war, bring us to higher deficits that cannot be absorbed, because we are on a weak platform now of overleveraged debt.
The next decade-long cyclic slowing will not spiral into a deflationary quagmire of the 1930s, but into a frothy situation of unexpected high prices but little new wealth.
What This Means for Investors
This is not a time for stock market investors to be complacent about the prospects going forward, because of the long-term cycles and the prospects for earnings and inflation. My view for the decade-long direction for stocks is that prices may appear steady, but that inflation will erode the real returns. The huge rise in stocks in the 1990s parallels the rise in the 1920s, suggesting a slowing of values of equities in the decade ahead. But the stimulus from our governing bodies is likely to hide that slowing under an inflationary cloak, more like the 1970s, thus providing nominal returns that don’t keep up with inflation.
The conclusion of all of this is to be careful of traditional dollar-denominated investments like stocks and bonds, and to be looking for safety against dollar weakness and inflation in physical assets, like precious metals and energy.
While ordinary news reports only modest increases in normal Fed measures of money supply, the credit markets derivatives ballooned 30 percent last year to $370 trillion notional value. The Credit Default Swaps alone are at $15.7 trillion—a number bigger than the U.S. GDP. These markets are now in tumult, as seen in the strange reading where the guarantee plus underlying are trading less than the Treasury.
Our situation is much as I predicted in 2006, except that inflation stopped with the oil peak in July 2008. The commentary on Credit Default Swaps was more important than my emphasis at the time, but no one else was even mentioning them. It is instructive to notice that the amount of CDS tripled since then. CDS brought Lehman and AIG down. It was only $15 trillion then, which seemed huge, but it grew to $60 trillion before that stuff hit the proverbial fan.
Figure 7.2 shows how the stock market played out: The peak of 1929 is aligned with that of 2000. The drop into 1933 was far more damaging than we experienced into 2003. In 1933, the deleveraging of debt became severe. To fight the recession that started in 2001, Greenspan cut interest rates to 1 percent, and the administration cut taxes, provided a stimulus, and started an expensive war. The low rates spurred a housing bubble. That gave consumers a source of borrowing, so they were not hit with the slowing that started after the stock market bubbles of 2000. The crash of 1929 led directly to the implosion of the overextended debt of that time, but I think we are now just starting to look over the horizon of not being able to cope with the current debt deleveraging. That is still to come.
Figure 7.2 Stocks of 1921 and 1990 Overlap, with a Similar Pattern
SOURCE: Robert J. Shiller, Yale University.
Comparing Prices and the Money Supply during the Depression with the Current Economy
Here are more comparisons of the 1929 Great Depression and the current Great Deleveraging. The Depression was the only time we experienced consistent deflation since the Civil War. It was worst in housing and in asset prices, particularly in stocks that dropped 80 percent. The Consumer Price Index (CPI) may not reflect all the pain of the period, as it dropped only about 30 percent. Applied to the 80 percent drop in stocks, that means the drop was less in real terms (about 75 percent).
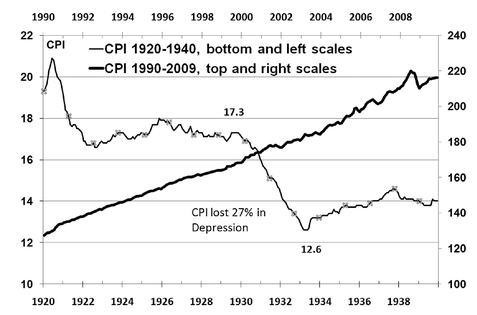
Figure 7.3 shows the different pattern of the deflation then and modest inflation at the start of the current weakness. The conclusion is that deflation today is only a modest wiggle compared to the Depression.
Because the dollar is no longer tied to gold, the government bailout can be much bigger and the inflationary pressures from government deficits and Fed money creation can be effective at decreasing the amount of deflation. The Depression case shown in
Figure 7.3, at 27 percent deflation over two years, is not likely for us going forward now. The other aspect of the comparison shown in
Figure 7.3 is that by 1938, the Depression was no longer hanging over the economy in the way that the current collapse is still seemingly with us. So one might suggest that the worst for deflation has not hit us yet. Also, the peak-to-trough in 2000 for stocks had a significant recovery to 2006 with the 1 percent Fed funds rate in 2003, Iraq war stimulus, and tax cut all helping move stocks higher. Having delayed the more serious collapse until 2008, some will argue that we may now be facing some deflation ahead, but it will be much less than the 27 percent as the Fed and Federal stimulus kicks in, even if the economy continues to collapse.
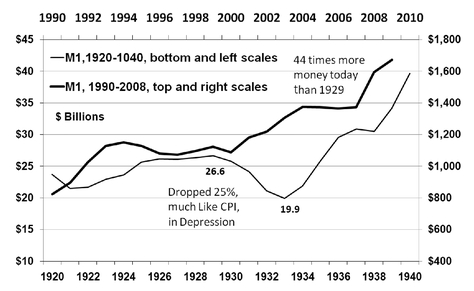
Money supply dropped in the Great Depression. Our money supply today has not dropped, and appears ready to jump on the Fed actions. You can see the difference in
Figure 7.4.
The bailouts assure that money will be growing soon, and thus expecting inflation in the longer term is the proper course.
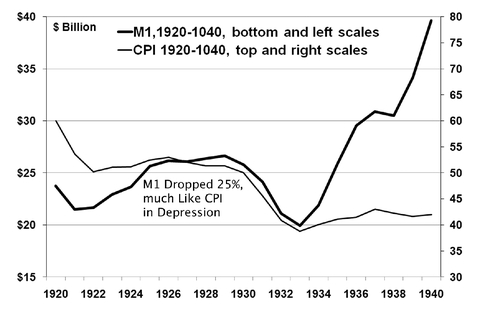
Figure 7.5 shows that M1 and CPI in the Depression dropped together.
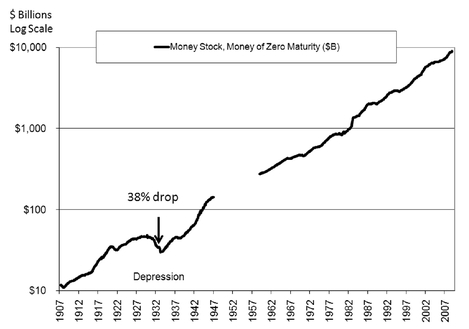
The money supply has continued to expand through the recent recession. M1 has some measurement difficulties because the invention of Money Market Funds (MMFs) has allowed other sources to act as transactions money that didn’t exist during the Depression. Money of Zero Maturity (MZM), which includes the MMF, has been growing even more. A long-term view of money supply data in
Figure 7.6 gives a more precise peak to trough of money supply. Observing the MZM as a comparable measure after 1959 indicates no slowing in money supply to 2009. With the Fed actions in 2008, it is inconceivable that we would see any big decline in the narrow money supply measure (M1) in the short term.
Figure 7.4 Comparison of the M1 Money Supply from 1920-1939 and 1990-2009
Figure 7.5 M1 CPI from 1920-1940 Moved Down Together
Figure 7.6 Money Stock Dropped during the Depression Like No Other Time
SOURCE: Money Stock from NEBR, Demand Deposits + Currency, Seasonally Adjusted, and Federal Reserve MZM after 1959.
The subsequent rise in money after 1933 did not spark inflation, presumably because the growth in the economy was able to absorb the money growth, so it wasn’t inflationary. The gold price was raised to $35 in 1934 (from $20.67 for a 39 percent loss in the purchasing power of the dollar and a 69 percent increase in the gold price). The conversion rate of $35 stayed steady until 1970, keeping prices contained.
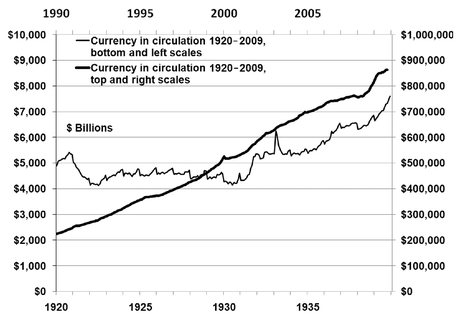
Figure 7.7 shows the size of the currency in the 1930s compared to the present, with the continuing growth across both periods. The growth was much better controlled before devaluing the dollar against gold by 40 percent in 1933, from $20.67 to $35 per ounce. The more important difference might be the big relative size of the currency now versus then. We now have 100 times more. GDP grew less—from a 1929 peak of $865 billion to $9,817 billion by 2000, or only 11 times as much. The insight here is that inflation is not a new phenomenon.
Figure 7.7 Currency Rises Now and in the 1930s Are Similar
Comparing Industrial Output during the Depression with the Current Economy
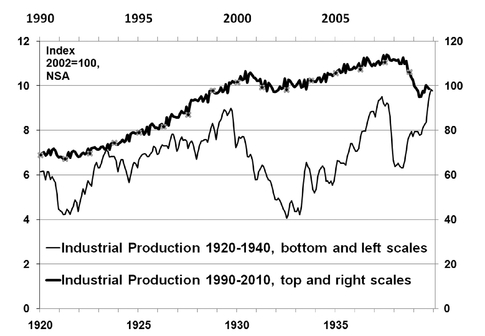
Figure 7.8 shows how industrial output dropped to half during the Great Depression, but it was barely slower in the last downturn in 2003. The fear is that the worst in the downturn is yet to come after 2008. The other comparison is that while currency is 100 times as big as that period, industrial output is only up about 10 times. That suggests that the dollar should be valued at only one tenth as much as then, and that seems to be roughly the case.
Figure 7.8 Industrial Output Dropped More in the 1930s Than in the 2000s
Comparing the Value of Gold during the Depression with the Current Economy
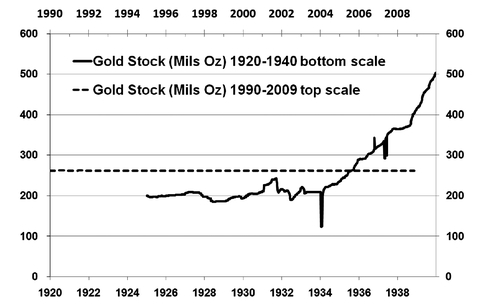
Figure 7.9 shows how gold has been completely stable at 262 million ounces in the current period, because there are no sales and no purchases now that gold is not redeemable for currency. Although there was volatility in the 1920s, there wasn’t a panic in the value of the dollar. The supply of gold held by the central bank grew steadily after the Depression. It seems the stocks of gold were not a serious issue.
It is interesting that the amount of gold that is claimed by the U.S. government today is similar to the amount in the 1930s, but that the amount of currency is now 100 times as large. If there were a need to go back to gold at the similar ratio of the 1930s, this historical precedent might indicate a price of 100 times as high as then, or $3,500 per ounce. Although that is surprising, compared to today’s price, it seems quite possible that the price could rise that much.
Figure 7.9 Gold Inventories Grew after the Depression
Comparing Interest Rates during the Depression with the Current Economy
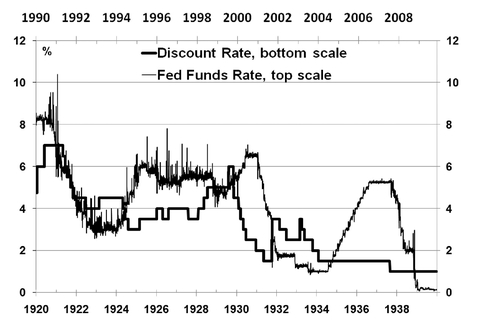
Figure 7.10 is a comparison of the Fed funds interest rate in the 1920s- 1930s and 1990s-2000s. The comparison shows a similar pattern, except that in the 2005 and 2006 time frame, confidence returned, and the Fed raised rates. This is further evidence that the problems of deleveraging the debt were not addressed in the first stock market slowing into 2003, as they were in the 1929 collapse into 1933. One of the reasons that we did not need to unwind in the 2003 time frame is that foreigners continued to loan us the money to keep our economy bubbling along, especially housing. Those foreign investments provided funds for all kinds of debt, including federal government debt. Foreigners loaned us the money, so we not only didn’t need to unwind the extreme debt position, we were able to expand our debt to levels never seen. Foreigners are still loaning us money except for two brief periods: first, in August 2007, at the start of the credit crisis, and again in August 2008, at the escalation of the crisis where big bailouts and loans are now being applied to patch the system together. The overleverage debt problems are just now being forced to be addressed.
Figure 7.10 The Fed Rate Moved Up in 2006, But Stayed Down in 1936
Comparing Publi Debt during the Depression with the Current Economy
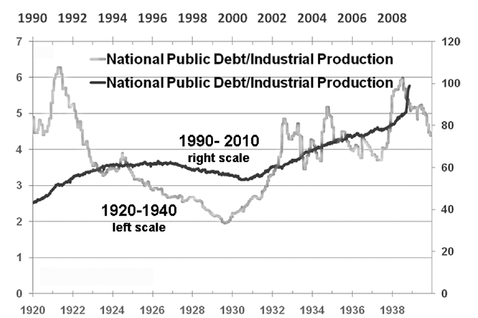
The sheer accumulated size of the public debt is far harder to manage now than three quarters of a century ago. The comparison of debt size movement is much smoother now because the size is so much bigger. To get one comparison of the amount of debt to the productive capacity,
Figure 7.11 shows the ratio of debt to industrial output; it is 20 times larger. Much of that is reflected in the 10-times loss in value of the dollar. There is some real concern that the debt is much larger to handle now, being twice as big in real terms. The material here begs more analysis, but suffice it to indicate that we have extreme amounts of debt yet to unwind.
Figure 7.11 Comparison of the Ratio of Debt to Industrial Production in 1920-1940 and in 1990-2010
Comparing the Price of Oil during the Depression with the Current Economy
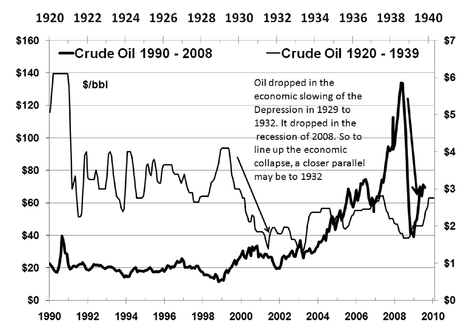
Figure 7.12 shows how the price of oil dropped in the deep economic slowing in the Depression of 1932, but it did not drop until 2008 in the current start of serious recession. That suggests that we are just now starting the parallel downturn because the Greenspan bubble reflation into housing of 2003 did delay the Great Deleveraging for the intervening time period to now.
Figure 7.12 confirms shows how 1933 may be a closer analogy to today’s 2008.
Comparing Corporate Bond Rates during the Depression with the Current Economy
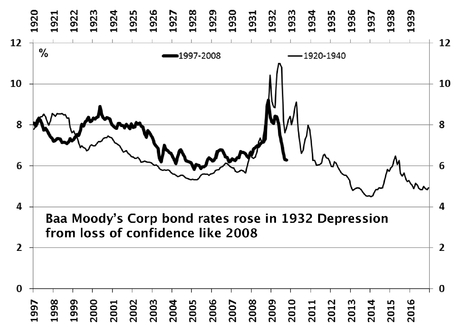
Figure 7.13 takes a closer look at the aftermath of the 1929 stock market crash into the 1932 credit collapse, and it shows a similar pattern for the when matched to the 2008 credit crisis. The interest rate on riskier corporate debt rated a moderately weak Baa by Moody’s jumped up as the world recognized the risk of companies going bankrupt and defaulting on their bonds in 2008. That did not happen in 2002, but in 2008. The conclusion is that the serious phase of the credit crisis just got started in 2008. The more precise comparison is to look at what happened in 1933 to see what may be the path for 2009, particularly for evaluating the path for the riskier interest rates. History showed them rising from the current 9 percent to 11 percent in the next year, and then falling back. That is pretty much how 2009 evolved with an early peak in corporate bonds unwinding in the pattern suggested in
Figure 7.13.
Figure 7.12 Comparison of the Price of Oil in 1920-1939 and 1990-2008
Figure 7.13 Moody’s Corporate Bond Rates Rose During the Depth of the Depression in 1932—as They Did in 2008
Comparing Unemployment during the Depression with the Current Economy
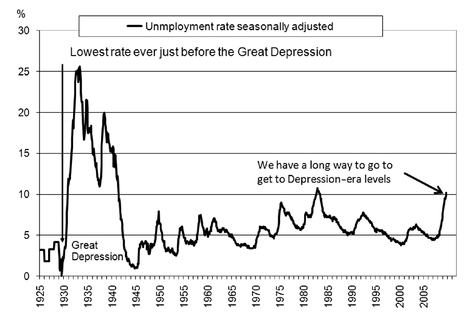
Unemployment is one of the most important statistics to measure the health of an economy. During the Depression, the 25 percent unemployment seared the country and left its mark on a generation. As
Figure 7.14 illustrates, however, we are nowhere near that level today, leaving me to conclude that we are not yet experiencing the kind of deleveraging of that era.
By 1937, which was eight years after the stock market bubble peaked, unemployment was down to 11 percent. Statistical measures today tend to undercount classes of unemployed as “discouraged” and overcount multiple employers, suggesting that today’s numbers should be higher for comparison. Even so, anecdotal stories indicate that we are not even close to the disaster of that era.
My interpretation is that we have not really taken the economy through the great deleveraging that occurred so terribly in that era. We could face that going forward, however, because the United States is not generating new fundamental jobs—for example, in manufacturing—that can sustain the supporting jobs in the service economy. The interpretation is that we are still to face the deleveraging of that era and that 2008 may look more like 1932.
The unemployment problems lingered up until World War II are one of the lagging indicators of recovery. Another lesson in this data is not to expect a rapid recovery in employment today.
Comparing the Producer Price Index (PPI) during the Depression with the Current Economy
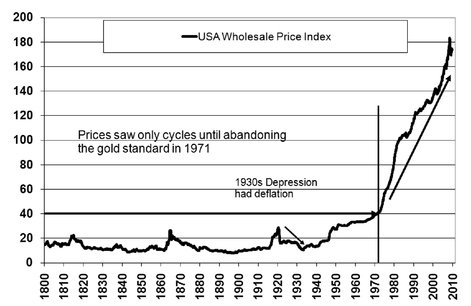
A major structural difference between the Depression and now is that the dollar was on a gold standard until 1971. The PPI wholesale price index shows the shift in underlying direction after 1971 (see
Figure 7.15). The structure of the Federal Reserve and government limited the size of stimulus responses that could be provided in the Depression.
Comparing Housing Growth during the Depression with the Current Economy
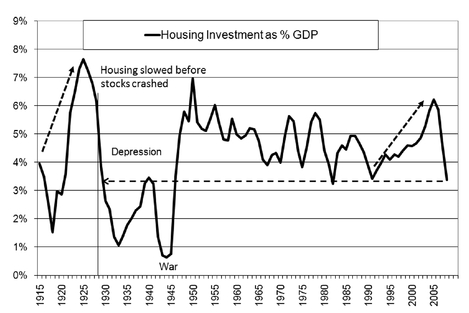
Figure 7.16 illustrates how housing growth slowed before the crash of 1929, and housing is already slowing. The Depression had a very negative effect on housing, and the current situation looks to continue down.
Figure 7.15 How Commodities Prices Rose Dramatically after Going Off the Gold Standard in 1971
Figure 7.16 Housing Investment as a Percentage of GDP: The Housing Bubble in the Years before 1929 Was Even Bigger than in the 2000s
Comparing the Trade Balance during the Depression with the Current Economy
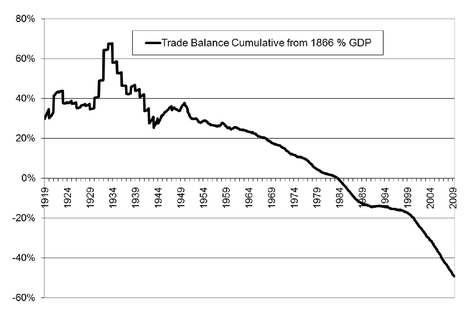
Figure 7.17 shows how the U.S. trade balance has left the United States as the biggest debtor to the world. In the 1930s, the position was strong for the dollar with a trade surplus. To show the comparison over the years, the data in
Figure 7.17 is shown as a percentage of GDP.
Comparing Excess Reserves at the Fed during the Depression with the Current Economy
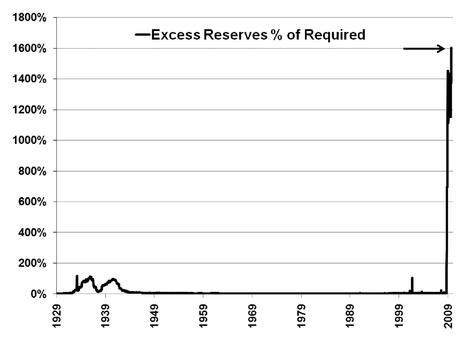
Excess Reserves are a measure of the banks having more on deposit at the Fed than the required reserves. Showing that number as a percentage of the required reserves gives a relative comparison of liquidity in the system. As illustrated in
Figure 7.18, the Fed was accommodative during the Depression, during World War II, and for a brief time during the fear of problems called Y2K during the change to 2000.
Figure 7.17 The U.S. Trade Balance, from 1919-2009: In the 1930s, the U.S. Enjoyed a Positive Trade Balance, But It Is Negative Now
Figure 7.18 How Excess Reserves at the Fed Grew to 100% during the Depression but Reached 700% by 2009
This is one of many measures that show the Fed is acting in a new experiment that has never been done before to pump up money, avoid deflation, help the financial system, and hopefully revive the economy. It would be very inflationary if it weren’t for the collapse of other debt and prices. The obvious conclusion is that the Fed is doing more to expand the money and fight deflation than was ever done before. I expect we will see that work its way through to observed price inflation in the not too distant future.
Conclusion
The current slowdown is coming under the same kind of credit collapse that forced the Great Depression to be so severe. There was too much debt, a housing bubble, and an unsustainable stock market bubble. The implication is that today, we still face a Great Deleveraging, which will also be serious and last for several years. Our stock market crash from the 2000 peak did not lead to the quick and damaging 1933 debt deleveraging.
The main difference is that now the U.S. dollar is no longer tied to a specific exchange rate for gold. That allows the Federal Reserve great latitude to expand its funding to bail out banks. The Fed no longer has to defend the value of the currency. Similarly, the Congress is not as tied to making sure taxing and spending match, because the deficit can be extended without limit if the Fed intervenes and monetizes the government debt.
The expectation is that the Fed will monetize much more debt than it did in the Depression, so the result will be inflationary, once filtered through the system after a delay.
The current collapse after the 2000 stock market peak was much more contained. That was largely accomplished by the Fed cutting interest rates to 1 percent in 2003. That ignited the housing bubble, providing a source of borrowing to keep consumers spending. The kind of collapse that washed out weak debt in the bottom of the Depression was avoided. The great deleveraging that occurred by 1934 didn’t happen by 2009. It is still ahead of us. So the situation that is parallel to today is more like 1931, looking ahead to the unwinding of debt.
The budget deficit for 2009 quadrupled its previous highest-ever level. Funding that deficit will require money creation, and that will be inflationary. The government borrowing to fund the deficit has already started, with the damaging effect of less private credit available for those with less than the most reliable of credit records.
Another difference is that the country has accumulated a trade deficit overhang that is a negative position for the dollar. The size of the accumulated trade deficit of the United States could not have gotten so extreme under a gold standard. But in the current environment, the United States has created international debt on a scale never done before, so that the United States is the world’s largest debtor.
There is a loss of confidence about the country’s creditworthiness that will also make capital harder to find. The world economy is in a fast decline, as U.S. imports slow and foreign profits will be hurt. Non-government interest rates have already risen, as credit risks jumped.
The cause of the current situation is not obvious to most observers—too much debt accumulated over decades. If that were recognized, the solutions of applying more debt wouldn’t be so easily embraced by the complicit Congress and the uninformed public. The cure is the reduction of the level of debt (the Great Deleveraging). But the policy the government is taking makes the disease worse by borrowing more to bail out Wall Street. The government is not even considering decreasing the debt of the country. So the disease will last a long time. The bailouts mean that many zombie financial institutions, whose poor choices should have led to their demise, will be with us for a decade. They will not be relieved of their problems by letting Shumpeterian
2 destruction take its course. The United States will move to inflation because of all the deficits.
Some argue that the Great Deleveraging could be drawn out over a decade like it has been in Japan. The U.S. dollar enjoys many strengths including the fact that dollars are used in many world transactions. But the attitude toward the dollar compared to that of the yen in the 1990 in terms of its prognosis in purchasing power is quite different. The structural weakness of the United States being the largest debtor in the world (as opposed to the largest creditor, as Japan was), leads me to predict a loss of confidence in the dollar that will not allow the elongated muddling that Japan experienced. When foreigners lose confidence in holding Treasuries (they have already lost confidence in holding agencies), the United States could face the kind of crisis that besets overindebted countries, like the Asian Tigers (Thailand, Korea, Philippines, Malaysia, etc.) in 1998 or Latin American countries that experienced currency devaluation when petro dollar debts were too big to handle in the 1980s.
Many are saying that the problem is that housing just needs to be stabilized. I think the problems need to be viewed more comprehensively, and until I hear solutions addressing the debt, I think we will not be close to moving on.
It was the extreme leverage of too much debt that was the precursor to the housing bubble bursting. The current collapse did not start in 2006 and 2007, but in the decade before when too much debt was extended. The source was in the financial engineering of inventing Structured Investment Vehicles (SIVs), securitizing, off-balance-sheet funding, and foreign investing. We will be in recovery after massive overleveraging has been wiped out, mostly through default, and some through dollar inflation to decrease the debt size compared to the ongoing earning power of the debt holders and the economy. That view makes the path ahead more difficult to get to recovery. It will take longer than typical economists think. The deflation we have now is damaging to the debtor. Many debts and debtors will be destroyed before we recover.
The active policy of the Fed, the Treasury, and the administration is to reflate the system, with government-sponsored adding of debt (their own) and new money. Much also depends on whether foreigners slow their loans to the United States, in the form of shifting their buying from Treasuries to something else, such as gold or buying resource-producing companies.
The dollar will come under severe pressure from all these forces going forward.
The conclusion is that although the same forces of debt overleverage drove us to a bubble that burst, we are responding differently this time. With the boom now entering collapse, this particular Great Deleveraging is unfolding with a softening cushion from the massive bailouts. That has allowed some measures of the economy to appear to be recovering which are being called “green shoots.” But these extreme government bailouts are way beyond what was done by Roosevelt in the New Deal. The expansion of government programs during the Depression era amounted to only about $500 billion in today’s dollars. Today’s $10 trillions bailouts, Fed expansions, guarantees, and now spending policies are turning the deflationary tide just as it was starting. The combined assault of all the programs will turn into an inflationary currency crisis, rather than the long deflationary period of the Great Depression. This period of difficulty is likely to extend several years.
It is not so much that the circumstances leading up to the great boom of the economy in both periods are so different. It is that the responses of the government are so much greater this time around. Make no mistake about it: the United States will be facing terrible difficulties in the years ahead. Printing up money does not create more wealth. We will be suffering as a nation from the extreme imbalances that are being unwound. It is the policy of the government to achieve the decrease of so much debt; not through default, saving and paying down debt, and productivity; but through fostering an active debasement of debt through the debasement of the dollar that decreases the debt burden. The decrease will be in real terms even as debt is paid off in inflated dollars. This process will take an extended period as it did after the Great Depression and will be painful for years.
Today’s financial world is far more interconnected and aware of shifting trouble spots than in the aftermath of the Great Depression. Today we face the overhang of foreigners’ confidence in our system that could collapse quickly once the active policy of dollar destruction is understood. Unfortunately, in these circumstances the confidence in the dollar is in the minds of foreigners, not in the short-term policy actions by our government. And should they wake up to how seriously damaged the dollar has become, a collapse could come rapidly.
I worry that our policymakers, particularly Ben Bernanke, do not understand the tiger they are unleashing. By leaning against the historical precedent of deflation they will get what they want: very big inflation. And once that tiger is unleashed it will have its own ravaging effects. So the conclusion I come to is that even though the initial circumstances of the stock market crash of 1929 and our current-day economic slowing are similar, the responses are different enough that the 1929 deflationary historical event is not likely to be repeated.
The other country experiencing deleveraging and deflation that seems comparable is Japan and their “lost decade.” Japan’s situation is slightly different because its central bank took a much more active role than did our Federal Reserve during the 1930s. The next chapter takes a more detailed look at what lessons we could learn from Japan’s bubble bursting.


