Chapter 3
How Advertisers Made Decisions
If the influence model is a realistic description of how newspapers really worked, there should be some evidence that advertisers considered a newspaper's influence when making their buying decisions.
The evidence is obvious when we compare extreme differences, such as National Enquirer v. The Washington Post. It gets harder to see when we look for subtle differences among mainstream newspapers. But change is afoot. By the turn of the twenty-first century, the advertising profession was in every bit as much turmoil as journalism—also as the result of new technology. While the turmoil was painful for all concerned, it al left the business open to new ideas and ways of thinking.
The pre-Internet way of evaluating advertising was by counting eyeballs or “gross rating points.” The industry was ingeniously detailed in its efforts to develop specialized counts.1 Probability models were used to estimate such esoterica as the number of unduplicated ad exposures in extremely narrow reader categories such as women age 25–45 who purchased shoes in a given market in the previous six months.
Data for these quantitative measures typically came from just two sources. A newspaper's circulation, verified by the Audit Bureau of Circulations in most cases, told the potential size of the audience. Survey research, conducted by large-scale national polls, gave a clue to the number who actually read or looked into a given publication on an average day. It is the readership surveys that provide the basis for estimates within such narrow categories as the younger shoe-buying women.
Advertisers used a simple calculation called cost per thousand impressions (or CPM) to estimate the relative value of different media mixes. An “impression” simply meant, in advertising jargon, that the message, whatever the medium, was delivered to the targeted consumer. It did not tell whether she looked at it (or, in the case of radio, listened to it), much less whether she acted on it.
Because advertisers like efficiency, they used survey data to try to minimize duplication. A national advertiser who wanted to sell me a mail-order computer in 2005 could have gotten two chances by advertising in both USA TODAY and The Wall Street Journal because I was a home-delivery customer for both. But he or she was more interested in reaching two people once rather than one person twice, so I would have been considered an inefficient duplication. The survey data helped ad buyers maximize net or unduplicated reach.
Another issue was frequency. While the number of daily newspaper readers had declined steadily since the 1960s (see Chapter 1), the number of those who read at least once a week varied somewhat less. Therefore, repeating an ad several times during the week would bring in readers who missed earlier opportunities to see it. The outcome of higher frequency is an increase in net or unduplicated reach. Or, to put it crudely, more eyeballs. Michael Naples, who studied the issue of ad frequency enough to write a book about it, declared that three exposures to a target audience was optimal. One exposure, he said, had little or no effect; at two exposures you would start to see some response; and efficiency peaked at three exposures. After that, there was still additional return but it was less likely to be worth the cost.2
Influence got into the picture in a rudimentary way. The sophisticated advertiser would use survey data to estimate the impact of a particular kind of ad by asking survey respondents if they remembered the ad or could name the product. These numbers helped establish general weights or rules of thumb to represent estimated impact. In one textbook example, a color ad got more than twice the weight of the same ad in black and white. The back page of a newspaper section was better than the front (probably because of fewer distractions).3
But that's not the kind of influence we're talking about in the quest for an economic rationale for quality journalism. There ought to be a way to measure not just awareness but the elements of trust and bonding with the community. An effective ad in a trusted publication would be worth more to advertisers.
Advertisers could be making such calculations intuitively, without realizing it. The marketplace absorbs information in mysterious ways. When the space shuttle Challenger crashed in 1986, it took a panel of experts several months to figure out that the defective component was the system of O-rings connecting segments of Morton Thiokol's solid rocket booster, used to bring the space shuttle into orbit. But the stock market quickly sensed which of the four main contractors was responsible, and the knowledge was reflected in the value of Morton Thiokol shares within just a few days after the crash.4
The Defense Department recognized the collective wisdom of markets in 2003 when it tried to create a Policy Analysis Market to anticipate terror strikes before they happened—a good idea that was shot down by bad public relations.5
If Adam Smith's “invisible hand” of the marketplace was at work in setting advertising rates, then influential newspapers should have been getting more for their advertising than those with less influence—whether they recognized the reason for it or not.
We could test this if we had a good operational, i.e. measurable, definition of influence. In Chapter 1, we found that credibility made a pretty good surrogate for influence. To simplify the argument, let's just think of it as trustworthiness. I'm going to try to convince you that trusted newspapers in my early twenty-first century study period were able to ask more for advertising than those that were less trusted. What follows now is the statistical case for that proposition.
Remember that the Knight Foundation study included independent samples of five hundred persons in each of the twenty-six communities where John S. and James L. Knight operated newspapers in their lifetimes.6 The question it asked was, “Please rate how much you think you can believe each of the following news organizations I describe. First, the local daily newspaper you are most familiar with. Would you say you believe almost all of what it says, most of what it says, only some, or almost nothing of what it says?” For cross-market comparison of newspaper credibility, the percent who said they believed almost all of what the paper says makes a convenient benchmark.
Because the question is not specific to any particular newspaper, it measures newspaper credibility in the market as a whole. Therefore, it is necessary to limit this analysis to those markets that met three tests:
1. Market definition in the Knight Foundation survey was based on a whole county or combination of counties.7
2. Newspaper advertising in the county is dominated by a single newspaper or combination under joint ownership or management.
3. The circulation of the dominant newspaper is verified by the Audit Bureau of Circulations and does not exceed 300,000.8
In the case of Fort Wayne, which has two newspapers with a joint operating agency including the advertising department, I used the combination advertising and circulation figures. (See Table 1 for a list of papers and their home-county penetration.)
The third decision was made after exploratory analysis showed that variance in advertising rates is much greater for very large markets, which are susceptible to a greater variety of influences, than for smaller ones. Whether this is strictly a function of their size or due to peculiar circumstances in each large market, one cannot be sure. Either way, the theory doesn't work for the largest newspapers.
Those eliminated by virtue of size were The Detroit Free Press, The Philadelphia Inquirer, and The Miami Herald. In Philadelphia, where the Inquirer and Daily News are about even in Philadelphia County, I could have kept the Daily News because it met the under-300,000 test for total circulation. But because its fate is so closely tied to that of the Inquirer, it seemed more consistent to leave it out. (The result doesn't change substantively.)
These decisions left a convenience sample of twenty-one newspapers whose circulation ranged from 289,814 (San Jose Mercury News) to 16,038 (Aberdeen American News).
In addition, The Union-Recorder of Milledgeville, Georgia, was eliminated because its circulation was not verified by ABC. The two papers left out because the Knight Foundation survey did not include whole counties were the Press-Telegram of Long Beach, California, and the Post-Tribune of Gary, Indiana.
The Knight Foundation surveys, with a minimum sample size of five hundred, were conducted in 1999 and 2002. Because the single credibility question is subject to fluctuation, the two surveys were averaged for a better estimate of newspaper credibility in the twenty-one counties.
Analysis: Uncovering the Hidden Hand
The source for published advertising rates was the monthly report of Standard Rate and Data Service for April 2002.9 The weekday rate per Standard Advertising Unit (SAU) was used if reported, otherwise the column-inch rate. The range was from $352 for the South Florida Sun Sentinel (Tribune Co.'s paper in Fort Lauderdale) to $29 for the Aberdeen American News. The rates are shown in Table 2.
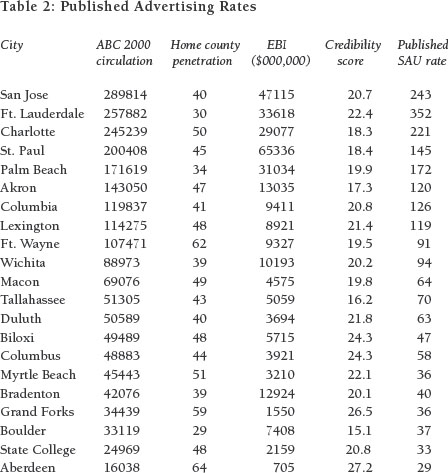
The obvious source for such wide variation in published advertising rates is circulation size. It alone accounts for 88 percent of the variance in posted ad prices.
Some of the remaining variance can be explained by the wealth in the market, a value estimated by SRDS and reported at the county level as Effective Buying Income (EBI). Home county circulation penetration is also a factor. A newspaper whose market was compact and contiguous was more likely to be useful to local retail advertisers, and a relatively high home county penetration distinguished such a market from one whose circulation was thinly spread. The range for home county penetration was from 30 percent (South Florida Sun-Sentinel) to 64 percent (Aberdeen American News).
The hypothesis that citizen trust, as measured by the Knight Foundation question, can predict published advertising rates, was tested with a variation on the idea of correlation. It is a multiple regression model, and it estimates the effect of individual variables after the effects of the others have been taken into account.
To keep it simple, the following table just shows the good stuff. Each line shows how much variation in ad rates is predicted with each additional variable, starting with circulation. The table is cumulative. Thus, circulation alone explains 88.2 percent of the variation in ad rates, and adding EBI to the equation boosts that by two percentage points, to 90.4. The third column gives the overall significance of each variable's contribution to published ad rates.
After circulation, home county penetration and credibility make the more meaningful contributions. (The second column is headed by the statistical term for “variance explained” or R2 because it takes up less room.) The column for significance gives the statistical probability that the effect is a chance result of the small sample.
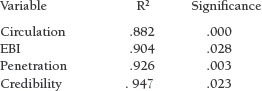
The hypothesis is supported. Credibility explains an additional 2.1 percent of the variance after circulation, home county penetration, and EBI have all had their effects accounted for.
For a better visualization of what is happening the regression was rerun, leaving out the credibility variable, and saving the unstandardized residuals. These numbers represent the variability in advertising rates that is left over after making adjustments for circulation, home county penetration, and EBI. This adjusted SAU rate ranged from 84 in the case of the Ft. Lauderdale Sun-Sentinel to -32 for the Saint Paul Pioneer Press. In other words, the Sun-Sentinel asked $84 more per SAU than its circulation, home county penetration, and EBI would justify while the Pioneer Press asked $38 less.
The scatterplot below shows the effect of credibility on adjusted ad rates and identifies the main outliers.

Credibility explained 19 percent of the residual variance in published advertising rates. Its effect was statistically significant.10
The slope indicates that, other factors being equal, each percentage point increase in credibility is worth an additional $3.25 in average SAU rate. Please remember that this is a limited sample, heavily influenced by that outlier at the top, the South Florida Sun-Sentinel, which was above average in credibility and very high in published advertising rate. Many more cases would be needed to make this result generalizable beyond the Knight communities.
At a meeting in New York City in 1985 to discuss that year's ASNE credibility study, David Weaver suggested a need to find out “how much credibility is worth and how much it costs to get it.” We now have a tentative answer to the first question. Based on the mean ad rate in this group of twenty-one newspapers of $131.21, this result suggests that, other factors being equal, a one-point improvement in credibility was worth a 2.5 percent increase in a newspaper's asking price for advertising.
But hold on. It's only an asking price. Newspaper rates are fixed more firmly than rates for broadcast media, where buying local advertising is a lot like buying a car—few pay the sticker price. Broadcasters' rate cards, in the words of one textbook, are “simply a starting point for negotiation.”11 Newspapers, although more stable than that, sometimes have different rate cards for different classes of advertisers. Some will include value-added elements in the price, like creative services or access to audience research. An ad that is repeated might be priced at a lower “pick-up” rate because the newspaper's cost of composing it has already been covered. Separate advertising and editorial content for different geographic zones further complicates the price issue because it makes it possible to buy only certain desired geographic segments of a newspaper's circulation.
Steve Rossi was president of Knight Ridder's newspaper division, and he was present when I presented these results at a Poynter Institute gathering. He pointed out the problem, but as a friend will, he accompanied his criticism with a remedy. Eighteen of the papers in the sample were members of the Knight Ridder group, and Rossi was able to provide the mean advertising rates actually charged by those papers.12 It turned out that the published price was highly correlated with actual price, explaining 90 percent of its variation.13 But that doesn't mean a lot because it is the variance after circulation is accounted for that interests us. Here the correlation is still positive. When published rate and actual rate are expressed as dollars per thousand circulation, the published rate explains most of the variation (60 percent) in actual rates.14
So published rates are not meaningless. While that improves confidence in their validity, the next step does not. When the four-variable regression was run with the eighteen Knight Ridder papers, using the actual ad price as the dependent variable, nothing had predictive power except the absolute value of total circulation. All of the interesting effects, including home county penetration, effective buying income, and credibility simply vanish.
This makes us suspect that the price/credibility effect is driven by the three non KR papers in the sample (Boulder, Palm Beach, and Fort Lauderdale). It's easy to check, and you don't need statistical tests. Just take another look at the chart in Figure 13. Boulder is down in the low-rate, low-credibility corner, and Fort Lauderdale soars in the opposite corner. Palm Beach is one of those unlabeled points in between. Their presence is creating the whole effect: another reason to look beyond this small and peculiar sample.
Much more data collection is needed. A better measure of influence would help, too. As a minimum, there ought to be a multi-item measure of media credibility like the one used by Chris McGrath and Cecilie Gaziano in their 1985 credibility study for the American Society of Newspaper Editors. (I'll explain why I like it in Chapter 4.)
The Knight Foundation's single item would have become more powerful if more data points had been accumulated. If such a survey could have been started much earlier and fielded every three years for thirty years, there would have been twelve time points to compare, and a clearer picture would have emerged.
Meanwhile, I choose to believe that something real has surfaced, briefly and seductively, in this data set. Somebody with more time and better data ought to try to replicate it with digital media. Meanwhile, let us turn to other historic signs that influence is a real or potentially real factor in determining the value of advertising.
The Search for More Precision
The most encouraging news is that CPM—the concept created to help ad buyers find the most eyeballs at the least cost—is falling out of favor. It might still be popular with the sell-side analysts of Wall Street, who like it for its simplicity, but it gets less and less attention among the real decision makers. Part of the problem is the imprecision of the number, based as it is on tiny samples within each narrow demographic group that advertisers care about. Questions were raised as far back as the mid 1990s.
“Some marketing and media planners believe that the cost-per-thousand concept is a dead issue,” said Sissors and Bumba in their 1995 text. “[J]ust because one vehicle has a lower CPM than another does not mean that it has more value than another. Many planners and marketing executives believe CPM measures value. But CPM is only remotely related to sales. Lower CPM does not mean more value.”15
Those planners and marketing executives represented the sophisticated end of the ad buying business. At the other end, decision makers at small newspapers seldom had enough data to worry about CPM even if they wanted to.
Ken Smith, a former newspaper publisher turned professor at the University of Wyoming in Laramie, surveyed advertisers in six small cities to learn the basis of their ad buying decisions. Cost was seldom a factor, nor did the advertisers show much knowledge of audience sizes.
“Instead, their decisions are much more subjective in nature,” reported Smith, “often based on personal or emotional rather than business factors.”16
A large number based their evaluation on little more than word of mouth. A customer walked in the store and said, “I saw your ad.” Or the advertiser might notice that sales go up after an ad runs, but have no way to discount other factors such as weather, season, or employment rates. Much greater precision was attained when an ad contained coupons that were returned and counted.
We should not leap to the conclusion that the big city advertising buyers with their hair-splitting CPM calculations were smarter than the grass-roots guys. By being a part of the local culture and knowing the customers personally, the small-town retailer was in a better position than a national advertiser to recognize such a hard-to-measure factor as an advertising medium's influence.
Supporting evidence is found in another academic survey from the 1990s, which sampled advertisers in two college towns, Athens, Georgia, and Madison, Wisconsin. In response to an open-ended question, a fourth of the advertisers in both markets volunteered opinions that “higher editorial quality and better production capabilities would increase daily newspapers value as an ad medium.”17
One advantage that local advertisers had was their dual relationship with local media. On the job, the newspaper was their business tool, but it was also their off-the-job personal instrument, as Jana Frederick-Collins noted in a widely cited paper written while she was a graduate student at Chapel Hill.18 This duality can be a powerful force. When USA TODAY was struggling for recognition by the national advertisers on which it would ultimately depend, it established an advertising industry beat in its business section. That strategy helped make the paper a personal instrument for the people who make national ad buying decisions and shortened the long wait for profitability.
So we have some support for the following working hypothesis: influence is an existing factor in local ad buying decisions and a potential factor for national buyers.
A brief look at the recent history of national advertising will show why I think the second part of that proposition is true.
Advertising and journalism used to have a lot in common. Both attracted bright, creative people who were there at least in part for the fun of it. The secondary reward for those who succeeded in advertising was lots of money, while, for those who were good at journalism, the rewards were mostly intangible, including the chance to influence public policy for the better.
Both businesses were affected by the late twentieth century move toward consolidation, bureaucratization, and pressures for short-term profitability.
“For most of the last half of the 20th century, advertising was exciting, and it was fun,” wrote the former publisher of Advertising Age in a contemporary history of the business. But the fun started to go out of it when the consolidation movement gained headway.
“Within only a few years,” said Joe Cappo, “the advertising agency business in the United States has transformed from dozens of independent, entrepreneurial, creative, and highly competitive shops into an oligopoly of four large publicly held corporations.”19
The four, Publicis Groupe, Omnicom Group, Interpublic Group of Companies, and WPP Group, accounted for 55 percent of all global advertising and marketing expenditures, Cappo estimated in 2003.
Creativity formerly channeled into producing cute, clever, and emotion-arousing messages was broadened to take in a wider array of decisions. The more important creative thinkers were those who could look at the total marketing problem and develop a strategy for deploying the best combination of tools. Advertising became integrated with sales promotion and public relations.
The way advertising was paid for began to change. When television was the main national medium, agencies charged a straight 15 percent commission, and that was enough to support plenty of auxiliary services like audience research and copy writing at no extra charge. But as technology made the problem more complicated, agencies were forced to unbundle those services. At the same time, a unified strategy was needed to break through the noisy buzz of the information age and get messages into places where they would change behavior. Just as newspaper editors were realizing that they had to get their messages not just into people's hands, but into their heads, advertisers started worrying about how much their messages affected buying behavior.
One result was talk of an “involvement index” to be added to the standard audience measurements to help advertisers “reliably reach interested consumers when and where they're willing to engage.”20 If advertisers are willing to think about an involvement index, can an “influence scale” be far behind?
Newspaper publishers and their advertisers have been slow to pick up on new technological opportunities for measuring the degree to which newspaper advertising affects sales. Bar code scanners, developed with the assistance of the National Science Foundation and first applied at a grocery store in Troy, Ohio, in 1974, made it possible to test the effect of product-specific advertising and special sales events with unprecedented speed and precision, but the newspaper industry was slow to exploit that opportunity.
When B. Stuart Tolley was director of advertising research for the Newspaper Association of America, he ran a nice demonstration project. Using Richmond, Virginia, newspapers, he designed a split-run experiment so that half the area got one set of ads and the other half a different set. All were image ads for national grocery products including Nabisco Fruit Newtons and Meow Mix. Purchasing was monitored through a local supermarket chain that captured both the purchase and the shopper's identity (through a Valued Shopper Plan card) at checkout. Those data, collected for twenty-five weeks, were merged with the newspaper subscription list so that Tolley could see which shoppers had been exposed to which ads.
The Nabisco ad produced the strongest result, generating $4.40 in additional sales per ad dollar spent.21 For a national brand trying to increase market share, that was significant.
The desire for measurement is one of the factors pushing advertising toward more direct marketing where effects are instantly and precisely recorded. Coupon ads in newspapers, the catalogs that fill up your mailbox, and those hated suppertime telephone calls are the familiar forms of direct marketing. They persisted in the pre-digital age because their cost effectiveness was never a mystery.
New Forms of Direct Marketing
Now the Internet is bringing new forms of direct marketing. Like all technology, it can be used for good or for ill. Users range from Nigerian con artists promising to make you rich in exchange for access to your bank account, to Amazon.com recommending a book expressly for you based on its knowledge of your tastes as revealed in previous purchases.
Internet advertisers have the potential to establish their own influence. When the battery for my off-brand cell phone wore out, I went to the retailer who sold it to me and found that he no longer supported that brand and wasn't a bit apologetic about it. Neither did any other telephone or electronic retailer who advertised in my local newspaper. I called the manufacturer, who was happy to sell me the batteries, but only in gross lots. On a hunch, I turned to Amazon.com, typed in the name of my off-brand phone, found it and the battery listed, and had my replacement battery two days later.
My cell-phone story is not entirely a happy one because it shows the ease with which technology can separate advertising from its traditional role of supporting socially useful editorial content. The Internet can be a perpetual catalog; it never clutters my mailbox, yet I can always find it when I want it.
The catalog function has been one of newspapers' strengths in competing with television. A newspaper is a pretty good information retrieval machine because you can interact with it by turning the pages to find specific product information. TV has prettier pictures, but it keeps you passive, and it lacks the bandwidth to give you very detailed product information. The Internet solves both of these problems,
As noted in Chapter 1, a standard strategy for an industry disrupted by new technology is to focus on a function of its business that it can still perform better than the substitute. Newspapers, because of their editorial content and not in spite of it, are positioned to wield more influence than any of the substitutes. As community bulletin boards and suppliers of the policy-related information that is required for democratic deliberation, they have influence that would be very difficult for an Internet-based medium to duplicate. As a defensive measure, newspapers are rightly getting Web sites of their own, although they vary considerably in their dedication to taking full advantage of the value-added potential of the new medium. The most obvious application is classified advertising because of the speed with which ads can be posted, revised, and withdrawn as sales are made. And, thanks to Craig Newmark, it can be free to most private users.
What's not yet clear is whether an Internet classified ad site must dominate its market in order to survive. The history of newspapers has shown that a given community will, in the long run, support only one marketplace. Buyers and sellers alike tend to converge on the spot where they are most likely to find one another, and the surviving papers in formerly competitive markets were generally those that had established themselves as the dominant classified ad medium.
But the Internet makes it easier to hop from one market to another. If I don't find the book I'm looking for on Amazon.com, I have no hesitation about going to Barnes & Noble, Borders, or Powell's, each only a mouse-click away. Market-hopping is so easy, in fact, that maybe the concept of a fixed location— albeit a hyperspace location—for a market is wrong-headed. The success of Google, as of this writing the most popular online search engine, makes us wonder. Consider the following observation by reporters for The Wall Street Journal: “Google long ago realized something that is only dawning on many other companies: Searching isn't a Web sideline—it's the Web's strategic heart. While Amazon and other sites try to position themselves as the central place for online shopping, thousands of shoppers are simply Googling for sandals or curtains and whatever else they want.”22
Google makes money off this behavior by selling pop-up ads that are related to the user's search and appear on the same page as the initial result of the search. What we have here is direct marketing with fiendishly clever efficiency, far better than a newspaper coupon.
Still, a newspaper can beat the Internet in portability. You can read it in the bathroom, at the breakfast table, in the back yard, or on the bus. But computers are getting smaller and more portable and are no longer in need of being hard-wired to the Internet. They can even hide in your mobile phone, turning it into a multiple-use device for e-mail, Internet browsing, and GPS navigation. In the coffee houses on Franklin Street in Chapel Hill, I no longer see students reading newspapers. But they are browsing the Internet on their wireless-connected devices or texting on their cell phones.
These developments tend to leave very little for a newspaper to do better than anyone else—except for the influence factor. The newspaper's influence within its community, a good that can be created and sustained only by high-quality, geography-specific editorial content, will be very difficult for any new medium to replicate.
But it can be done. As I will remind you repeatedly, newspapers suffer from the historic fact that they are a manufacturing enterprise. They buy raw materials, ink and paper, add value with news and information and advertising, then transport and sell the finished product. The trouble with a manufacturing business is that its main costs are variable, not fixed. Every new customer means a proportional added cost in raw materials and transportation. If you double your customers, you double the newsprint.
The Internet, like broadcasting, is mostly fixed cost. If the number of searchers accessing a web page increases ten fold, the cost of maintaining that page does not, within certain limits, change. Broadcasters have always had that advantage over newspapers. If the new media barons of the future make large investments in creating trusted editorial products that will attract and influence citizens and buyers, newspapers will be in trouble, but society will still be served.
Here's an example that journalists can appreciate. The Poynter Institute for Media Studies, the nonprofit institution that owns the St. Petersburg Times, wants to improve journalism by providing mid-career education to journalists. One of its education tools is its Web site. But how to attract viewers? It was, recalled Jim Naughton, former head of the institute, “rich with academic material that no one knew was there.”23
Naughton and his marketing director/online editor, Bill Mitchell, solved the problem with a friendly takeover of Jim Romenesko's Web operation. Romenesko was an entrepreneur who rounded up news and gossip about the media from a variety of sources and posted it for the benefit of practitioners. Journalists spend a lot of time in front of computer terminals, and many got the habit of taking breaks to see what Romenesko was dishing out about their peers. After joining Poynter, Romenesko performed the same reliable service, but you had to get to him by accessing Poynter first. It introduced a lot of people to Poynter and made many of us psychologically dependent on it.
Before Romenesko came aboard in 2000, the Poynter site was generating around 10,000 page views per weekday. By 2003, it was up to 160,000 a day, with spikes to 250,000 when there was a big story like the departure of editor Howell Raines from The New York Times.24 As a journalism teacher, I had, in that hot summer, more than a passing interest in following the Times's handling of its mendacious reporter Jayson Blair. I could have used Google, but it was much more efficient to go straight to the Poynter site and get, in addition to Romenesko's roundup, the full array of Poynter faculty, contributors, and editors who had something to say on the subject.
I was not alone. By 2003, PoynterOnline was the trade publication most read by journalists, beating both of the slick-paper publications, American Journalism Review and Columbia Journalism Review.
The link between advertising and editorial content should work in exactly that way across various platforms. And while newspapers still enjoyed domination on the editorial influence side of the equation at the turn of the century, they quickly started to lose it to bolder and more far-sighted entrepreneurs in new media.
Without being partial to one medium or another, researchers, whether in industry or in academe, ought to be vitally interested in this issue and strive to do two things:
1. Find a way to measure a medium's influence.
2. Establish a clearer relationship between its influence and the value of its advertising.
If we can't do that—or won't—it will soon be time to think about vehicles other than advertising-supported media to fulfill the social responsibility functions that newspapers have historically provided. Without such data, the shareholders in newspaper companies will continue to press for what amounts to a harvesting strategy, short-sightedly reducing the newspaper to a bare-bones advertising platform with neither influence nor prospect of survival. We should not let them give up so easily.
1. For example, Kent M. Lancaster and Helen E. Katz, Strategic Media Planning (Lincolnwood, Ill.: NTC Business Books, 1989).
2. Quoted in Jack Z. Sissors and Lincoln Bumba, Advertising Media Planning (Lincolnwood, Ill.: NTC Business Books, 1995), 140.
3. Lancaster and Katz, Strategic Media Planning, 39.
4. Michael T. Maloney and J. Harold Mulherin, “The Complexity of Price Discovery in an Efficient Market: The Stock Market Reaction to the Challenger Crash,” Journal of Corporate Finance 9:4 (Sept. 2003), 453–79.
5. Peter Coy, “Betting on Terror: PR Disaster, Intriguing Idea,” BusinessWeek (Aug. 25, 2003), 41.
6. The John S. and James L. Knight Foundation promotes excellence in journalism worldwide and invests in the vitality of twenty-six U.S. communities where the communications company founded by the Knight brothers published newspapers. The Foundation is wholly separate from and independent of those newspapers.
7. This eliminated Gary, Indiana, and Long Beach, California, where the survey areas were defined by zip codes. Two markets, Miami, Florida, and Columbia, South Carolina, were defined by pairs of counties. In the Miami case, we split them and examined Miami-Dade and Broward Counties separately. In South Carolina, we treated Lexington and Richland Counties as a single unit.
8. Baldwin County, Georgia, was eliminated because its main paper's circulation is not audited. Markets eliminated by virtue of their size were Philadelphia, Detroit and Miami. The source for circulation data was the electronic version of County Penetration Reports, Spring 2000, Audit Bureau of Circulations, Chicago, Ill. Most of the audits reported there were conducted in 1999.
9. SRDS Newspaper Advertising Source, 84:4, (Des Plaines, Ill., April 2002).
10. R = .435, p = .049. An earlier version of this analysis without the 2002 Knight Foundation survey was presented by Joe Bob Hester and me in “Trust and the Value of Advertising: a Test of the Influence Model,” American Association for Public Opinion Research, Nashville, May 17, 2003.
11. J. Thomas Russell and W. Ronald Lane, Kleppner's Advertising Procedure (Upper Saddle River, N.J.: Prentice Hall, 1999), 273.
12. My thanks to Virginia Dodge Fielder, then the Knight Ridder Vice President/Research for assisting with this task.
13. r = .951
14. r = .774, p < .0002
15. Sissors and Bumba, Advertising Media Planning, 76–77.
16. Ken Smith, “Advertisers' Media Selection in Small Newspaper Markets,” Newspaper Research Journal 19:1 (Winter 1998), 39.
17. Glen J. Nowak, Glen T. Cameron, and Dean M. Krugman, “How Local Advertisers Choose and Use Advertising Media,” Journal of Advertising Research 33:6 (November/December 1993), 46.
18. Frederick-Collins, “Measuring Media Image: Expectations, Perceptions and Attitudes of Local Retail Advertisers,” prepared for Association for Education in Journalism and Mass Communication, Montreal, August 1992.
19. Cappo, The Future of Advertising: New Media, New Clients, New Consumers in the Post-Television Age (New York: McGraw Hill, 2003), 11.
20. Don Rossi, “New Media `Involvement Index' May Change Forty-Year-Old Marketing Rules,” Advertising Age 73:17 (April 29, 2002), 16. Reprinted in Cappo, The Future of Advertising, 54–57. See also Bradley Johnson, “Cracks in the Foundation: Why the Very Currencies the Industry Depends on Are Dated and Inadequate,” Advertising Age 74:49 (December 8, 2003), 1.
21. Tolley, “A Study of National Advertising's Payout: Image Ads in Newspaper ROP,” Journal of Advertising Research 33:5 (September–October 1993), 11–20.
22. Mylene Mangalindan, Nick Wingfield, and Robert A. Guth, “Rising Clout of Google Prompts Rush by Internet Rivals to Adapt,” Wall Street Journal, July 16, 2003, A1.
23. Telephone interview, Aug. 14, 2003.
24. E-mail from Jim Naughton, Aug. 20, 2003.