This chapter looks at what AIDS is doing to populations through demographic indicators. HIV-infected people experience episodes of illness that lead to death. All effects flow from these illnesses and deaths. Although these indicators are important, and are being dramatically altered in some settings, they have their limitations and these too are discussed.
Demography is the study of population dynamics, which collects data on quantifiable events and uses this for analysis and projections. The basic data sources are censuses, ideally done every ten years, collecting a range of information on numbers of people, households, age, gender, education, employment, and religion. Between censuses population is tracked through registration, particularly of births and deaths. Demographers want to know, at a minimum, how many children are born, the fertility rate, death rate, and migration. Data collection may be problematic, especially in poorer countries where censuses are infrequent and it often takes several years for analysis and release of data. Smaller household surveys and the Demographic and Health Surveys referred to earlier provide additional and useful information. The lack of data is a constraint in understanding both current and future effects of AIDS.
The demographic consequences of AIDS are increased deaths, especially among those aged 20 to 49; rising infant and child mortality; falling life expectancy; changes in the population size, growth, and structure; and a growth in the numbers of orphans. How serious these impacts are will depend on the location, size, and age of the epidemic and the underlying demographics of a country. For example, in the USA, prior to ART, AIDS was the leading cause of mortality among young men. In Southern Africa, prevalence rates rose rapidly from 1992, but it was only in the early part of the 21st century that there was a measurable and significant rise in the number of illnesses and deaths, and this is still growing. The number of deaths in Uganda peaked in the 1990s but the country is dealing with one million orphans. Shrinking birth rates in Eastern Europe mean relatively small epidemics have disproportionate impacts here.
Although it is difficult to look far into the future, we can make predictions. In most countries we have a reasonably clear idea of the magnitude of the HIV epidemic (within a range). Even very resource-poor countries are able to predict illnesses and deaths, and in many countries this was done as part of planning for ART roll-out. We can predict demographic impacts and be realistically sure of what they will look like for ten years, and we can factor in treatment and develop scenarios.
At the root of the difficulties in understanding the effects of the epidemic are what we measure, and when and how we measure it. Demography looks at events: an AIDS death is an event. The proceeding period of illness, prolonged and debilitating for the individual, and costly and demoralizing for families, households, and communities, is part of a process and is not measured by demographers. Many impacts are felt after death, and there is evidence that AIDS deaths have more serious consequences for survivors than deaths from other causes. Most ‘post-death’ consequences are not measured by demography.
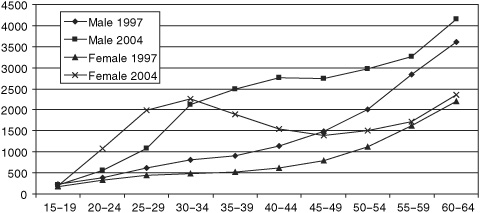
Increased deaths in younger adults are the most measurable effect of AIDS. This has been dramatically illustrated by data from South Africa, which has one of the best vital registration systems in the poor world. In 2001 the Medical Research Council released a report analysing the registered deaths reported to the Department of Home Affairs. This report was controversial but its findings were unequivocal. It showed the pattern of mortality had shifted from the old to the young, particularly to young women; there was differential mortality between men and women, which fitted with the pattern projected by AIDS models, and it concluded that the future burden of the epidemic was broadly predictable.
This changing mortality, with the most recent data, is shown in Figure 8. In 1997 the highest number of female deaths was in the 70 to 79 age group. Deaths among younger women increased until, by 2000, this figure was highest for women in their late 20s and early 30s, and continuing to rise. Among men the peak in ‘new’ mortality is slightly later, but with the same dramatic change in the pattern and number of deaths.
The cause of death is not ascribed: the graphs show only recorded numbers of deaths. This increased mortality simply should not be happening, especially in post-apartheid South Africa. Government policy, since the transition, has been to improve the lives of all, especially the poor and women. Health services have been expanded and are free to pregnant women and children. Water, sanitation, power, and housing are being provided; and there are a range of social grants available. South Africans, especially women, should be living longer and better lives. These graphs should sound a clarion call of warning as they show the effects of a devastating AIDS epidemic; instead they are ignored or explained away.
8. Total registered deaths by age and year of death, South Africa
The pattern of mortality shown in Figure 8 is found across high-prevalence countries, and has severe consequences for society. Those who die have received whatever education and training is available; many will be in the middle ranks of employment, gaining experience and skills. This is also when most people have had children.
Treatment not only reduces mortality but allows people to resume normal lives. Significant numbers of people need to access treatment before the figures at the population level will reflect gains. In 2002 the Actuarial Society of South Africa (ASSA) suggested that the national ART programme would only reduce the number of deaths from 495,000 to 381,000 per annum in 2010.
Infant and child mortality rises for two reasons. Firstly, children born to infected mothers have, in the absence of intervention, about a 30% chance of being infected. Prevention of mother-to-child transmission greatly reduces this, but those who are infected have poor life expectancy. About 25% of HIV-infected babies develop symptoms of AIDS or die within the first year. In the developed world, 70% of those infected at birth are alive at 6 years and 50% at 9 years, but in the poor world progression rates are faster. Treating children is a growing global priority.
Life expectancy is a single index describing the level of mortality in a given population at a particular time as measured in years of life. It is the age at which a person can expect to die. Currently, according to UNDP’s 2006 report, Japan has the longest life expectancy at 82 years; the lowest is Swaziland at just 31.3 years.
Infant mortality measures the number of children dying before age 1 per 1,000 live births. The lowest is 2, in Iceland; the highest is Sierra Leone’s 166. Child mortality measures the number of deaths in children under 5 per 1,000 live births and is therefore a better measure of the impact of AIDS. Sierra Leone has the highest child mortality at 283; the lowest is 3 in Singapore and Iceland (it is 6 in the UK and 8 in the USA). Reducing child mortality by two-thirds is a Millennium Development Goal.
Other important measures are the crude birth rate (CBR) and crude death rate (CDR) and the total fertility rate (TFR). The CBR and CDR are the total number of births and deaths respectively per 1,000 people per year. The TFR is the number of live births per woman in her reproductive life.
The dependency ratio is the ratio of the economically dependent part of the population (those too young or too old to work) to those who are productive. Generally, individuals under the age of 15 and over the age of 65 are considered to be dependent. The dependency ratio is given as a rate per 100.
The sex ratio is the number of males to females. At birth, it is usually 105 males to 100 females, though higher male mortality means there are more females than males among the elderly: in Germany, 70 men for every 100 women over 65.
The second reason for increased child deaths is mortality among infected mothers. Losing a mother for any reason has an adverse impact on child survival. A 2004 review of the demographic and socio-economic impact of AIDS, published by the journal AIDS, noted the death of a mother increased the chance of a child dying by three times in the year before the mother’s death and five times in the year after the death. Increased child mortality was not affected by the mother’s cause of death, but HIV-infected mothers are much more likely to die.
The most detailed projections of the likely effects of AIDS come from the US Bureau of the Census. Their 2004 report, The AIDS Pandemic in the 21st Century, produced country data ‘with AIDS’ and ‘without AIDS’. The figures are sobering.
In Botswana, in 2002 the crude death rate was estimated at 28.6 per 1,000, without AIDS it would have been a mere 4.8: by 2010, it may be as high as 42.8. For Tanzania, the 2002 figures are: without AIDS 12.1, with AIDS 17.3. Because Tanzania’s epidemic is more advanced, by 2010 the CDR may have fallen slightly to 17.1. In Guyana, the death rate in 2002 was 8.9, 2.3 above what it would have been without AIDS, and by 2010 it may be 13.2. The greatest increase in Asia is projected for Myanmar at 2.2 deaths per 1,000 above the non-AIDS level in 2010. For child mortality rates, the greatest increase is in Botswana: in 2002, the rate was estimated at 107.1, without AIDS it would have been only 30.6; by 2010, it is projected to be 122.9 instead of falling to 22.8. In Cambodia, AIDS is adding 7 deaths per 1,000 to child mortality, and in Haiti 10.5 deaths.
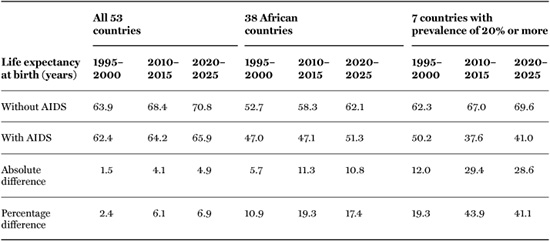
Demographers and international policy-makers agree that AIDS is knocking years off life expectancy, especially in Africa. In 2003, the UN Population Division looked at the impact of AIDS on 38 African, 5 Asian, 8 Latin American and Caribbean countries, the Russian Federation, and the USA. Data are not presented for individual countries, probably a ‘political’ decision as governments react adversely to being named when the news is bad. The data in Table 4 show that the impact of AIDS will amplify and be felt most strongly from 2010 to 2015. A sustained and expanded roll-out of treatment could change this.
The Bureau of the Census produced projections for individual countries. The impacts are expected to be dramatic. By 2010, life expectancy could be just 26.7 years in Botswana and 27.1 years in Mozambique. Access to therapy by sufficient numbers of people could change this. Worst affected outside Africa are Guyana, which is predicted to lose 14.3 years of life, and Cambodia, which will lose 4.2 years. The data don’t show what this catastrophic decline in life expectancy will actually mean for these societies. Will it affect societal ability to function? This issue is returned to in later chapters, but it is worth stressing we don’t know, because we have yet to experience such impacts and demographers do not think in terms of what these predictions mean for society at large.
Increased numbers of deaths reduce population size. Some 2.8 million people, mostly young adults, are dying from AIDS every year. In the worst affected countries the mortality is considerable: UNAIDS estimates that in 2005 South Africa had 320,000 deaths from AIDS, Nigeria 220,000, and Zimbabwe 180,000. The deaths are cumulative: by 2015, some 6 million South Africans may have died of AIDS – 13% of the population.
Population growth decreases through premature deaths; a reduction in fertility; and changing sexual behaviours. As the epidemic progresses there are fewer women of child-bearing age. HIV-positive women are less likely to conceive and carry the infant to term, thus further reducing the number of live births.
Table 4. Estimated and projected impact of HIV/AIDS on mortality indicators
The potential effects of behaviour change are considerable. Condoms may be used to protect against disease, but also have an impact on fertility. An increased age of sexual debut will reduce the total fertility rate.
In most countries, AIDS simply means the population will grow more slowly. In Thailand, growth is expected to be 1% per annum rather than 1.1%; in India and China, the impact will be negligible as the populations are so large and the epidemic is, relatively, so small. In other countries, AIDS will greatly reduce population growth. The Bureau of the Census estimated Botswana’s growth rate in 2002 was –0.2% per annum instead of 2.3%, and by 2010 it will be –2.1%. In South Africa, the growth rate is projected to be –1.4%, in Swaziland –0.4%, and in Lesotho and Mozambique –0.2%. Without AIDS these populations would be growing. The impact of this on the national psyche, economy, and social welfare system will be considerable. As yet there is no evidence that the impact is being thought through, and is an area requiring more research.
In Latin America and the Caribbean, the Bahamas and Guyana will see the greatest relative impact, with growth rates reduced from 1% to 0.5%. In Eastern Europe, the impact of AIDS will exacerbate an already troubling demographic situation, where there are very low total fertility rates and populations are declining. By 2030, the median age of the Russian population will be over 40, with half the population having been born before 2000. By 2015, there will be just four workers for every three non-workers, with a dramatic shift among the non-working-age population toward the elderly. AIDS is increasing mortality among the current 15- to 30-year-old age group, so that there will be fewer working-age people at a time when they are sorely needed.
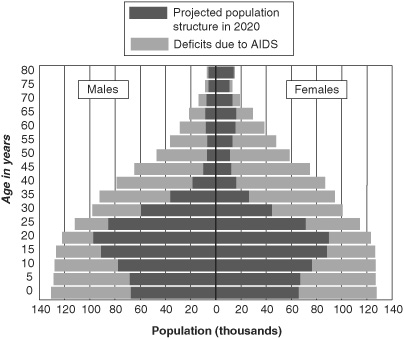
As Figure 3 showed, peak mortality is between 25 and 35 for women, and 30 and 45 for men. This alters the population structure and dependency ratios. An extreme change in population structure is shown in Figure 9 – a projected population pyramid for Botswana in 2020. The outer bars show the shape and size of the population in the absence of AIDS, the inner bars show what it could be. By 2020, instead of just under 60,000 women in the 40 to 50 age group there will be about 12,000. There will be half the children under 5 that there would have been in the absence of AIDS. While the gaps in the under-25 age group are a combination of mortality and births that did not occur, among the over-25 age group the changing pyramid is due to deaths.
9. Altered population structure due to HIV/AIDS, Botswana
The dependency rate will increase, placing demands on the government and society to provide education for the young, and health and social support care for both the young and the elderly. It adversely affects economic growth by depressing the national savings rate and reducing future domestic resources available for investment. The dependency rate in Zambia is 99 dependants for every 100 adults, in Uganda it is 112. An excellent example of the potential benefits of changing dependency comes from Ireland, where in 1970 the TFR was 3.9, but by 2006 it was estimated to have fallen to 1.86. The dramatic and sustained economic growth in Ireland, described as a ‘Celtic Tiger’, was in part due to the availability of resources which had previously been tied up in educating and supporting the large number of young people. Of course, ageing populations cause problems but these are different.
Conventional dependency ratio calculations assume most adults are productive, but in generalized AIDS epidemics a significant number are chronically sick and properly belong in the ‘dependants’ category, a factor that needs to be considered. There will also be changes in the gender balance. In heterosexually driven epidemics more women will die than men at younger ages. Over the next 20 years, in many countries, men between the ages of 35 and 54 will outnumber women. This may motivate men to seek sexual relationships with younger and younger women, increasing HIV infection rates, and leading to a vicious cycle of transmission operating for generations. The changing gender and age structure of populations and the consequences desperately need thought and research. As the epidemic bites, families are being held together by the elderly, especially the grandmothers.
As conventionally understood, an orphan is a child who has lost both parents, but the definition has changed, in large part due to AIDS. The current definition used by UNICEF, other international agencies, and most NGOs is that an orphan is a child under the age of 18 who has lost one or both parents. Maternal orphans have lost a mother, paternal orphans a father, and double orphans both parents.
Globally, orphan numbers were declining, and despite the AIDS epidemic this trend has been sustained in Asia, Latin America, and the Caribbean. However, in sub-Saharan Africa numbers of orphans have grown dramatically. AIDS orphans increased in number from fewer than one million in 1990 to 12 million in 2005. In 2003, 12.3% of all children in sub-Saharan Africa were orphans (in Asia it was 7.3% of children, and 6.2% in Latin America and the Caribbean).
Countries with high HIV prevalence levels or recent armed conflict have the most orphans. Botswana has the peak rate of orphaning in sub-Saharan Africa, with 20% of its children orphaned. South Africa has the largest total number, an estimated 1.2 million AIDS orphans. Beyond Africa, the highest level of orphaning is in Haiti, where 15% of children are in this situation.
The number of orphans will increase. UNICEF estimates that by 2010, globally, there will be 142 million orphans, of whom 50 million will be in sub-Saharan Africa, and here 18.4 million or 36.8% will be due to AIDS. There is no estimate of AIDS orphaning in the other regions. Ugandan data show orphaning peaks some 15 years after prevalence, which means that in many countries we will not see the crest of the orphan wave until after 2020.
There are limits to what demography shows us. Children orphaned by AIDS have different experiences and bear additional burdens to those orphaned by other causes. The death of a parent is preceded by prolonged illness. If one parent is infected, there is a probability that the other parent is infected and both will die: double orphans are more disadvantaged than single orphans. When orphans are taken in by grandparents (usually grandmothers), they face the prospect of losing elderly caregivers too, effectively a repeat orphaning. Research gives us numbers, but the psychological impact is still to be assessed.