Chapter 8
Risk analysis process for an offshore installation
A risk analysis is to be carried out for an offshore installation. The installation is part of a so-called production complex, that is, bridge-linked installations. The installation in question is a production platform. The scope of the case is a significant modification of the installation, implying adding new production equipment, which will have an impact on the risk level. New equipment units will imply additional potential leak sources, with respect to gas and/or oil leaks, which may cause fire and/or explosion, if ignited. The decision to be made is whether or not to install additional fire protection for the personnel in order to reduce the consequences in the event of fires on the installation.
The installation has been designed with rather limited protection of personnel during the use of escape ways against fire and explosion effects. The installation has an important function at the field as the only installation to process oil and gas from the field. The operation is expected to continue for the next 20 years. The example is based on Aven (2008).
8.1 Planning
8.1.1 Problem definition
Following a review of the problem, it was quickly evident that one was faced with three alternatives:
- 1. Minor improvement in order to compensate for increased risk due to new equipment, but no further risk reduction.
- 2. Installation of protective shielding on existing escape ways together with overpressure protection in order to avoid smoke ingress into the enclosed escape ways.
- 3. Do nothing, accept situation as is.
The objective of the risk analysis is to provide a basis for selecting an alternative. This basis consists of a risk description and associated evaluation. The description covers  , using the notation from Chapter 2. The analysis group will identify hazards
  , express uncertainty using probabilities
  and describe the (strength) of the background knowledge
  .
.
The work is carried out by a group of risk analysts. The group has in-depth competence within the fields of fire and explosion.
8.1.2 Selection of analysis method
A model-based analysis is used in this case. The problem to be addressed is considered important by both the management and employees, and in order to provide a good basis for the decision to be made, a thorough and detailed analysis providing an informative risk picture is necessary.
The analysis places emphasis on both qualitative and quantitative aspects and will form part of an As Low As Reasonably Practicable (ALARP) process.
8.2 Risk analysis
8.2.1 Hazard identification
The analysis focuses on hydrocarbon leakages.
8.2.2 Cause analysis
What does it take for a leakage to occur? An extensive body of statistics is available on leakages on offshore installations, and this also gives a picture of the most important causes of leakage. A significant proportion of the leakages are linked to manual operations. An example of a cause analysis for such an operation is shown in Figure 8.1. The initiating event is ‘a valve in the wrong position after maintenance’. To analyse the actual barriers, a fault tree is constructed as illustrated in Figure 8.2.
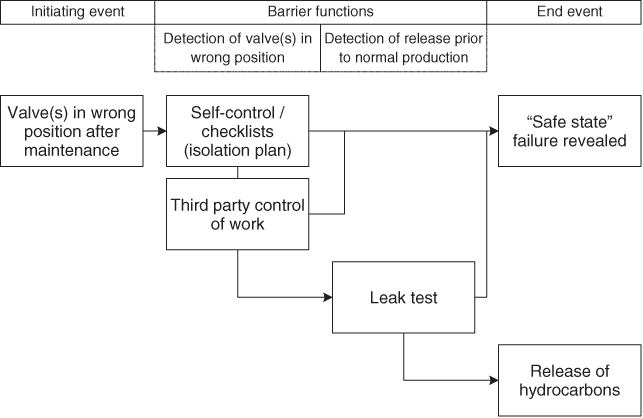
Figure 8.1 Barrier block diagram.
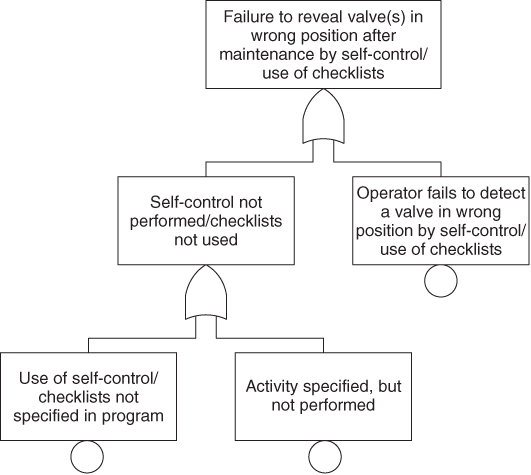
Figure 8.2 Fault tree for failure of a barrier.
The probabilities for the events in these diagrams are affected by a set of risk-influencing factors and influence diagrams (Bayesian networks) can be used to show these effects. An example for the basic event ‘operator does not detect the valve to be in a wrong position during self-control/use of checklist’ is shown in Figure 8.3.
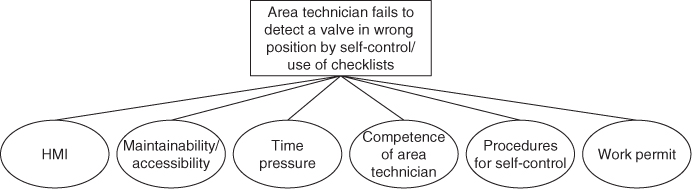
Figure 8.3 Example of influence diagram. HMI: Human Machine Interface.
In addition to historical records for the performance of barrier elements and systems, such as the reliability of the gas and fire detection systems, and specific studies of scenarios such as those above, the cause analysis includes
- measurements and assessments of the condition of various systems and equipment;
- results from accident investigations and reports;
- assessment of the performance of important barriers; and
- interviews with persons in central positions with respect to management, maintenance and safety.
From this analysis, it was concluded that the most important safety challenges were
- increased accident risk as a result of the modification;
- deterioration of critical equipment, causing need for substantial maintenance.
Next comes the quantification. How likely is it that leakages will occur? We distinguish between four categories of leakages that are dependent on leakage rate: minor ( kg/s), medium (
 kg/s), large (
 kg/s) and very large (
 kg/s). The leakage statistics and risk analysis conducted previously provides a basis for answering this question. But, what are the relevant data? We have a historical record for the actual installation, but relatively few events. We therefore include data from other offshore installations as well. This extends the basis for determining the probability
  that a leakage will occur next year. Crude categories are used:
  %,
%,  %,
%,  %,
%,  % and
% and  %. This means, for example, that for the second category, we would predict 1–5 such events in the course of 10 years. If the probabilities are high enough (typically >0.5), then they can be replaced by frequencies.
These basic probabilities are then examined in the light of specific knowledge available. Are there factors indicating that these figures should be modified? In our case, equipment deterioration was identified as a problem, but the probabilities were not adjusted. Instead, an assumption was made that a comprehensive maintenance programme will be carried out.
The effect of the modification was assessed and the relevant probabilities adjusted. An example of a probability that was quantified is: increased probability of 5% for leakage in category medium.
8.2.3 Consequence analysis
If a leakage should occur, various consequences could result. The event development is analysed with the aid of an event tree. An example is shown in Figure 8.4.
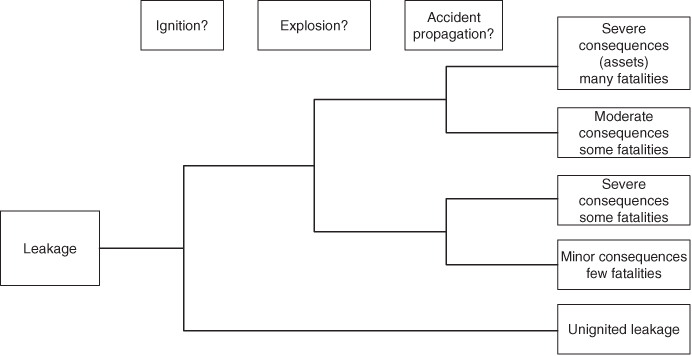
Figure 8.4 Accident development modelled using an event tree.
The analysis addresses the main barrier functions:
- Prevent ignition
- Reduce cloud/emissions
- Prevent escalation
- Prevent fatalities.
Specific studies are carried out for these barrier functions analogous, in principle, to the barrier function ‘prevent loss of containment (leakage)’. We write ‘analogous, in principle’ because, in practice, there are differences in the methodology. The database is, naturally, significantly smaller for barriers after leakage has occurred, so there is a greater need for modelling and analysis of these barriers.
A set of scenarios are defined, and for these consequences, calculations are carried out providing insights about, for example, initial release rates and development of the discharge concentration (when and where we could get a combustible mixture). From these studies and the analysis group's general risk analysis experience, the uncertainties related to releases and consequences are assessed. The assessments are based on all relevant information, including the identified poor performance of some of the safety barriers and the equipment deterioration problem. The consecutive assigned probabilities and expected values represent the analyst group's best judgements, based on the available information and knowledge ( ).
).
In addition to the probability of leakage, we are especially interested in the probability that an ignited leakage, that is, a fire or an explosion, will occur. Next, focus will be placed on the probability of accident spreading and potential injuries and fatalities.
Let  represent the number of fatalities. In the analysis, the probability of a fatal accident, that is,
  , and the conditional expected number of fatalities in a leakage or fire scenario, that is,
 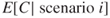 , are expressed. Risk is quantitatively described based on the pair:
 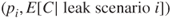 and
and  ,
,  . Here,
  and
and  equal the probability of occurrence of the leak scenario
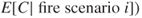
  and fire scenario
  , respectively. An example is shown in Figure 8.5.
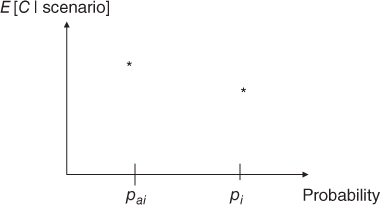
Figure 8.5 Risk description showing the probability of occurrence of two scenarios and the associated expected number of fatalities.
The effect of the modification was analysed, and the relevant probabilities updated. Also, the effect of implementing fire protection for the evacuation routes was analysed. Examples of probabilities quantified are given as follows:
- Modification
- – Increased probability of ignited leakage: 5%
- – Increased Potential Loss of Life (PLL): 5%
- – Increased IR: 10% for a specific personnel group.
- Effect of implementing fire protection for the evacuation routes
- – Reduced probability of fatalities
 : 30%
: 30% - – Reduced PLL: 30%
- – Reduced IR: 50% for specific personnel groups.
- – Reduced probability of fatalities
Uncertainty (knowledge) assessments
- Equipment deterioration and maintenance: The deterioration of critical equipment is assumed not to cause safety problems by implementing a special maintenance programme. However, experience gained on offshore installations indicates that unexpected problems do occur. Production of oil over time leads to changes in operating conditions, such as increased production of water,
 and
and  content, scaling, bacterial growth and emulsions; problems that, to a large extent, need to be solved by the addition of chemicals. These are all factors causing increased probability of corrosion, material brittleness and other conditions that may cause leakages. The quantitative analysis has not taken into account that surprises might occur. The analysis group is concerned about this uncertainty factor, and it is reported along with the quantitative analysis.
 - Barrier performance: The historical records show poor performance of a set of critical safety barrier elements, in particular, for some types of safety valves. The assignments of the expected number of fatalities given a leakage or a fire scenario were based on average conditions for the safety barriers and adjustments were made to reflect the historical records. However, the changes made were small. The poor performance of the barrier elements would not necessarily result in significant reduced probabilities of barrier system failures, as most of the barrier elements are not safety critical elements. The barrier systems are designed with a lot of redundancies. Nonetheless, this problem causes concern, as the poor performance may indicate that there is an underlying problem of operational and maintenance character, which results in reduced availability of the safety barriers in a hazardous situation. There are a number of dependencies among elements in these systems, and the risk analysis methods for studying these are simplified with strong limitations. Hence, there is also an uncertainty aspect related to the barrier performance.
Based on these and some other judgements, the strength of knowledge supporting the quantitative analysis is given a medium score.
8.3 Risk picture and comparison of alternatives
The results from the analysis are summarised in Tables 8.1 and 8.2. The investment cost for the fire protection is  5 million. Can this extra cost be justified?
Table 8.1 Result summary for the risk analysis. Overall assessments of modification and measures
| Modification | The resultant fire risk is not deemed to present any great problem, the risk increases by 5% |
| Fire protection implemented | Relative large improvements in risks (30%) Reduced IR by 50% for specific personnel group |
Table 8.2 Result summary for the risk analysis. Uncertainty factors
| Uncertainty factors | Minor problem | Significant problem | Serious problem |
| Deterioration of equipment | x | ||
| Barrier performance | x |
To determine the appropriate category in Table 8.2, the two-stage procedure outlined in Chapter 2 was used. To obtain a high score (significant or serious), the factor must be judged as important for the risk indices considered and the factor must be subject to large uncertainties.
The expected reduced number of fatalities is rather small, and hence, the expected cost per expected number of saved lives (the implied value of a statistical life) would give a rather high number, and a traditional cost–benefit (cost-effectiveness) criterion would not justify the measure. Say that the assigned expected reduced number of fatalities is 0.1. Then, we obtain an implied value of a statistical life equal to  million. If this number is considered in isolation, in a quantitative context, it would normally be considered too high to justify the implementation of the measure.
But, the risk management perspective here is broader. The objective of investing in the measure is to reduce risk and uncertainty, and the traditional cost–benefit analysis (cost-effectiveness analysis) does not reflect these concerns in a satisfactory way. The sensitivity analysis shows that changes in the key assumptions and numerical values can result in a much lower figure for an implied statistical life. However, the argumentation should not be based only on this type of analysis. The important question is how we weigh the uncertainties. Uncertainty in phenomena and processes justifies investments in safety measures.
8.4 Management review and judgement
So, what will be the conclusion? Should fire protection be installed? This depends on the attitude of management towards risk and uncertainties. The analysis does not provide a clear answer. If management places emphasis on the cautionary principle, then the investment in fire protection can be justified, despite the fact that a traditional cost–benefit consideration indicates that the measure cannot be justified.
Reflection
How does this example show that it is necessary to look beyond the calculated probabilities?
The probabilities are conditioned on certain factors, and thus, considerable uncertainty can be hidden. It is assumed, for example, that the maintenance effort will be so effective that the equipment deterioration will not present any significantproblem.
- Aven, T. (2008) A semi-quantitative approach to risk analysis, as an alternative to QRAs. Reliability Engineering & System Safety, 93, 768–775.