Why alcohol abuse and debt are more common in New Hampshire and Connecticut than in Indiana and Tennessee, but discrimination rates are much higher in the latter two states.
In November 2016, the U.S. presidential election shocked the world. Billionaire real-estate developer, businessman, and former reality TV star Donald Trump defeated Hillary Clinton, an attorney and former secretary of state, senator, and first lady, in a caustic race that virtually every poll had projected Clinton to win. The contest took America’s state of polarization—already severe—to DEFCON 1. Exit poll data on Election Day showed tremendous divisions across class, race, gender, age, education, income, and religion on issues such as foreign policy and immigration. Pew Research found that half of Democrats and Republicans said they were literally “afraid” of the members of the other party. While millions of Americans couldn’t fathom the idea of a Trump presidency, millions of others were horrified by the notion of a Clinton presidency. Trump supporters regularly chanted, “Lock her up!” at rallies; Clinton backers swore they’d move abroad if Trump were elected. Both candidates ultimately engendered unprecedented levels of dislike that shattered the illusion of a “united” fifty states.
Why are Americans so divided? For decades, political analysts, pundits, and academics have grappled with understanding America’s schisms. Back in 1992, during his presidential campaign, conservative firebrand Pat Buchanan likened America’s irreconcilable disunity to a “culture war” between conservatives and progressives. Others have nominated a number of possible root causes of America’s fissures: urban versus rural, red versus blue, believers versus nonbelievers, universalists versus multiculturalists, populists versus elites, and so on. While all provide valuable insight and partial explanations, none gives the full picture or describes exactly why these divides exist in the first place.
Tight-loose is a key substructure for many of these tensions. This simple principle allows us to grasp the immense complexity of America’s deep cultural divisions. Moreover, it shows us where these differences come from—tracing them back to the founding conditions and ecology of the fifty states that persist to this day. Tightness-looseness can also explain a swath of differences between American states that previously seemed unconnected. The tight-loose divide reveals, for example:
Why alcohol abuse and debt are more common in New Hampshire and Connecticut than in Indiana and Tennessee, but discrimination rates are much higher in the latter two states.
Why Oregon and Vermont show high levels of creativity but also high levels of divorce and mobility, whereas Kentucky and North Dakota show the opposite pattern.
Why people in Colorado and New York score high on trait openness but low on trait conscientiousness, while people in Kansas and Alabama show the reverse personality profile.
Why Arizona is more anti-immigration than New York, even though both states have roughly the same population of illegal immigrants.
Why the startling outcome of the 2016 presidential election has more to do with cultural forces than a mesmerizing personality.
As a nation of immigrants, the United States was predisposed to be a relatively loose nation. The very definition of a melting pot, America was formed by a motley collection of immigrants, united only by their sense of adventure, independent spirit, and thirst for freedom. Separated from other continents by two oceans, the country has faced little threat of invasion throughout its history and is blessed with abundant natural resources. Consequently, the United States has generally enjoyed the luxury of permissive rules and relaxed punishments.
Yet within the context of this general looseness, forces of tightness have surfaced throughout American history. To quantify levels of tight-loose across the fifty states, Jesse Harrington and I scoured research institutes and the Smithsonian archives for data on each state going back to the early 1800s, including records on punishment methods, state restrictions, cultural practices, and ecological and historical events. The patterns we discovered (which were published in the Proceedings of the National Academy of Sciences) were illuminating.
Take, for example, differences in the harshness of punishments across states. Compared with Alaska and Maine, Indiana and Texas spank far more students, execute more criminals, and punish marijuana possession more harshly. In 2011 alone, over twenty-eight thousand students were paddled or spanked in Texas schools. Meanwhile, in some public schools in Indiana, students must obey strict dress codes—no T-shirts, denim pants, or untucked shirts—or risk facing suspension.
Other states follow this “rule making” pattern: Sex toys have been criminalized in Alabama since 1998, tattoos were banned in Oklahoma in 1963 (and only legalized in 2006), and in Mississippi, you can be fined up to a hundred dollars for swearing in public. Kentucky and Utah have many more dry counties and more marriage restrictions relative to California and Hawaii. And just as some nations exhibit very little diversity within their borders, the same is true of some of the fifty states. Going as far back as 1860, states such as Montana, North Dakota, and West Virginia have had a much lower foreign population relative to places like Nevada, New Jersey, and California.
These differences aren’t isolated trends. In fact, our research shows that these indicators all hang together. In states where children are more likely to be hit in school, there are higher rates of executions, more restrictions on alcohol, sterner views of marriage, fewer foreigners, and so on. These states are stricter—they’re tight, rule makers. Meanwhile, states with more lenient punishments also have fewer restrictions on alcohol and marriage and have more foreigners. These states have more latitude—they’re loose, rule breakers.
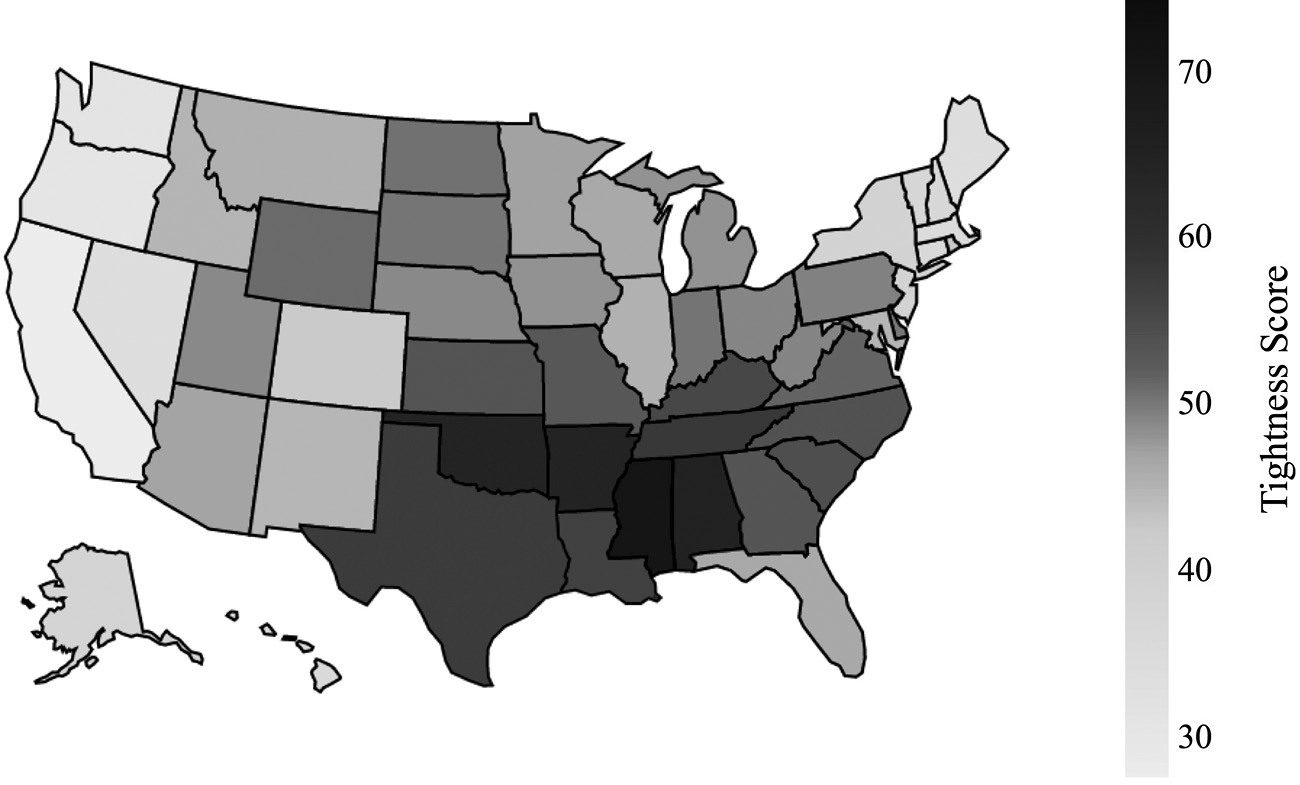
Figure 5.1 shows the tight-loose map of the United States. Some of the tightest states in the country include Mississippi, Alabama, Arkansas, Oklahoma, Tennessee, and Texas. At the looser end of the spectrum are California, Oregon, Washington, Nevada, Maine, and Massachusetts. Delaware, Iowa, Idaho, Nebraska, Florida, and Minnesota fall in the middle. From these rankings, regional patterns emerge: The South is tightest, the West and Northeast are loosest, and the Midwest is in the middle. You can see each state’s tight-loose score in Table 5.1.
As with the global map, tightness-looseness provides a new way of understanding the culture within the United States. Levels of tightness-looseness in the fifty states are distinct from whether states are collectivist (emphasize family ties) or individualist (emphasize self-reliance). In fact, states fall into each of the four quadrants—collectivist and tight (Texas), collectivist and loose (Hawaii), individualist and loose (Vermont), and individualist and tight (Kansas). Likewise, while there are connections between tightness and conservatism, on the one hand, and looseness and liberalism, on the other, the concepts are distinct. Conservatism reflects individuals’ emphasis on traditional values and often manifests as resistance to change, whereas tightness is a state of culture that reflects the strength of social norms in one’s environment. While tight states and countries have more conservatives and loose states and countries have more liberals, there are plenty of conservatives in loose regions and plenty of liberals in tight ones.
In fact, we’ve gotten so accustomed to referring to U.S. states as “red” and “blue” that we’ve forgotten how superficial this label is to a state’s identity. Take three states that voted for Hillary Clinton in the 2016 presidential election: Hawaii, Illinois, and Virginia. Hawaii is loose, Illinois is fairly balanced, and Virginia is tight. Now take three states that voted for Donald Trump: Alaska, Wisconsin, and South Carolina. Alaska is loose, Wisconsin is fairly balanced, and South Carolina is tight. As we’ll see, the cultural differences between these voting allies are massive; sorting them by partisan leaning can badly distort their deeper identities. When we color America’s map with shades of tight and loose instead of Republican red and Democratic blue, we start to see the hidden cultural logic behind—and the trade-offs involved with—the fifty states’ distinctions and idiosyncrasies.
Rank |
State |
Tightness Score |
1 |
Mississippi |
78.86 |
2 |
Alabama |
75.45 |
3 |
Arkansas |
75.03 |
4 |
Oklahoma |
75.03 |
5 |
Tennessee |
68.81 |
6 |
Texas |
67.54 |
7 |
Louisiana |
65.88 |
8 |
Kentucky |
63.91 |
9 |
South Carolina |
61.39 |
10 |
North Carolina |
60.67 |
11 |
Kansas |
60.36 |
12 |
Georgia |
60.26 |
13 |
Missouri |
59.60 |
14 |
Virginia |
57.37 |
15 |
Indiana |
54.57 |
16 |
Pennsylvania |
52.75 |
17 |
West Virginia |
52.48 |
18 |
Ohio |
52.30 |
19 |
Wyoming |
51.94 |
20 |
North Dakota |
51.44 |
21 |
South Dakota |
51.14 |
22 |
Delaware |
51.02 |
23 |
Utah |
49.69 |
24 |
Nebraska |
49.65 |
25 |
Florida |
49.28 |
26 |
Iowa |
49.02 |
27 |
Michigan |
48.93 |
28 |
Minnesota |
47.84 |
29 |
Arizona |
47.56 |
30 |
Wisconsin |
46.91 |
31 |
Montana |
46.11 |
32 |
Illinois |
45.95 |
33 |
Idaho |
45.50 |
34 |
Maryland |
45.50 |
35 |
New Mexico |
45.43 |
36 |
Rhode Island |
43.23 |
37 |
Colorado |
42.92 |
38 |
New Jersey |
39.48 |
39 |
New York |
39.42 |
40 |
Alaska |
38.43 |
41 |
Vermont |
37.23 |
42 |
New Hampshire |
36.97 |
43 |
Hawaii |
36.49 |
44 |
Connecticut |
36.37 |
45 |
Massachusetts |
35.12 |
46 |
Maine |
34.00 |
47 |
Nevada |
33.61 |
48 |
Washington |
31.06 |
49 |
Oregon |
30.07 |
50 |
California |
27.37 |
I’m a native New Yorker, but I’ve lived in Washington, D.C., for twenty years. When I visit my hometown of New York, I’m immediately in sync with the chaotic pace, the public cursing and displays of affection, and the way people dash across red lights—even with kids in tow. But this state of mind can get me into trouble when I visit other states. In Kansas, if I venture into the street before the light turns, I hear grumbling behind me. When I take my kids skiing in tidy Park City, Utah, I’m hard pressed to find anyone cursing or losing their temper, and if I order a glass of wine in a restaurant, I’ll also have to order food, according to Utah liquor laws. And in the South, where the politeness and friendliness I encounter blow me away, I have to control my natural “You talkin’ to me?” New York response. It sometimes seems like people in some states are from Mars and others are from Venus.
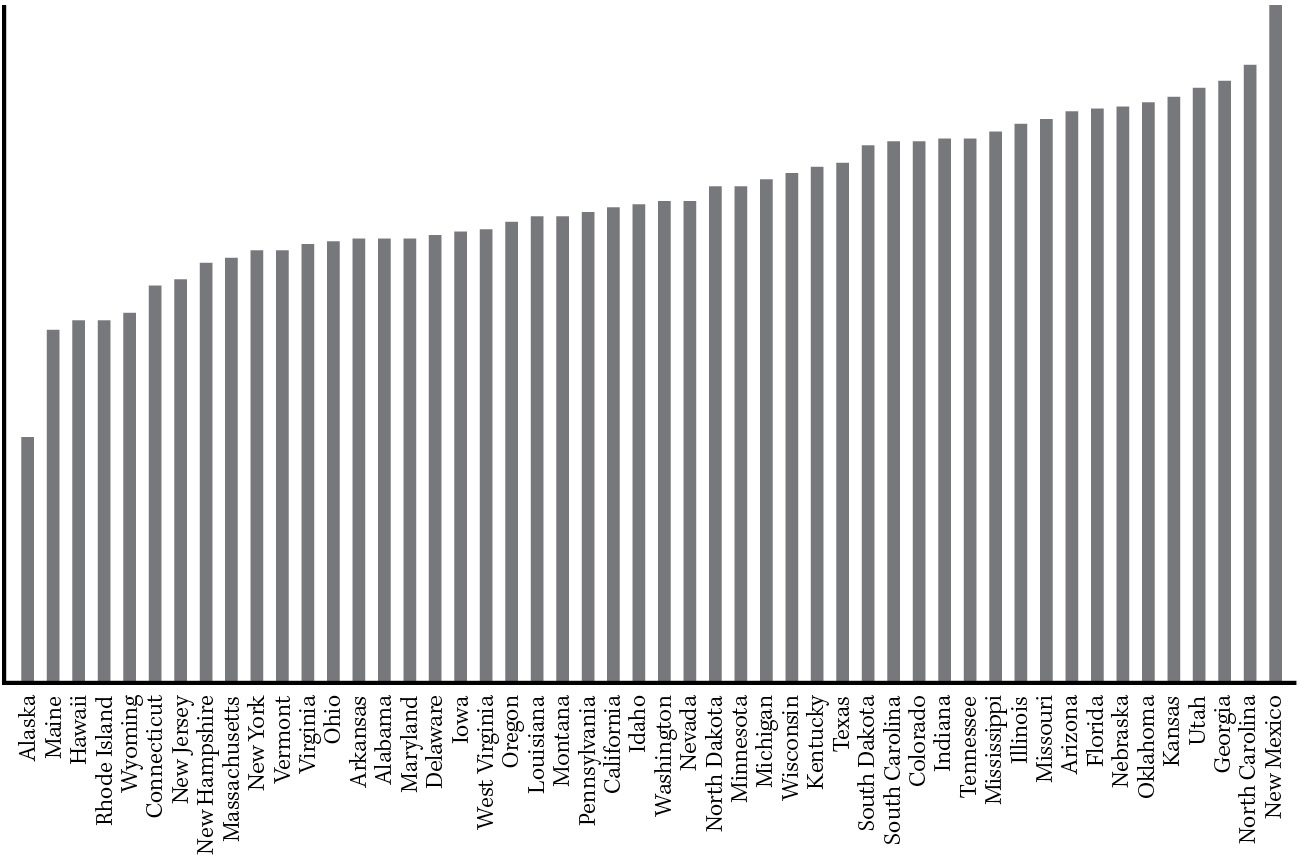
I often assumed that people in different states have different personalities, but is that true? It wasn’t just my intuition: Analyzing data from over a half million citizens, I found that the same personality profiles found in tight and loose nations are also detectable in tight and loose states. People in tight states are more likely to have a personality trait that psychologists call “conscientiousness,” which entails self-discipline, rule following, and the desire for structure. These people report being more organized, careful, and dependable, and agree with statements such as “I see myself as someone who is a reliable worker,” as someone who “makes plans and follows through with them,” and as someone who “does things efficiently.” By contrast, people in loose states report having less conscientiousness. More disorderly and less reliable (and honest enough to be self-critical!), they’re more likely to agree that they can be “somewhat careless,” “disorganized,” and “easily distracted.” It’s true: If you spend time in states like North Carolina, Georgia, Utah, and Kansas, you’ll generally find people who are more cautious, thorough, and orderly relative to people in loose states like Alaska, Maine, Hawaii, and Rhode Island, as shown below (New Mexico, a generally loose state, is an exception).
Beyond the individual discipline that shows up in tight state personality profiles, there is, in fact, also greater social order in these states. In the South, home to the tightest U.S. states, strong rules about etiquette, hospitality, formality, and, above all, respect prevail. Children learn to say “yes, ma’am” and “yes, sir” to adults and not to interrupt them. According to the Encyclopedia of Southern Culture (yes, such a text exists, in over twenty volumes), Southern lore warns children of the misfortunes that will afflict them if they forget their manners. For example, a young man who takes the last piece of food at the dinner table is told that he will never find a wife, and children who sing while they eat are warned that they will suffer from bad luck. For kids and grown-ups alike, proper behavior is an unstated requirement. Cursing is frowned upon. It’s “ladies first” when it comes to entering buildings, receiving food or drinks, and getting on and off elevators. Modesty is the norm. If you seem a little too proud of yourself, the average Southerner might think you’re “too big for your britches.” Proper attire is also mandatory. Even at football games, it’s not unusual to see Southern women in pearls and fancy dresses, or men in khakis and blazers.
To a Southerner, rude behavior can be a violation of honor—and one that demands strong punishment. In fact, psychologist Dov Cohen at the University of Illinois showed with hormonal measures that insults literally get under the skin of Southerners. In his experiments, research assistants were trained to insult Northern and Southern men in the laboratory (by calling them names like “you asshole”). Southerners reacted with a higher rise in cortisol, a hormone that indexes stress, as well as testosterone, a hormone that primes aggression in response to threat. It’s no small wonder that people in the South try to avoid this kind of rude behavior in the first place.
As a New Yorker, I learned the hard way about the risks of insulting others in the tight South. In the mid-1990s, I was driving with my then boyfriend, now husband, on Interstate 95 in South Carolina. A car with a local license plate turned into our lane and slowed down right in front of us. Todd slammed the brakes, then passed the driver on the left, casually making an obscene gesture with the middle finger of his right hand. The driver proceeded to chase us down the highway for several miles, until Todd, noticing a rest stop, quickly crossed the grass median to escape. Much to our dismay, the driver followed us off the highway. At the rest stop, he pulled up to us, got out of his car, swore at us, and demanded an apology. At my urging, Todd eventually ceded to this demand, and we left the scene with a huge sigh of relief.
How could one minor gesture escalate into such a dangerous situation? To New Yorkers like me, showing that middle digit may be rude (okay, it is rude), but it isn’t unusual. In fact, the Village Voice noted that New Yorkers are known for their “flamboyant, bird-flipping spirit.” Everyday rudeness is not unusual, either. We New Yorkers take it in stride when people cut in line, bump into one another without apology, and shout on the street. New Yorkers speak so loudly that Amtrak now has quiet cars on most of its Northeast trains. Nevertheless, enforcement remains daunting: “The boorishness of noise polluters on these trains with their cellphones and their beeping musical computers is astonishing,” commuter Alan M. Lieberman complained in the New York Times. New Yorkers’ impudent behavior may well be exacerbated by the fact that rudeness is contagious. Psychologist Trevor Foulk and his collaborators from the University of Florida showed that if someone is rude to you, or even if you merely observe others being rude, you’re more likely to behave rudely as well.
Rude behavior may be the normal M.O. in New York, but in our defense, we’re not the only ones. The website TheTopTens polled thousands of site visitors on which U.S. states were the rudest. Their results were telling: Across the board, loose states ranked much ruder than tight states. New York was listed first as the “Most Rude,” followed by Massachusetts and New Jersey. The least rude states leaned tight, such as North Carolina, Arkansas, and Wyoming.
Individuals’ self-discipline in tight states extends far beyond how aggressively we act toward others. Like tight nations, residents of tight states are much better at regulating their behavior. For example, credit data I analyzed from TransUnion shows that residents of loose states are saddled with more debt than tight states, whether they have difficulty paying back their vehicle or education loans, managing their credit card debt, or paying their medical and utility bills in a timely manner. Drug use and binge drinking per capita are also lower in tight states like West Virginia, Mississippi, and Utah relative to loose states such as Rhode Island, Colorado, and New Hampshire (with the recent exception of opioids). By contrast, loose states have some of the most permissive attitudes around alcohol and psychoactive substances. Recreational marijuana use is now legal in nine states, all of them loose: Alaska, California, Colorado, Maine, Massachusetts, Oregon, Washington, Vermont, and Nevada. California has been nicknamed “America’s cannabis bucket”; many marijuana entrepreneurs grow the plant large-scale on open farmlands. And in Washington, Colorado, and Idaho, “419.99” mile markers on roads had to replace ones that read “420” because the signs kept getting stolen by pranksters on National Weed Day (April 20)!
At the national level, social norms are strongly enforced through a high degree of monitoring—whether from neighbors, police, or even reminders of the Almighty, all of which make people feel accountable for their behavior.
The same is true at the state level. States such as Mississippi, South Dakota, and Alabama have a higher percentage of rural areas and lower rates of mobility, compared to loose states such as California, New Jersey, and Nevada. More rurality and less mobility produce an interesting cultural cocktail: You can bet that outside your home, neighbors and acquaintances know what you’re doing, and they may have strong opinions about it. In these small, tight-knit communities, the neighborhood watch is on full alert. According to Southern Living, people in small towns often know whom every teenager is dating, which neighbors just made a large purchase, and even when the town mechanic has hired a new guy. The gossip mill, it turns out, has important social functions. For millennia, it has promoted cultural learning: Through gossip, we learn “how to behave—what to do and what not to do,” according to psychologist Eric Foster. Gossip also serves as an informal policing mechanism. In towns where negative reputations can spread overnight, the fear of being bad-mouthed can help to deter bad behavior and promote cooperation.
Back-fence chatter is not the only social force patrolling tight communities. We’ve found that tight states tend to have more police and law enforcement officials, and citizens generally agree that the police should use strict punishment—including force—to keep the social order. Tight states also incarcerate a greater percentage of their populations. By contrast, in the urban and highly mobile areas common to loose states, you might pass thousands of strangers on your daily commute and find yourself living in relative anonymity, with little neighborly supervision. Other indicators of social disorder—such as higher divorce, single-parent households, and even homelessness—are higher in loose states.
In addition to cops or neighbors keeping community members in check, the supernatural has an undeniable and massive influence on tight states. Among Americans in tight states there is a remarkably high percentage of religious believers—80 percent in Kansas, for example. In Mississippi and South Carolina, among the most religious states in America, 83 percent and 78 percent of adults, respectively, are Christian. “Megachurches” with huge congregations of over two thousand people are found throughout the South (Lakewood Church in Houston tops them all, with more than fifty thousand attendees coming to worship each week), and Christian doctrine often leaks into public schools as well. In Texas, public school students can enroll in elective courses that teach morality lessons directly from the Bible. And since 1995, South Carolina has directed all public schools to provide a mandatory minute of silence every morning during which children pray.
Similarly, in Utah, over 60 percent of the population are Mormon, and strict regulations abound in their daily lives. Tea and coffee are banned at all times. Premarital sex is forbidden, as are pornography, masturbation, and homosexual acts. Sabbath Sunday is reserved for worship; working, shopping, eating out, playing sports, or other activities that may involve worldly temptations are not permitted. Bishops privately interview every adult Mormon to assess how well they’ve been adhering to the Mormon way of life and whether they’re worthy of entering the temple. Much like an intelligence-gathering agency, the Mormon Church’s Strengthening Church Members Committee (SCMC) keeps tabs on local Mormons to identify those who may be publicly criticizing the faith or its leadership. When it does, the SCMC promptly notifies the dissenter’s bishop, who may charge the member with apostasy—the abandonment of religious faith.
It follows that tight states also uphold specific moral beliefs that reinforce their commitment to cultivating a norm-abiding culture. In his seminal book The Righteous Mind, social psychologist Jonathan Haidt discovered five foundational moral beliefs: harm to others, fairness, in-group loyalty, authority, and purity. Culture is a prime driver of differences in these moral foundations. Tight states defer to authorities more and have greater in-group loyalty than loose states. They are also more likely to aspire to a noble and pure lifestyle—or “a morality of purity.” Purity means treating your body as a temple to be guarded from indecency—for example, by refraining from drug use and premarital sex (which—fun fact—is still illegal in Georgia, at least on the books). In contrast, in ultra-loose San Francisco, cars have been known to sport bumper stickers that read “Your Body’s a Temple | Mine’s an Amusement Park.” People in tight states also report that they take a black-and-white view of what is right and wrong, while those in loose states see more shades of gray.
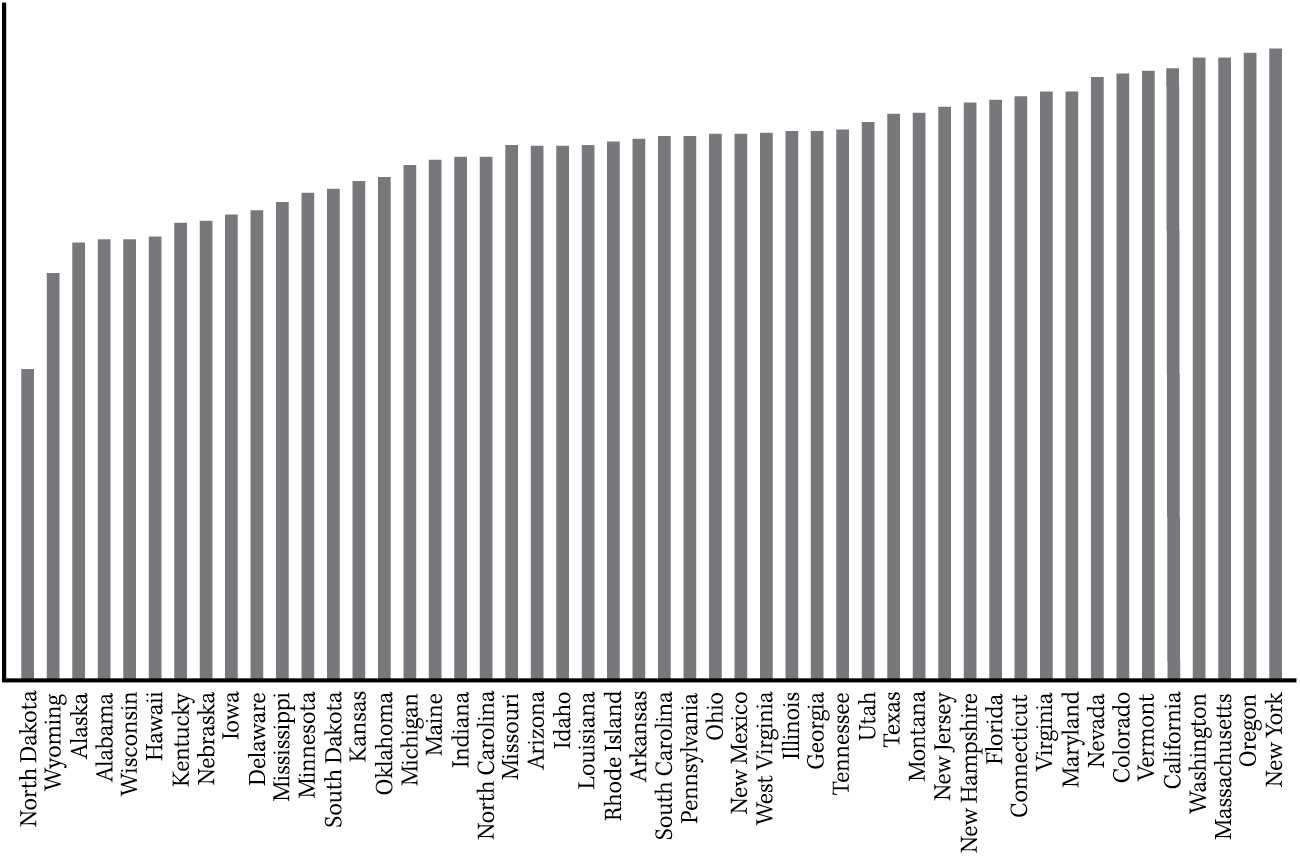
Despite their relative lack of order and self-regulation problems, loose states, like loose nations, bring their own suite of advantages: openness, creativity, and adaptability. Using survey data we accessed from personality profiles of over half a million U.S. citizens, we found that people in loose states are more likely to view themselves as original, curious, deep thinkers, and imaginative—all indications of what is called “trait openness,” as seen below.
No wonder, then, that the loose states are hotbeds of innovation. For starters, they generate far more patents for new inventions per capita, as seen in Figure 5.4. The first laser was built in California; the first portable fax machine and microwave oven were invented in Massachusetts; the first email was sent by a New Yorker; and the first washing machine was patented in New Hampshire—all loose states. Even the beloved game of Frisbee is a loose-state invention: The inspiration for the game came when Yale students started throwing around pie tins manufactured by Bridgeport, Connecticut’s Frisbie Pie Company in 1871.
You’ll also find that more creative types—including artists, painters, writers, and illustrators—per capita live in loose states. And people in loose states also seek out more creative experiences: They’re far more likely to attend cultural events, read poetry and fiction, and watch or listen to arts programming at home. Their wider exposure to creative ideas surely promotes even greater openness and curiosity.
Along these lines, have you ever wondered which states are the most fun? Data analysts at WalletHub, a website that provides personal financing assistance, were determined to find out. They scored each of the fifty states on the strength of their recreational options (including amusement parks, movie theaters, beaches, and national parks) and nightlife (bars, music festivals, casinos, etc.). It turns out the expression “Let loose and have fun!” is backed up by science. The most fun states are among the loosest: Nevada, Colorado, New York, and Oregon. The least fun states are the tightest: Mississippi, West Virginia, Alabama, Kentucky, and Arkansas. Here’s the tight-loose trade-off at work again: Loose states are more disorderly and rude, and have a litany of self-regulation failures, but they are also more fun; as for tight states, they may feature fewer entertainment options, but they’re more orderly, polite, and self-regulated.
Not only are loose states more fun, but they’re also more tolerant. Moral codes in loose states emphasize preventing harm to others—a universalistic code that applies to anyone, regardless of their race, language, religion, or creed. Indeed, the Daily Beast website created a tolerance score for each of the fifty states using a wide array of indicators, from hate crime incidents to level of religious tolerance. The scores were strongly related to our rankings of looseness. Using survey data from more than two thousand Americans across thirty-eight states, we also found that people in loose states were more likely to support interracial marriages between a white person and a minority, whether African American, Asian, or Hispanic, and they had more positive attitudes toward homosexuals.
Because these findings were based on surveys that directly asked people for their opinions, some may have hidden their overt prejudices. However, we found similar results when we evaluated people’s hidden biases on a psychometric evaluation called the Implicit Association Task (IAT), where hiding one’s true reactions is much more difficult. The IAT measures people’s implicit prejudices based on their immediate responses to various stimuli. For instance, test-takers are instructed to categorize, as quickly as possible, a set of images as either “Good” or “Bad,” and the images may be a mixture of words (such as joy or awful) as well as pictures depicting either “Gay People” (e.g., a same-sex couple holding hands) or “Straight People” (e.g., an opposite-sex couple holding hands). Categorizing images of a stigmatized group more quickly as “Bad” would suggest an implicit bias against, or stronger negative associations with, this group. We analyzed over three million Americans’ implicit biases toward African Americans, the elderly, homosexuals, and the disabled, and found that people living in looser states possessed much lower implicit negative attitudes toward these groups than those in tighter states. Whether or not they’re aware of it on a conscious level, people in tighter states are more likely to hold prejudices against members of stigmatized groups.
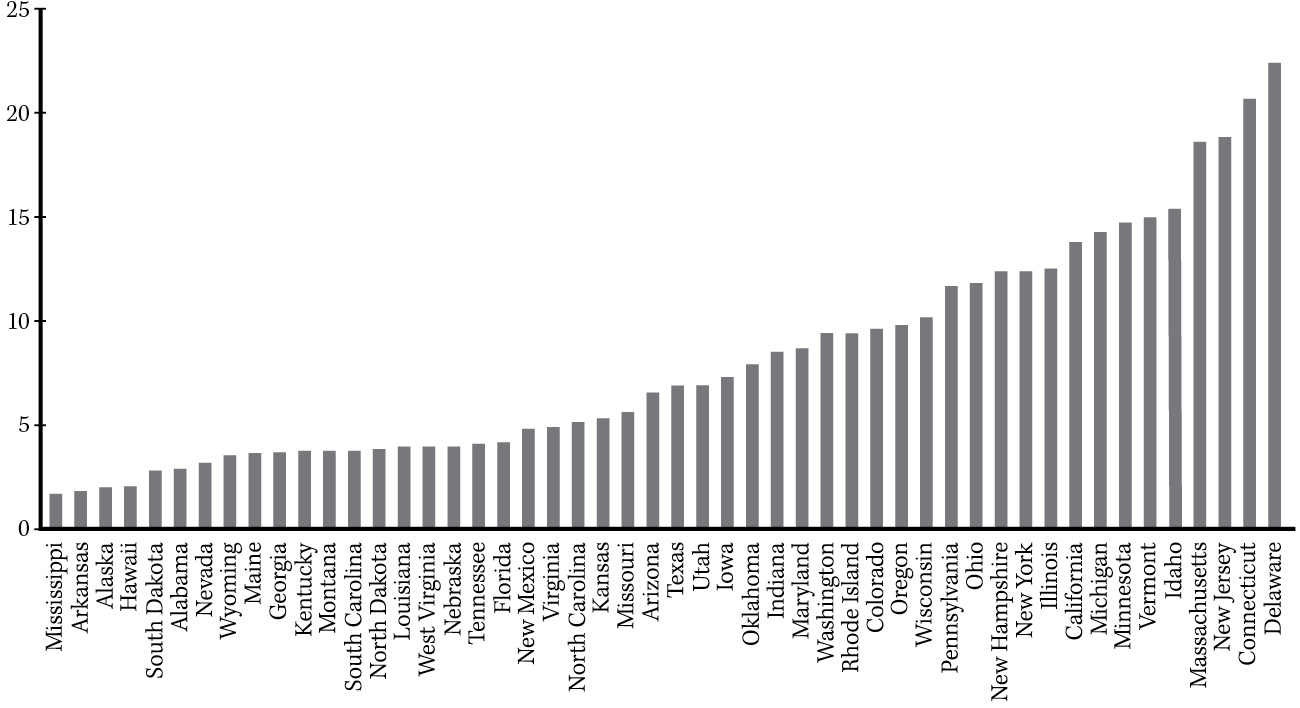
These overt and implicit attitudes toward difference translate into more equality in loose states, including higher percentages of minority-owned and female-owned firms, greater representation of women and minorities in public office, and stronger legal protections for traditionally stigmatized groups. One obvious inference to take from this is that if you have an identity that tends to be marginalized, you’re better off living in a loose state. People with mental illness, for example, experience far better mental health care in loose states, as reflected in access to treatment, special education, jobs, and quality and cost of insurance. Tighter states, on the other hand, show greater discrimination across the board. The Equal Employment Opportunity Commission (EEOC) records far more employment discrimination cases per capita in tight states than loose states, as seen in Figure 5.5. In 2017 alone, 470 cases of discrimination were found in Massachusetts (.07 per capita), as compared with 2,144 in Missouri (.35 per capita), though the two states have similar population sizes and demographics.
Loose states, like loose nations, are also more open to immigrants. In the relatively tight state of Arizona, with some exceptions, undocumented residents cannot obtain their driver’s licenses or receive the same in-state tuition rates at public colleges as legal residents. Meanwhile, in neighboring loose California, another state with a large population of immigrants from Mexico, immigrants have these benefits, and Governor Jerry Brown declared that all are welcome, regardless of their legal status. These different official stances reflect diverging views toward outsiders. In fact, residents of tight states are more likely to report that their states aren’t good places for immigrants to live in. This negativity toward outsiders carries over to higher tight-state support for measures to “Buy American” or restrict imported products.

Figure 5.5. Equal Employment Opportunity Commission discrimination charges per capita by state (2017).
Adaptability is another asset of loose states, which have been the engines for social change in the United States. Historically, the Northeast has been a hotbed of progressive and unconventional movements, from transcendentalism to Unitarianism to women’s suffrage. New York’s Greenwich Village has served as “a magnet for cultural revolutionaries of all sorts: anarchist philosophers, free-verse poets, Cubist painters, feminists, gays, Freudian thinkers, hard-drinking writers, free-love playwrights, and idiosyncratic musicians,” according to renowned historian Colin Woodard. Out west, loose California has consistently spearheaded social change. America’s most populous state was the cofounder (along with New York and neighboring states on each coast) of the cultural revolution of the 1960s and the gay rights movement. On the flip side, tight states often resist social movements. In the late 1970s, tight states accounted for nearly 75 percent of the opposition against ratifying the Equal Rights Amendment, which would have banned discrimination based on gender.
Why did our differences develop in the first place? It might not be obvious, but differences in tightness-looseness across the fifty states were set in motion by the cultural characteristics of those who settled in different parts of the New World, and they’ve been evolving for centuries.
Let’s go back in time to the 1700s, when large waves of migrants from northern Ireland and lowland Scotland began arriving in America. These migrants established an early presence around Pennsylvania and then moved southward, settling in states like West Virginia, the Carolinas, Georgia, Tennessee, Oklahoma, and Texas. There these pioneers unpacked their cultural suitcases, which were filled with the social norms and values of their motherlands. As descendants of Celtic herdsmen, they were known for their tight normative codes, which emphasized courage, strength, and a suspicion of outsiders—a combination of characteristics psychologists call a “culture of honor.”
These cultural traits proved useful in the treacherous Southern environment they explored, where the threat of losing their livestock in raids from neighboring groups was constant. Given this danger, coupled with a lack of formal law enforcement, the settlers developed tight social norms to enforce cooperation and prevent pilfering. Norms for generosity and respect—which promoted group cohesion—were paramount. Settlers frequently entertained guests to showcase this generosity and to gain honor in the eyes of the community. These roots of “Southern hospitality” have persisted into the twenty-first century.
Yet despite their generosity and cooperation, these early settlers were ready to inflict quick and violent retribution on wrongdoers. Such demonstrations of valor helped them maintain a reputation for strength that could deter further attacks. Even teasing was considered a major norm violation in the South and could lead to an eruption of violence, particularly if one was insulted in public. The parents of Andrew Jackson, the seventh U.S. president, were Scotch-Irish immigrants to the Carolinas, where Jackson was born in 1767. His mother is known to have told him to always “sustain your manhood . . . the law affords no remedy for such outrages that can satisfy the feelings of a true man.” Taking this advice to heart, Jackson was involved in more than a hundred documented disputes, including many duels, one where he killed a man. Above all, maintaining one’s reputation for strength, honor, and willingness to punish others for violating norms helped to maintain order in the potentially chaotic and lawless herding economy of the South.
Eventually, these honor cultures spread into the Deep South—areas now known as the states of Louisiana, Mississippi, Alabama, and Georgia—and by 1790, Scotch-Irish settlers constituted the majority of the population of many Southern states. Today, these states are among America’s tightest; they’re where the culture of honor lives on.
Authoritarian tendencies that were at the foundation of the Southern slave economy also contributed to the region’s tightness. As early as 1670, settlers from the colony of Barbados planted a hierarchical society in the American South. Strict norms were designed to control slaves, who outnumbered their masters. Those who tried to run away were to be whipped after a first attempt; after subsequent attempts their punishments escalated to anything from having an ear chopped off, to castration, to having an Achilles tendon severed, to execution. Fines were doled out to masters who didn’t comply with these rules. Those who helped runaways were also fined, if not whipped or killed.
Meanwhile, the settlers in the northern and western United States couldn’t have been more different. From the outset, the first settlers in these regions were known for religious pluralism and multicultural cohabitation, which we know pushes groups to be loose. Toward the beginning of the seventeenth century, a few decades before the Barbadians arrived in the Deep South, the Dutch (inhabitants of one of the loosest nations today) founded New York as a global trading hub that later attracted immigrants from Poland, Finland, Sweden, Ireland, and Portugal. The New York region attracted people who practiced many different faiths, including Catholics, Anglicans, Puritans, Quakers, and Jews.
Farther north in New England, the Massachusetts Bay Colony was settled by an English group of “separatist” Protestants known as the Puritans. Their practices were no doubt austere, and the colony was highly intolerant of other religious groups. But over the course of the seventeenth and eighteenth centuries, a singular Puritan authority was gradually overshadowed and diminished by a vast religious outgrowth of other Protestant sects, including Baptists, Methodists, Unitarians, and Quakers. By the mid-eighteenth century, new norms of tolerance had evolved in Massachusetts and throughout New England, with the populace rejecting the hierarchical and authoritarian practices taking hold in the South. Soon enough, Massachusetts was known as the “Cradle of Liberty” and as a haven for religious diversity.
This loose mentality was later reinforced with the rise of industrialization during the nineteenth century, which made the North more urban and diverse. In the 1870s, Massachusetts—currently the sixth-loosest state in the country—became the first state to have more people living in cities than rural areas. These city dwellers were less familiar with one another than those in rural towns and were therefore less monitored and more anonymous. Meanwhile, the South continued as a predominantly agrarian region marked by close-knit tight communities. According to historian Bertram Wyatt-Brown, who authored Southern Honor: Ethics and Behavior in the Old South, medicine, law, the clergy, and the military were the only tolerated non-agriculture professions in the South.
Out west, starting in the mid-eighteenth century, the state of California was a melting pot of Native Americans, Mexicans, Russians, and Europeans. In 1848, the discovery of gold at Sutter’s Mill began luring more than three hundred thousand fortune-seeking newcomers from around the world, adding immigrants from Chile, Australia, Ireland, Italy, and China to an already diverse mix of settlers. A forerunner of sorts to the “start-up nation” of Israel, California became a “start-up state,” luring risk-takers who were willing to make a treacherous journey for a better future on the West Coast. “Here were to be seen people of every nation in all varieties of costume, and speaking 50 different languages, and yet all mixing together amicably and socially,” Canadian merchant William Perkins wrote about the mining town of Sonora in 1849. California, of course, has its own dark history of racism and exclusion, which is not completely eradicated even today. But early on, the seeds for cultural looseness were sown, and California has evolved to be one of the most tolerant states in the union.
By contrast, as shown by census data, diversity in tight states has been lacking since 1860. In fact, University of Pennsylvania data scientist Randy Olson has shown that some of the least diverse places in the country today can be found in tight states. Even now, there are counties in America that are nearly 100 percent white, including Tucker County, West Virginia; Robertson County, Kentucky; and Hooker County, Nebraska. Tight states have less diversity—particularly ethnic diversity—our own analyses show.
Of course, loose communities exist within tight states, and vice versa, and tight-loose theory can predict where they’ll take hold. Communities with a history of diversity tend to exhibit present-day looseness. In the tight state of Louisiana lies New Orleans, the historically diverse and cosmopolitan port city that is one of the most permissive in the country, as any witness of Mardi Gras and the jazz scene would attest. Dating back to French settlement of the city in 1718, New Orleans has been home to a diverse array of cultures—French, American Indian, Spanish, Cajun, Creole, Southern, and Caribbean—and today it’s far looser than the rest of the U.S. South. In 2015, the New Orleans mayor, Mitch Landrieu, proclaimed, “New Orleans is an accepting, inviting city that thrives on its diversity and welcomes people from all walks of life with open arms.” Likewise, there are tight communities in loose states, and they often display very low diversity. For example, the city of Colorado Springs, nestled in the loose state of Colorado, is almost 80 percent white, and Wyoming County in loose New York is 92 percent white.
The roots of tightness and looseness date back to the norms and values that the early settlers brought with them hundreds of years ago, but that’s not the only explanation. As with nations, the type of ecology the settlers contended with when they got here also played a strong role.
As we’ve seen, a group of people sharing a common territory will often mobilize to strategically tackle ecological threats by implementing strong norms. These threats can include the lack of a steady supply of natural resources, pathogens and outbreaks, and attacks by enemy invaders. The greater the threat, the tighter the community. By contrast, when groups don’t have to worry about food, water, disease, or invasions, they don’t need as many strict rules to coordinate, and they evolve into more permissive societies.
This principle clearly applies to nations, and it plays out in states, too. Mother Nature played a key part in perpetuating tight-loose differences across the U.S. states, and she continues to selectively cast her destructive spell over certain regions.
Many of the states that rank high in tightness, for example, were marked by difficult ecological conditions early on. In the nineteenth century, the Dakotas, Nebraska, Kansas, Oklahoma, and several areas westward were inhospitable territories that experienced very little rain—just twenty inches annually. In these states, “there were few places where agriculture could survive without the help of extensive irrigation projects,” noted Colin Woodard. “The altitude was so high—even the plains and mountain valleys stood above the tallest summits of the Appalachians—that many familiar crops wouldn’t grow at all.”
Likewise, historically, the South also suffered more than its share of Mother Nature’s wrath. In South Carolina, a series of wildfires swept through the state in the late nineteenth century, burning almost three million acres of forest land. In Galveston, Texas, a deadly hurricane killed approximately eight thousand people in 1900, and the state later suffered a 40 percent decrease in rainfall between 1949 and 1951 during one of the worst droughts in U.S. history. In nearby Oklahoma, now the fourth-tightest state in the country, recurrent droughts beginning in the 1910s culminated in the legendary “Dust Bowl days” of the 1930s. With the Great Depression also hitting Oklahoma, over four hundred thousand people ultimately abandoned the state during this time, many moving west to California and Arizona.
Tight states remain the most ecologically vulnerable even today. Data from 1950 to 1995 from the Disaster Center show that tight states have much higher tornado risk than loose states. For example, the tight states of Texas and Kansas have been recently plagued by tornadoes—147 and 92, respectively, on average per year—while tornadoes rarely touch down in the loose states of New Hampshire, Connecticut, and Washington. Data from 1979 to 2004 also show that tight states record higher death rates from heat, lightning, storms, and floods.
We also tracked where hurricanes hit with available data from 1851 to 2004. It’s clear that a disproportionate number of tight states have gotten clobbered. In the list of over fifty of the deadliest hurricanes that have occurred in U.S. history, around 85 percent have done their worst damage in the ten tightest states. Mother Nature has recently been particularly cruel to tight states, deploying hurricanes Katrina, Harvey, and Irma.
Historically, tight states also had to cope with more disease. Examining Centers for Disease Control data from 1993 to 2007, we found that vulnerability to common diseases (e.g., malaria, measles, tuberculosis, rubella, typhoid) predicted states’ tightness levels. While tight states such as Louisiana, Mississippi, and South Carolina scored high on pathogens, loose states such as Maine, New Hampshire, and Vermont scored low. Tight states exhibit higher rates of food insecurity, with fewer households having adequate access to food, and they also have less access to clean air. Tight Indiana, for example, has the poorest air quality in the country, followed by Ohio and Kentucky. By comparison, Oregon, Maine, and New Mexico—all loose states—are among the states with the clearest air. Summing up: Where there’s threat, there’s tightness.
There are exceptions, of course, to challenging ecological conditions leading to more tightness, just as we saw on the global map. Throughout American history, the state of California has been rocked by natural disasters ranging from earthquakes to wildfires to mudslides to heat waves. Yet California is a loose state, for reasons similar to an exception we noted when looking at individual nations—Israel. Thanks to the adventurous immigrants it’s drawn from all around the world, the state boasts tremendous diversity, which has promoted loose subcultures from Hollywood to Venice Beach to Silicon Valley. One in ten jobs in California are held in creative industries, and Silicon Valley, famous for its concentration of start-ups and technology companies such as Apple, Facebook, and Google, is a mecca of innovation. As is the case in Israel, California’s immense diversity and innovation cause the tight-loose pendulum to swing toward looseness.
Environmental threats and disease have played a crucial, but often hidden, role in shaping culture within the fifty states. In 2014, real-estate search website Estately mapped out Americans’ most commonly experienced fears, including tornadoes, hurricanes, volcanoes, lightning, and even bears, spiders, snakes, and shark attacks. They then identified the “scariest places” to live in the United States by looking at which states harbored more of these fear-inducing threats. Remarkably, the resulting map coincides closely with our tightness-looseness map. Tight states like Florida, Georgia, and Texas were far scarier than loose states like Vermont, Alaska, and Nevada.
Mother Nature’s fury isn’t the only threat that tightens groups. As we’ve seen, nations tend to tighten up in response to external threats, most notably foreign invasion.
Of course, the United States has experienced tragic events throughout its history. From the time the earliest colonists arrived in the sixteenth century, there were brutal conflicts between Native Americans and white settlers, which ultimately led to the decimation of America’s indigenous people. Americans have also dealt with attacks on their own soil, including the Revolutionary War, Pearl Harbor, 9/11, and the Boston Marathon bombing. However, after America won its independence from the British, the country hasn’t faced any prolonged invasion or foreign occupation on its own soil since the War of 1812. But while its name might suggest otherwise, internal disputes and animosity have been a constant throughout the over two-hundred-year history of the “United” States.
The prime example is the Civil War. In the nineteenth century, the American South increasingly felt as though it was being “occupied” by “foreign” troops from the North, which had diametrically opposed views on how the nation should be governed. In 1861, the South and North entered into the bloodiest conflict in the nation’s history with an outcome that only reinforced the South’s tight culture. Southerners saw a need to defend their region’s “peculiar institution,” a euphemism for slavery, as indispensable to their agrarian-based economy. Northern efforts to curtail slavery’s spread, they felt, threatened their lifestyle, and their survival.
Clearly, the Southern states that relied the most on slavery had the most to lose from a Union victory. According to this logic, today they should be tighter than Southern states that were less dependent on slave labor. And they are. There is a strong correlation between the percentage rankings of slave-owning families from the 1860 census and state-level tightness today. The tightest Southern states, such as Mississippi, South Carolina, and Georgia, had much higher levels of slave-owning families than did loose states, such as Delaware and Maryland.
By the war’s end, the threat that Southern states perceived from the North had been fully realized. Left without slave labor, the Southern states faced economic ruin. Additionally, Southern lands had been devastated, since much of the war had been fought on Southern soil. Even after the war, violent clashes persisted for years, with almost twenty thousand Northern soldiers remaining in the South to monitor and suppress sporadic raids from rebelling Southerners.
The South, with its already ecologically unstable territory now severely damaged by the war, also faced the unraveling of its well-defined social hierarchy in the postbellum period. The end of slavery and, later, the federal push toward nationwide desegregation disrupted the South’s long-established social order. To prevent daily hostility between groups, people abided by implicit rules for social interaction, which served to signal their place in the social structure. The South’s strong focus on etiquette helped ease daily social tensions, but kept obvious class divisions brewing underneath the surface. “Southerners ironically viewed manners and decorum as so vital to the maintenance of social order that defense of such codes warranted violence,” explains Charles Reagan Wilson, professor of Southern studies at the University of Mississippi. To this day, rules pertaining to friendliness, writing thank-you cards, and saying “sir” or “ma’am” aren’t frivolous habits in the South; they’re a bulwark of social order and stability.
Centuries later, the memory of the Civil War defeat haunts the South, as seen in its ritualized battle reenactments and laws to protect confederate monuments in states like Alabama, North Carolina, Georgia, and Tennessee. While other American regions often have to be reminded of their pasts, “the ghosts of southern memory have remained strong into the 21st century,” writes Thomas L. McHaney, emeritus professor of Southern literature at Georgia State University. “Defeat in the American Civil War led many white southerners to imagine and reimagine what southern life had been before the war came, a process that did much to shape a particular construction of southern identity.” In the South, remembrance of the North as a sinister adversary revivifies perceptions of a persistent threat and reinforces a tight culture. These cultural “scars” linger on.
The fifty states have always been less united than the country’s name implies. Cultural divides run deep in the American national soul: History, ecology, and demography have in concert led some states to be strict and others permissive, resulting in the tight-loose trade-offs and conflicts we see today.
Variation in strictness and permissiveness between states has developed slowly over time, but rapid cultural shifts also can occur—and tight-loose theory can predict them. When there’s threat, even if it’s temporary, merely imagined, or even manipulated, it can engender widespread fear and disorder, leading to people craving stronger norms and a tighter culture. In the twentieth and early twenty-first centuries, for example, threats from overseas enemies and acts of both foreign and homegrown terror have rocked Americans’ sense of safety. In these frightening times, norms shifted to emphasize unity, austerity, and animus toward outsiders; the U.S. became tighter. But once these sources of fear were pacified, the United States as a whole reverted to its relatively loose culture.
The anti-Communist Red Scares, for instance, were reactions to both global and local threats. Americans feared the Communist overthrow of the Russian Empire in 1917 would be repeated in the United States. The first Red Scare was ignited shortly afterward in 1919 by a series of bombs detonated across the country by a few anarchists. These events amped up public fear and paranoia of politically radical groups, and then fear of immigrants and minorities. Laws were passed to deport immigrants, limit free speech, and infringe on the civil rights of suspected communities.
A few decades later, during the Cold War between the United States and an expanding Soviet Union, another era of tightness ensued. After the USSR tested its first nuclear weapon in 1949, Americans feared a nuclear war was imminent and that Soviet spies had infiltrated the U.S. government. A witch hunt against Communists ensued, as even established members of the left-leaning Hollywood community were targeted and stigmatized as Communists. Adding fuel to the country’s anti-Communist hysteria, American troops entered the Korean War to combat Soviet-backed North Korea. Arrests, deportations, and investigations of potential Communist activities flared up across the country throughout the 1950s.
But when such threats aren’t chronic, a country’s system of norms loosens again. All the restrictions, monitoring, and punishments of the 1950s, for example, gradually gave way to the extreme looseness of the 1960s. During this “decade of change,” the nation witnessed groundbreaking movements that sought to end discrimination toward traditionally marginalized groups—including women, African Americans, and gay Americans—and dismantle many of the country’s long-held social norms and values. As more households acquired television sets, more Americans were exposed to new ideas and places. The following decades ushered in unbridled permissiveness, including greater recreational drug use and sexual promiscuity. “Whatever turns you on” and “Sex, drugs, and rock ’n’ roll” were popular phrases of the day. Men tossed aside their hats, women raised their hemlines, and bold patterns became the norm. It was a legendary time for looseness.
Fast-forward to September 11, 2001, which unleashed another temporary wave of tightness. The surprise attack on the World Trade Center by members of the terrorist group al-Qaeda led to the loss of nearly three thousand lives, and a new era of fear dominated American politics, this time toward radical Islamic terrorist groups. Immediately following the 9/11 attacks, Congress introduced 130 new pieces of legislation, created over 260 new government organizations to secure the nation, and spent over $600 billion on homeland security from 2001 to 2011. The Patriot Act, hurriedly drafted and signed a month after the attacks by ninety-eight out of a hundred senators, ushered in unprecedented monitoring of Americans. Law enforcement officers were given permission to search homes and businesses without owners’ or occupants’ consent or knowledge. The Transportation Security Administration launched invasive security requirements and prescreening processes at airports. Immigrant deportation rates rose by over 100 percent between 2001 and 2011.
Threats like 9/11 produced temporary shifts in tightness, but in the years following these national tragedies, remarkable loose accelerants spread across the country: Individual states and then the U.S. Supreme Court ushered in gay marriage, the first U.S. black president (one with a foreign heritage, no less) was elected, drug laws were loosened nationwide, and so on. Another turn to tightness, however, proved to be right around the corner.
Tightness-looseness theory sheds light on one of the most seismic events in American history: the seemingly against-all-odds election of businessman and reality TV star Donald Trump as president in 2016.
While Trump isn’t a cultural psychologist, he possessed an intuitive grasp of how threat tightens citizens’ minds and leads them to yearn for strong leaders who’ll combat these threats. He masterfully created a climate of threat: At campaign rallies throughout 2015 and 2016, Trump warned his ever-growing crowds that the United States was a nation on the brink of disaster. He cited mounting threats from Mexicans bringing violence across the border, global trade agreements and immigrants taking away jobs, radicalized Muslims plotting terror on American soil, and China “raping” the country. Throughout his campaign, he sent a clear message—that he was capable of restoring social order. “I alone can fix it,” he declared to the American public. Trump used the psychology of tightness to pave a path all the way to the White House.
In the months prior to the 2016 election, Joshua Jackson, Jesse Harrington, and I conducted a nationwide survey aimed at peering into the minds of Trump supporters. Over 550 Americans from across the country and across demographic lines (gender, region, political affiliation, and race/ethnicity) answered questions about how fearful they felt about various external threats to the United States, such as ISIS and North Korea. They also responded to statements aimed at gauging their desire for cultural tightness, such as whether they felt the United States was too permissive or restrictive and whether American norms were being enforced either too strictly or not enough. Finally, they were asked about their attitudes toward policy issues such as surveillance and mass deportation and their support for different political candidates, including Trump.
The results were telling: People who felt the country was facing greater threats desired greater tightness. This desire, in turn, correctly predicted their support for Trump. In fact, desired tightness predicted support for Trump far better than other measures. For example, a desire for tightness predicted a vote for Trump with forty-four times more accuracy than other popular measures of authoritarianism. Concern about external threats also predicted support for many of the issues that Trump has championed, such as monitoring mosques, creating a registry of Muslim Americans, and deporting all undocumented immigrants. Perhaps unsurprisingly, Trump had the most support in tight states—where citizens felt the most threatened.
Clearly, even in an age where we like to fancy ourselves rational voters, the 2016 election turned largely on primal cultural reflexes—ones that had been conditioned not only by cultural forces, but by a candidate who was able to exploit them.
The meteoric rise of Trump, of course, is more than an American phenomenon. It’s a reflection of a far broader principle that has echoed across human history and culture: Threats lead to desire for stronger rules, obedience to autocratic leaders, and—at worst—intolerance. Tightness-looseness can help account for the astounding political upheavals happening around the globe in the twenty-first century, including British citizens’ 2016 vote to leave the European Union and the success of the Law and Justice Party in Poland’s parliamentary election. Hungary has tightened considerably in recent years due to a different kind of “threat”—primarily Muslim refugees, whom Hungarian prime minister and strongman Viktor Orbán calls “invaders.”
These cultural shocks show a common pattern: Perceived threat—often about terrorism, immigration, and globalization—tightens cultures and catapults autocratic leaders onto the national stage.
Threat, of course, isn’t always an objective phenomenon. “Real threats have declined over human history, due to our growing ability to counter them, while manufactured or imaginary threats have increased dramatically,” Israeli historian Yuval Noah Harari, the author of Sapiens: A Brief History of Humankind, told me. “Leaders and cultures could deliberately manufacture artificial threats or honestly see a major threat where none exists.” The tight Nazi regime in Germany, Harari noted, rose in response to largely imagined rather than real threats.
Notably, both in the United States and abroad, autocratic leaders often garner sizable support from working-class and rural voters. In fact, just as the tight-loose axis differentiates countries and states, it also turns out to pit members of different socioeconomic groups against one another, with dramatic consequences.