Weighing the Rivals on Their Terms
The hen is the wisest of all the animal creation because she never cackles until after the egg has been laid.
ABRAHAM LINCOLN
HOW WELL HAVE THE CHALLENGERS to modern capitalism—corporatism and socialism—done? As the above narrative suggests, Bismarck’s Germany, which had elements of corporatism, did well, though whether much of that success was owed to corporatism would be hard to say. The corporatist economies of Mussolini and Hitler rebounded from national crises no better than the American and British economies did. But what about the new corporatism or the new socialism of the mid-1960s to the present? We are now poised to study their consequences and influences over the past half century.
This chapter will explore whether the neo-corporatist and neo-socialist economies have performed as claimed. In the chapters that follow, this book will go on to argue in favor of a criterion for judging the performance of an economy that is radically different from corporatist and socialist thought. But first it ought to show how socialist economies failed to achieve socialist goals, and how corporatist economies failed to deliver corporatist benefits.
Socialism—Claims and Evidence
Socialism means many things but at its core is social ownership of a range of enterprises: economies with wider state ownership are generally seen as more socialist than those with markedly narrower state ownership. In the most basic sort of socialism, state-owned enterprises (SOEs in the jargon) are largely confined to health care, education, and some insurance industries, while highly socialist economies extend state ownership more widely.
So we would like data with which to test the socialist belief that state ownership boosts economic performance. Fortunately, evidence on the scale of state enterprise started to be available two decades ago. Estimates of the share of total domestic output (GDP) produced by SOEs were published in a 1995 study by the World Bank, Bureaucrats in Business. Among the advanced economies—our focus here—the percentage share of GDP in 1986–1991 produced by the SOEs was 10.0 percent in France, 7.1 percent in Germany, 5.6 percent in Italy, 4.0 percent in Spain, 3.0 percent in the United Kingdom—down from 5.9 percent pre-Thatcher—and 1.0 percent in America. (The data exist for two smaller countries, Austria (13.9 percent) and Portugal (14.2 percent).) A wider coverage of countries was provided by Branko Milanović in a 1989 book Liberalization and Entrepreneurship, and some further countries were added by using the SOEs’ share of total employment, rather than output. In these calculations, covering 1978–1983, France is again at the top, now followed closely by Italy and Austria; next Sweden and Finland; then Germany and the United Kingdom (before Thatcher shrank state ownership in the next decade); next Norway and Canada; then Australia and Denmark; and lastly Spain, Holland, and America. See Table 7.1 for the full data.
Most proponents of a relatively socialist organization of economies—the so-called advanced ones, whether or not the low- or middle-income ones—stress the availability and steadiness of work they believe it provides. As for the availability of work, they see the socialist enterprise as more willing to hire and retain marginal workers at risk of chronic joblessness than capitalist enterprises are; also more willing to retain workers in the face of downswings, thus shaving off troughs in the employment cycle. Yet these two points, even if valid, are not conclusive, since new enterprise formation in modern capitalism may generate as many new jobs as are lost by established enterprises during slumps.
Belief that the more socialist economies were superior at job creation gained credence in the shining period from the mid-1950s to the mid-1970s. Using the “standardized” unemployment rates calculated by the OECD, we see that the American rate had an average level of 4.4 percent from 1960 to 1973. The rates in the European countries widely considered relatively socialist were at a spectacularly low level in that period: 0.8 percent in Germany, 1.3 percent in Norway, 1.8 percent in France, and 1.9 percent in Sweden. (The European Economic Community as a whole had an average unemployment level of 2.6 percent in that period.) But that impression was dispelled in subsequent decades. By the mid-1980s unemployment rates were markedly higher in the entire West. Europe had largely run out of the remaining new products and processes it could “transfer” from the rest of the world, so labor supply and business investment both retracted. America suffered a milder retraction from a different cause—a sharp drop of innovation from a high level. (Chapters 9 and 10 tell that story.) By 1995, the lowest unemployment rates among the larger countries were 5.6 percent in America, 6.5 in Holland, 7.0 in the United Kingdom (in 1997), and 8.2 in Germany. The highest joblessness was in Spain (22 percent), Italy (11.7), and France (10.3). Here too, the more socialist economies cannot be said to have demonstrated a widespread tendency to lower unemployment. And they may very well tend to have higher unemployment but act to contain that tendency through aggressive interventions. Most of the relatively socialist economies—Germany, Finland, France, and Sweden—have huge state programs aimed at reducing unemployment, thus masking to a degree their tendency to high unemployment. In contrast, most of the least socialist countries—namely, the United States, the United Kingdom, Canada, Australia, and Norway—make such interventionist expenditures least often. (See OECD, Employment Outlook, 2005.)
TABLE 7.1 Importance of Public Corporations and State Sector in Some OECD Countries
|
Country* |
In terms of output (%) |
In terms of employment (%) |
|
High share (above 15%) | ||
|
France (1982) |
16.5 |
14.6 |
|
|
|
|
Moderate share (10–15%) | ||
|
Austria (1978–1979) |
14.5 |
13.0 |
|
Italy (1982) |
14.0 |
15.0 |
|
France (1979) |
13.0 |
10.3 |
|
New Zealand (1987) |
12.0 |
n.a. |
|
France (1973) |
11.7 |
9.3 |
|
Turkey (1985) |
11.2 |
20.0 |
|
United Kingdom (1978) |
11.1 |
8.2 |
|
West Germany (1982) |
10.7 |
7.8 |
|
United Kingdom (1983) |
10.7 |
7.0 |
|
West Germany (1977) |
10.3 |
7.9 |
|
United Kingdom (1972) |
10.2 |
7.8 |
|
Sweden |
n.a. |
10.5 |
|
Finland |
n.a. |
10.0 |
|
|
|
|
Low share (5–10%) | ||
|
Portugal (1976) |
9.7 |
n.a. |
|
Australia (1978–1979) |
9.4 |
4.0 |
|
Denmark (1974) |
6.3 |
5.0 |
|
Greece (1979) |
6.1 |
n.a. |
|
Norway |
n.a. |
6.0 |
|
Canada |
n.a. |
5.0 |
|
|
|
|
Negligible share (below 5%) | ||
|
Spain (1979) |
4.1 |
n.a. |
|
Netherlands (1971–1973) |
3.6 |
8.0 |
|
United States (1983) |
1.3 |
1.8 |
Source: Milanović, Liberalization and Entrepreneurship (1989).
Notes: Excludes government services proper (i.e., includes only state-owned enterprises in commercial activities). n.a., not available.
*Ordered according to share in output (when available).
Socialism has traditionally stood for high participation in the labor force, not just low unemployment among those participating. Yet labor force participation rates, expressed in percentage of the working-age population, do not show a connection between socialism and participation. In 1995, as estimated in the OECD Economic Outlook for June 2000, the participation rates among the “major countries” were 76.9 percent in the United States, 75.8 in Canada, 75.3 in the United Kingdom, 71.2 in Germany, 66.7 in France, and 57.4 in Italy. (Denmark at 80.2 percent and Holland at 77.7 are two other countries low in state ownership and high in participation.) Hence, relatively socialist economies cannot be said to show a tendency toward high labor force participation. It appears pretty safe to infer just the opposite. (There are just two anomalies: Austria had a high 76.5 percent participation despite a high state ownership. Spain, which Milanović did not cover, had an abysmally low participation rate of 61.5 percent despite its dislike of state ownership.)
The disappointing performance in both unemployment and participation is a striking failing of European socialism in view of the oft-expressed dedication of most socialists to economic inclusion—the absorption of working-age people into the mainstream economy at terms allowing them the normal sorts of participation in society. Some socialist leaders have complained that they are up against the obstacles posed by “multiculturalism,” though the continental European nations ranking high in socialism are not unique in facing cultural, ethnic, and racial diversity—there is surely more diversity in America. The source of this failing may be that the horror of business that fueled the socialist movement also fuels low labor force participation. It may also be that participation is apt to be low—and unemployment high—among countries in which the workplace is very bureaucratic—in which post office jobs at post office wages typify existing work. In such countries, large numbers of working-age people prefer to be occupied at home or in what is known as the informal sector, or underground economy. Rainer Werner Fassbinder’s movie The Marriage of Maria Braun immortalized a period when German women entered the economy in the last years of World War II and even after, but German socialism could not stop them from going back as soon as they could afford it to kinder, küche, kirche (children, kitchen, church).
Another possible explanation for the disappointing performance in unemployment and participation of some economies is that the households in those countries exhibit high levels of household saving in relation to household disposable income. Among the large economies in the OECD in the early 2000s, the standout savers were Belgium, France, Italy, and Spain (Economic Outlook 2011); and the ones ranking the lowest in labor force participation were Italy, France, Belgium, and Spain. The lowest savers were the United States, Canada, and the United Kingdom; and highest in participation were Canada, Germany, the United Kingdom, and the United States. The most direct causal link is from high saving to high wealth to high demand for leisure, and late entry and early retirement from the labor force. (Wealth data are available only for the G7 nations.) An indirect link runs from wealth to the wherewithal for a welfare state that weakens incentives to work by offering so many things free of charge. (Mario Draghi, president of the European Central Bank, quotes the late Rudi Dornbusch as saying, “the Europeans are so rich they can afford to pay everybody for not working.”)
Socialists’ other claim of superiority on the employment front is that work is less precarious in a socialist economy. They could argue that work is steadier because there is less job change owing to less innovation. Most socialists, however, would prefer not to premise their argument for the superiority of socialism on an assumed lid it wisely puts on innovation. (It is imaginable that socialist economies innovate as much but do it better, setting higher hurdles for innovative projects at enterprises while compensating by undertaking projects of a longer term. But most observers of the more socialist economies see weak dynamism.) What admirers of a socialist economy argue is that, by its nature, it has key tools to moderate cyclical swings in employment that a capitalist economy lacks.
America in the 1930s gave the impression that it was lacking in just these kinds of tools. When its economy went into the steep downswing that was followed by the Great Depression, the government’s monetary weapons were pinned down supporting the price of gold until the gold standard’s demise in 1933. In any case, those weapons would not have been sufficient against structural forces moving labor away from building houses or farms and into making cars and other consumer durables. (The lesson was learned: In the 2008–2009 downswing, the world’s monetary authorities did not sell their gold stocks to block a rise of gold prices.) The government had little fiscal weaponry with which to combat the unemployment arising. With no thought of taking over private industry, President Hoover, an engineer by training, resorted to massive construction projects to tame rivers and create dams for hydroelectric power. But some strain of conservatism held back the government from dotting the whole country with dikes and dams. The employment problem was finally thrown back on the modern capitalism on which the economy was built. In contrast, the central government of a socialist economy, when faced with a downswing, can compel SOEs to maintain or boost their investment expenditures—as if money were no object. This was the case with China in the aforementioned global recession, when it induced local governments to turn on the spigot of funds for increased local construction projects.
Yet the experience of recent decades does not bear out belief in the greater resistance of socialist economies to swings. The relatively socialist economies of continental Western Europe suffered an immense swing in employment (and other measures of economic activity) from the late 1970s to 1985—truly a Second Great Depression.1 Yet the Europeans did not reach far into their arsenal of fiscal weapons, while the United States, faced with a similar downswing, however weaker or stronger it may have been, deployed fiscal weapons unknown in Hoover’s time—higher investment tax credits and lower corporate profits tax rates—and fashioned some new ones—revenue-neutral cuts in marginal tax rates and increases in the earned income tax credit. (The monetary weapons at Paul Volcker’s Federal Reserve were aimed at putting out the fires of inflation.) In the global downswing of 2008–2009, the more socialist economies were again more restrained in combating the slump. And it would be hard to decide which area suffered the wider downswing: the euro zone, which holds many of the more socialist economies, or the United States.
If there is a dimension in which the relatively socialist economies are still widely thought to have surpassed the others, it is in the measures taken to reduce income inequality and in the apparent effects of such inequality. While classical socialism meant full employment and less unequal wages, latter-day socialism has meant less unequal income. Some relatively socialist countries, namely France, Finland, and Sweden, as well as some not apparently socialist countries, namely Germany, Denmark, and Holland, have achieved reductions in inequality—say, between the bottom 30 percent and the top 30 percent—by instituting services free of user charges for all, thereby narrowing the inequalities in consumption levels.2 Yet the relative narrowness of wage inequality in these countries has been the result not of redistribution by the state through spending and taxes, but the result of relatively low inequality to begin with: pre-tax incomes differ far less than in the Anglo-Saxon countries, for example. The Scandinavian nations are very homogeneous. Much of the remaining part of the explanation may be that there is less opportunity to innovate, thus to strike it rich. Various moral philosophers, from Immanuel Kant to John Rawls, opposed measures that would reduce inequality at a cost to everyone. But these qualifications miss the crucial point.
A deep decline of economic inclusion, particularly among less-qualified workers, swept over the Western economies in the 1980s—socialist, corporatist, and capitalist alike. Germany, France, Italy, and Sweden reacted strongly. In the first two, the relative wage of the least-educated men actually increased between the late 1970s and the mid-1990s; in the latter two, the relative wage slipped 1 or 2 percent. Holland, at the other extreme, apparently did not do enough, allowing the relative wage to fall 10.5 percent. In the United Kingdom and the United States the relative wage fell by 8 percent and 6 percent, respectively. It is striking, however, that the countries that pushed up the relative wage in the face of a strong headwind paid a stiff price—a far greater rise of unemployment among less-educated individuals over the 1980s than in the other advanced economies. The countries that settled for resisting most of the relative wage decline, Italy and Sweden and to some extent the United States, paid a much lower price. Holland suffered the smallest increase in the unemployment rate by far. What evidently happened is that France, led by a socialist party, and Germany, which refers to its “social market,” used blunt instruments, such as statutes or labor union actions, to force companies to pay higher wages to the poorly educated; Italy and Sweden, both relatively socialist-minded, used similar methods to resist a significant decline of the relative wage. These crude measures had the side effect of reducing the numbers of the least-educated that companies could afford to employ. The “catch” in the socialist progress on the wage front was a forced retreat on the employment front.3
Proponents of socialism widely think of the more socialist economy as more scientific, owing to the better organization of state enterprises and enterprises generally. It is also thought to have an education system that is better at supplying the middle and lower strata of society with the human capital they will need in the economy. If these claims are valid, we should expect the more socialist economies to exhibit higher levels of productivity—output per unit labor and output per basket of labor and capital, called total factor productivity (or multifactor productivity). In fact, some of the more socialist countries in Europe have been rocked by international studies evaluating their educational institutions far more poorly than imagined. But never mind. We may as well let the productivity data speak. What may be the first statistical study of the effects of socialism used cross-national data to estimate the relationship between the growth of output per worker and the share of national output produced by state enterprises.4 A negative association was found. In short, a high SOE per unit of GDP hampers the rise of GDP. (That does not mean that even the best corporatist economies may never catch up to the leaders. It means that if they do catch up, it will take longer.)
There could be more here than meets the eye. It could be that high state ownership and low growth are both effects of a third influence—a heedlessness toward property rights or an outright antagonism toward private property with resulting fears of expropriation for any wealthy private investor brave enough to venture his or her capital. In such a country, SOE is better than no enterprise. That does not really alter the implications of the findings. Where a country opposes private ownership of enterprises—where it is socialist minded—it suffers poor economic performance.
Corporatism—Claims and Evidence
Classic corporatism, such as Mussolini’s, sought to restructure the capitalist economy so as to speed economic growth—growth of productivity and of various national capabilities—far beyond the puny capacity of Continental capitalism. This meant more initiative in the public sector and more direction of the private sector—thus “ownership without control” for the owners. The quest for greater national growth and national power was to be subject to considerations of solidarity and, in particular, “social protection.” That meant “concertation” of the state with the “social partners,” and, more broadly, subsidies for regions or industries. In an equivalent view of classic corporatism, the state is free to take whatever measures it chooses in the name of solidarity and protection, constrained only by the need to take steps aimed at restoring growth when growth has slowed too much and too long.
This system, in which, in principle, the state may intervene at its own discretion without any restraints, poses serious moral hazards; and insofar as politicians fall into these hazards, their misconduct becomes part of the workings of the system. A constitutional democracy might be able and willing to curb such intervention but may fail to do so. Even in a democracy, self-interested legislators are apt at times to use their votes, and agency heads their powers to award projects, to win the support of interest groups that can keep them in office. In this political process, “growth” may take a back seat or be altogether neglected—even if it continues to be paid lip service. And, with the politicians focused primarily on their own political support, “social protection” is not really the rule either. Politicians may also be so venal as to dispense patronage to regions, companies, and labor unions in exchange for money under the table—kickbacks. (In 1990s Italy, bribery became so rampant that Italians saw themselves living in Tangentopoli—Bribesvilles.)
The hazards of a corporatist system do not stop there. If only insiders are well-enough connected to become clients of the politicians, the system may operate to protect insiders against outsiders. The clients and cronies of the state have no need for contracts paid with scarce taxpayer money if their enterprises can be awarded monopoly power. The gain of the insiders is the loss of the outsiders, who may be unable to start a business, break into an industry, or have a rewarding career—whether or not “protected” with subsidies for medical care, food, and heat. This is the burden of extreme corporatism: the deprivations of some, few or many—deprivations of basic goods like careers—who are not morally compensated by the spoils of the advantaged, few or many.
To rate how well the more corporatist economies perform their mission we need criteria and evidence with which to judge which countries are relatively corporatist and, preferably, to judge the degree of corporatism. It makes sense to begin looking under a lamppost where there is plenty of light. The directiveness of the state in the economy is widely seen as measured by the sheer size of the government, but not every such measure is helpful. Though a highly corporatist economy would need armies of bureaucrats to direct it, a swollen public sector is not a safe measure of corporatism. In 1960, the United States had, among G7 nations, the highest share of total employment working in the government—15.7 percent. It may have been the most corporatist in capabilities, with all its soldiers and schoolteachers at the ready. But few, if any, would believe it was the most corporatist in spirit. And, in fact, the other countries were fast pulling up their capabilities. By 1980, the United Kingdom and Canada exceeded—and France, Germany, and Italy were near—America’s 16.7 percent. Evidently, government employment levels do not differentiate the advanced economies. (See OECD, Historical Statistics 1960–81.)
A better measure of the state’s reach is government purchases of all kinds (not just labor) plus subsidies encouraging certain things and transfer payments awarded to certain people. Government purchases and subsidies are a standard measure of the extent to which the government guides the use of resources in the economy; transfer payments may in some cases be part of a social bargain to pursue corporatist goals. On this broad measure, the high-income economies had come to differ enormously by 1995. At one end, Sweden stood at 65.2 percent of GDP (55.0 percent in 2005), France at 54.4 (53.3), Italy at 52.5 (48.1), Belgium at 52.3 (52.1), and Holland at 51.5 (44.8). At the other end, America stood at 37.1 percent (36.3 in 2005), Britain at 43.9 percent (44.1), and Spain at 44.4 (38.4). In the middle were Germany at 48.3 percent of GDP (46.8) and Canada at 47.3 (38.0).5 Among the smaller countries, Finland was at 61.5 percent of GDP (50.1), Denmark at 59.3 (52.6), and Switzerland at 34.6 (35.0). But before we declare Sweden the most corporatist nation (and Belgium third-most) we had better widen our investigation.
Among the larger high-income economies, France, Spain, and Italy rank worst in legal barriers to entry in industries; Spain and Italy in barriers to entrepreneurship; Italy, France, and Spain in economy-wide product market regulation; Spain and France in competition law and its enforcement; and Holland, Spain, Sweden, and Germany are seen as the most excessive in their employment protection legislation (EPL). On the whole, Italy, France, and Spain rank worst on these counts, while Britain, America, and Canada rank best—with Sweden, Holland, and Germany in the middle. Among the smaller high-income nations, Switzerland generally ranks in the middle, Ireland ranks high, and Denmark even higher. A broad measure of business interference, derived from OECD data, which The Economist in July 1999 dubbed an index of “red tape,” differs a little: it puts Italy and France at 2.7, Belgium at 2.6, next come Germany at 2.1 and both Spain and Sweden at 1.8; Britain is best at 0.5, next America at 1.3, and Holland at 1.4. (Canada and Austria were omitted.) All these results are informative, although they are better at detecting levers of control and an obstructiveness that might be economy-wide than at gauging selective meddling and directing.6
While the above indicators describe the arms of a corporatist economy, another dimension of corporatist economies is the extent to which wage setting uses a trilateral mechanism connecting the state with labor unions and business confederations. This institution is still at the heart of Italian corporatism—both the rhetoric of Mussolini and the reality after the war. Indexes of “union and employer coordination” constructed by Stephen Nickell show only trace amounts in the United States and Canada, with very little in the United Kingdom (though the CBI still exists). We find the highest levels of coordination in Sweden, Austria, and Germany; next are France, Italy, Belgium, and Holland; tied for the lowest levels are the United States, the United Kingdom, and Canada.7
Another dimension of corporatism is the hazardous and uneven playing field on which private property has to operate. Some markers here are the amount of corruption in the public sector, the risk of expropriation borne by private enterprises, and the risk of government repudiation of contracts. How nations rank in these respects may help us rank nations according to their corporatism. Of course, corporatism does not have a monopoly on these bad traits, but that is not a decisive objection to their use as signs of corporatism. However, measurements of these qualities are generally proprietary information. What is available is an average of these three indicators and two other indicators (namely, law and order and quality of the bureaucracy), which are in turn averaged with an indicator of openness to foreign trade. The advanced economies rank in descending order as follows: Switzerland, the United States, Canada, Germany, Iceland, Denmark, Norway, France, Belgium, Austria, Britain, Japan, Australia, Italy, Spain, Portugal, Ireland, Korea, and New Zealand.8 Taken at face value, this ranking suggests that, among the nations under examination here, Spain, Italy, Britain, Belgium, and France are relatively corporatist.
The evidence on the differing degrees of corporatism in the advanced economies cannot be entirely satisfying until we have evidence on the scope of statism in the advanced economies. We need data on the degree to which the state goes around the capitalist institutions and the competition of the marketplace to exert its influence on industries and the companies—enabling or privileging some activities or players and not others. To that end, we could use data on the extent of lobbying and government contracts. We could use data on informal pressures exerted by the state on businesses—such as offers or denials of positions in the government. (France is thought to be a revolving door of executives who shuttle between jobs in the private and public sector.) We could use data on the presence or absence of a constitution that allows the government only “limited” roles in the economy. Some countries lack constitutions that, with judicial review by the highest court, would restrain the government from playing a directive role in the business sector, while some other countries have constitutions prohibiting the government from interfering with the direction of the business sector.9 A readily available statistic that may well reflect the privileging of some companies over their competitors is capital’s relative share of the income generated in the business sector. (When a company is anointed a national champion in its industry, it can raise its price; its competitors, seeing it has become easier to compete, will up their prices.) Capital’s share in national income may also be a clue. In 1995–1996, among large economies, Italy and France ranked highest, with a capital share of 42 percent and 41 percent, respectively. Germany and Belgium were in the middle at 37 percent. In the bottom group were the United States at 34 percent and Britain and Canada at 32 percent.10 (Among smaller economies, Austria was highest at 41 percent, Spain and Holland were at 40. Switzerland and Sweden were low at 31 and 33 percent, respectively [1996–1997].)
These data all show that in almost no part of the world is the government a silent partner in the business sector. They also suggest that the degree of involvement by the state varies a great deal from one country to another, even among those countries commonly thought to have the same economic organization. The totality of the above evidence suggests that the economies of Italy and France have relatively high degrees of corporatism, America and Canada the lowest, with Britain and Germany between these two poles. Corporatism is also rather high in Spain, Holland, Belgium, and Ireland while rather low in Switzerland, Denmark, and Norway. Sweden, so oft-discussed, is a mixed case: interventionist yet pro-business.
Sensing now which countries had relatively corporatist economies in recent decades, we are ready to answer the main question of this chapter: what was the outcome of the corporatist project in which these countries were engaged between the war’s end in the mid-1940s and the last years of the 20th century? Painting with a very broad brush, one could say that in that half-century productivity levels came close to converging. But how close is “close,” and what happened after near convergence?
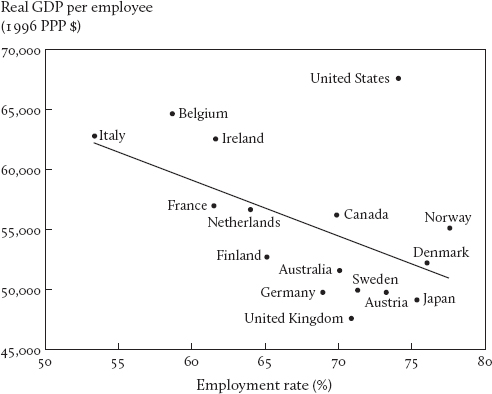
Consider first output per (employed) worker. According to OECD calculations, the GDP per employee of Italy, Ireland, and Belgium came near the U.S. level in 1996. (Italy weighed in at 62,500 dollars, while the United States was at 67,500.) In a lower group was France along with Norway, Canada, and Holland. Below them were Germany alongside Austria, Sweden, and Denmark. See Figure 7.1. These results do not appear to be a success for the corporatist experiment: after 50 years, only three of the high corporatists beat Canada and not one beat the United States. And there is more that must be said.
FIGURE 7.1 Real GDP per employee and the employment rate (employment per working-age person). GDP, gross domestic product; PPP, purchasing power parity. (Source: OECD.)
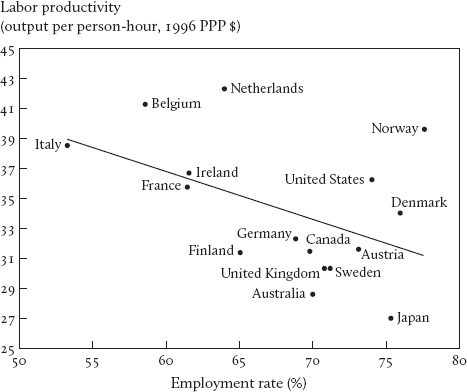
The GDP per hour worked has also been calculated by the OECD. See Figure 7.2. By 1996, the U.S. level was reached in Italy, Ireland, and France—more or less. Germany and Canada reached somewhat lower levels, while the United Kingdom and Sweden occupy a still lower notch. But there is less there than meets the eye. For several reasons, these observations have little significance. For one thing, Europe is a continent of many nations, so it should not surprise us that there are a couple of “outliers,” such as Holland and Norway, that have higher levels of output per manhour than the United States. If we looked at America’s 50 states, we would also see outstanding levels in California and Massachusetts. For another thing, the employed are a rather narrow section of the working-age population in the many corporatist economies with an employment problem. For example, Italy’s 1996 GDP per hour, at almost 39 dollars, is so high next to America’s, at only 36 dollars, because Italy’s economy fills only jobs that are rather productive and it fills them with its most productive workers—low-wage employment is not permitted. Had Italy employed 75 percent of the working-age population, as America, Norway, and Denmark did, its GDP per hour would have been 32 dollars—a great deal less than Norway’s 40, Denmark’s 34, and America’s 36. Differing levels of labor-force participation in Europe and America spoiled productivity comparisons from the mid-1970s to the mid-1990s. Finally, data on total output per total number of hours worked in less-corporatist America, Canada, and Britain are further biased downward by the fact that people there tend to work longer hours, which drives down their output per hour, while the reverse is true in corporatist Italy, France, and Spain, where people tend to work far fewer hours per year.11
FIGURE 7.2 Labor productivity (real GDP per hours worked) and employment rate (employment per working-age person). (Source: OECD.)
On this evidence, then, it cannot be said that the corporatist economies delivered on their claim to be superior in productivity to the remaining modern economies—those in America, Canada, and Britain. Quite the contrary: taking account of the considerations just noted, America’s relatively modern economy retained its edge in productivity. And two other relatively modern economies, those of Canada and Britain, gained ground in the past two decades.
A stronger argument can be made using Figure 7.2, where the shortest distance of a country from the sloping line can serve as a makeshift measure of how well it performs in both employment, which is the socialist focus, and productivity, which is the corporatist. Among the large economies, the relatively corporatist ones—France, Italy, and Germany (not to mention the smaller Austria and Sweden)—all lie some distance southwest of the sloping line, while the relatively modern ones, including America, lie some distance northeast of the sloping line. Canada, though it is in the southwest, is not as far away as Sweden, Finland, and Australia, which have all come under suspicion of possessing significant corporatism in their economies.
Furthermore, the seeming catch-up of Italy and Germany by 1995 proved ephemeral. From 1995 to 2005, their participation rates recovered, with the predictable result that the added jobs offered diminished productivity. (A Cambridge don of yesteryear, Dennis Robertson, perhaps hoping to make his lecture on the law of diminishing returns more vivid, imagined that the 10th man in a construction crew, though they had no shovel left for him, could go to get the beer.) Over the same period, America saw workers of low productivity or whose jobs offered low productivity leave the labor force, with the result that U.S. output per employee clambered from its former (rising) track onto a higher track. Thus American output per manhour (and per employee) distanced itself further from the Italian and German levels.
This chapter has been focusing on dimensions of economic performance—all highly materialist—to which corporatism and socialism have been dedicated. We could look at other dimensions without straying from the materialist ones. The notable emigration of young people from France over the past two decades could be indicative. That evidence may, to some extent, reflect failures by the Continent’s corporatism to deliver economies gleaming with productivity and brimming with jobs. (The fact that the high tide of unemployment since the 2007–2008 international financial crisis has damped that migration is not evidence that the corporatist economies have improved or that the less corporatist ones have worsened. It is too risky to quit in search of greener pastures.) The drawback is that the emigration phenomenon does not identify which deficiencies of corporatism and socialism are at work—only that they have deficiencies. The deficiency may be nonmaterial, such as oppressive companies or a repressive economic culture.
Wage inequality or, more aptly, unjust wage inequality is another dimension of performance on which corporatism might be judged. In view of the data discussed earlier on wage inequality, it is accurate to say that the relatively corporatist nations—Italy and France, and to a lesser degree Spain, Holland, Belgium, and Ireland—have less wage inequality than the exemplars of the modern economy: Canada, America, and Britain.12 But, as stressed before, this may mean only that Canadians, Americans, and Britons are rolling the dice with greater frequency than the Continentals do. Yet their considerable ethnic and racial diversity may also have some array of effects on unjust wage inequality. However that may be, this chapter has set out to examine whether corporatism achieved its goals, and uprooting wage inequality was never a part of the corporatist manifesto. (Some corporatist countries, for example, have been notorious for leaving substantial minorities unintegrated.) If, as corporatism holds, the accomplishments and initiatives of the nation are what matters—and not personal freedom or individual aspiration and rewards—then the very idea of economic justice ceases to have any possible meaning. And, in fact, among the larger of the relatively corporatist countries, neither Italy nor Spain nor Germany did much to address wage inequality with training programs or employment subsidies. (On the European continent, only Holland and France put appreciable resources into pulling up wages at the low end of the labor market.) The countries that have long developed sophisticated machinery for raising the rewards to low-wage work are Britain and America, neither among the relatively corporatist nations, with their program of wage supplements for the working poor.
A Paucity of Innovation
It is apparent by direct observation that in the past three decades, up to the 2007–2008 crisis, the growth of the Big 4 on the European continent—France, Germany, Italy, and Spain—continued to be driven by advances external to their economies, mainly (but not exclusively) advances made in the United States. Thus, the degree of these economies’ catch-up with the American economy was not powered by a great rebirth of the indigenous innovation that was visible in continental Europe from about the 1870s to the 1930s. The corporatist economies must have come close to catching up with the American economy mainly by imitation. If growth relied on outside forces, by the way, the same is true of employment. A total cessation of American innovation would have sent the Continent into a long slump.
But what did the corporatism in some continental European countries do to inhibit or fail to promote innovation? One can imagine that the welter of bars put up by the relatively corporatist economies, such as barriers to entry and the OECD’s barriers to entrepreneurship, would hinder or block various advances in productivity. However, it would be satisfying to see evidence that this barrier or that deficiency operated to dampen or fail to spur indigenous innovation.
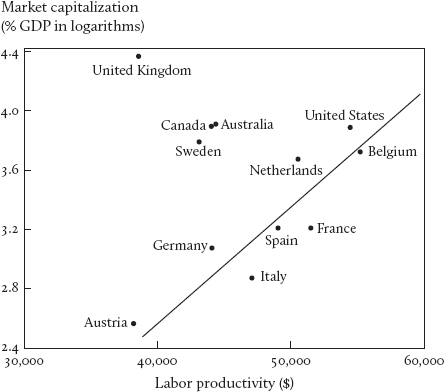
A piece of the mechanism has been detected. A country’s stock markets offer a clue to the dynamism of its economy. The current inventory of promising yet unexploited commercial ideas is a key kind of capital in the business sector of an innovating economy. The prospective size of this inventory in the near- or medium-term future, following the arrival of additional ideas, is a major determinant of the value of businesses in an enterprise economy: the larger this prospective inventory is, the greater the value of these business enterprises, and the greater, we may suppose, will be the capital market’s estimation of that value. That might be the only value of start-up companies in their first day of life, but not of companies in general. The other component of the value of enterprises is the equipment and plant owned by them—the physical capital. Hence the “market capitalization” of a nation’s enterprises, which is the value of the shares outstanding plus the bonds outstanding, taken as a ratio to the acquisition cost of the physical capital, is an indicator of how good the prospects for unexploited ideas are in relation to the physical capital stock. The same ratio, which came to be known as Tobin’s Q, was used by James Tobin, who saw it as an index of speculative fever or fear, to predict the ups and downs of a nation’s investment activity. For our purposes, taking the nation’s annual business output as a crude proxy for the physical capital, we construct the ratio of “market cap” to the size of business output and reinterpret that ratio as an indicator of how significant the prospective new ideas are in relation to the size of the economy or its business sector. Theoretically, this is a very natural indicator of an economy’s dynamism. In Figure 7.3, this hypothesis receives considerable support. We see that the market-cap-to-output ratio in a country is a surprisingly good predictor of its labor productivity some years ahead.
FIGURE 7.3 Market capitalization and labor productivity: business output per employed worker. Market capitalization variable measures the value of shares in the corporate sector in 1988. Labor productivity is calculated as business output per employed worker in U.S. dollars. The employment rate is the ratio of total employment to working-age population. (Sources: Morgan Stanley International; OECD.)
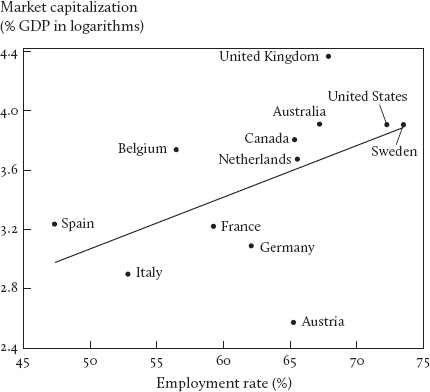
This wonderful ratio is an even better predictor of national employment a few years ahead, as Figure 7.4 shows.13 Remarkably, the size of the market-cap-to-output ratio in 1990 would have permitted one to forecast rather accurately the countries that rode the wave of the internet revolution arising in the second half of the 1990s. While it is intuitive that a relatively high rate of idea formation, in leading very probably to a high rate of innovation, tends to result in high productivity, a reader might wonder whether the path from high innovation to high employment is on safe ground. Might innovation destroy more jobs than it creates? It might at any given place and time. It may be that the phenomenal economic advances occurring in the 1930s hindered the climb out of the Great Depression more than they helped. But in the most common (and most studied) case, two positive effects are working. First, innovation in the form of new consumer goods or in the production of existing consumer goods, which tend to be capital intensive, by lowering their prices, lifts up the real value that firms making capital goods place on having added labor, just as it raises the value of the enterprises that make them; and that sparks new hiring. Second, when productivity is streaking ahead, pulling wages in its train, workers’ wealth feels smaller to them—it is smaller relative to their improved wages—so they are more willing to work, to move, and to take a chance on a different career. An innovation must be very labor-saving to overturn these effects.14
FIGURE 7.4 Market capitalization and employment rate: employment as a share of the working-age population. The market capitalization variable measures the value of shares in the corporate sector in 1988. Labor productivity is calculated as business output per employed worker in U.S. dollars. The employment rate is the ratio of total employment to working-age population. (Sources: Morgan Stanley International; OECD.)
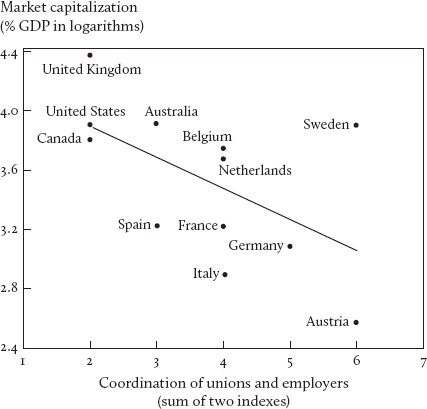
FIGURE 7.5 Coordination and market capitalization. Market capitalization is the value of shares in the corporate sector in 1988. The coordination variable is calculated as the sum of Nickell’s indexes of union and employer coordination for the years 1989–1994. (Sources: Morgan Stanley International; Layard and Nickell, Handbook of Labor Economics (1999).)
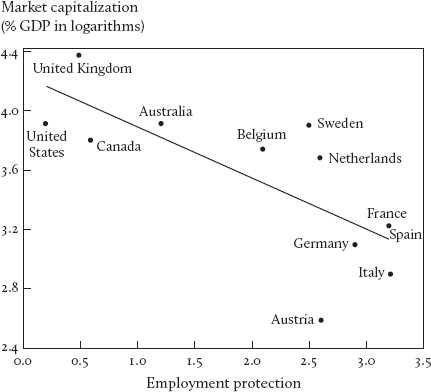
Now we ask whether some of the corporatist elements discussed above impact unfavorably on our market-cap-to-output ratio. One such element is the twin institutions so emblematic of corporatist economies—wage setting by labor unions and employer confederations. Figure 7.5 shows that an increase in coordination between unions and employers is associated with a decrease in the market-cap-to-output ratio. Another element of the relatively corporatist economies is the extremism of their EPL. The benefits and harms from EPL have been much studied yet with very little consensus resulting. Figure 7.6, however, is rather persuasive in indicating that, though the beneficiaries of protection may have appreciated it, there is an ill effect on the market-cap ratio, which, as just argued, reflects a decrease in the actual and prospective stock of innovative ideas. There are other elements of corporatism that line up rather nicely with low market capitalization, of course. But there would be little utility in proliferating additional correlations. It is time to sum up.
FIGURE 7.6 Employment protection and market capitalization. Market capitalization is the value of shares in the corporate sector in 1988. Employment protection is the number of months of salary that goes in mandatory redundancy payments. (Source: Morgan Stanley International.)
To the question, how did corporatist elements prevent countries from reaching American levels of productivity and employment, the answer in this chapter is that some of the corporatist elements slowed the inflow of new commercial ideas and that constriction of the inflow was a drag on the advance of productivity, which in turn imparted a drag on hiring, thus causing relatively low levels of employment as well. Thus, the relatively corporatist economies failed to deliver because they lacked something needed to enable, stimulate, and spur experimenting, exploring, and trying things out. Therefore their economies were missing the ingredients required for operating at the productivity frontier and thus for having high mean levels of employment.
Postscript: There is a puzzle outstanding. How did the Big 3 of continental Europe—France, Germany, and Italy—come as close as they did to catching up with the American economy in terms of productivity and in terms of employment (in Germany and Italy) if, as has been observed here and elsewhere, they suffered such a paucity of endogenous, indigenous innovation? One would think that if the growth of the Continent’s productivity was founded on its being behind the leader from whom all innovations flow, its growth would stop if somehow it caught up, just as greyhounds in a race would stop running if they were no longer behind the rabbit. (Greyhounds do not run for the fun of it.)
That is what happened. In the mid-1970s the American economy stopped running like a rabbit. Output growth had fluctuated around 4 percent annually from the mid-1950s to the mid-1970s—of which 3 percent was productivity growth and 1 percent employment growth. Then the Great Productivity Slowdown came in the mid-1970s. From 1975 to 2005, output grew at rates around 3 percent per year—relatively fast in the 1990s and relatively slow in the 2000s. With its growth engine having lost power, America was a sitting duck for catch-up by the rest of the world. A tendency to convergence arises as the leaders slow.
With America no longer producing the greater part of the world’s innovation, which it had done in the 1920s and 1930s, then again from the mid-1950s to the mid-1970s, Europe, devoid of indigenous innovation, had little choice but to slow likewise. Further, once operating at reduced speeds, Europe became more vulnerable. It felt the rise of competition from the nations emerging into the global economy far more keenly than it would have in its “30 Glorious Years”—the 26 years stretching from 1955 to 1980. Also, upon resorting to fiscal deficits to make up for slow growth, Europe became increasingly tangled up in public debt.
By the late 2000s the entire West saw its economic growth reduced to slow motion and its employment levels depressed as the boom, stimulated by massive tax cuts, new entitlements, and new subsidies, fizzled out, as it had to do.
1. The earliest treatment of this episode is the 1988 monograph by Jean-Paul Fitoussi and Edmund Phelps, The Slump in Europe.
2. The 2011 book by Vito Tanzi, Government versus Markets, provides expert discussion and helpful data.
3. Phelps, “The Importance of Inclusion and the Power of Job Subsidies to Increase It” (2000/2, p. 86). See also figure 1 in that report. The article adds that “in the first half of the 1990s France and Germany again compressed low-end pay and again saw the steep rise in unemployment of low-skilled labor (see Figure 2).” The paper set out the case for an approach to raising low-end wages that is more employment friendly, namely a system of low-wage subsidies to be paid to employers for their ongoing employment of low-wage persons. In presenting this paper at the OECD Secretariat in Paris, I was going into the eye of the storm. Participants applauded the proposal except the U.S. delegation, which saw the proposal as endangering the Earned Income Tax Credit, which was designed primarily to encourage low-income mothers to earn some of their own support.
4. No statistical analysis was done, surprisingly, until the paper by Darius Palia and Edmund Phelps presented at the 1996 Villa Mondragone conference of Rome’s Tor Vergata University. The conference volume, Paganetto and Phelps, Finance, Research, Education and Growth, came out in 2005.
5. Tanzi, Government versus Markets.
6. For these data see OECD, Going for Growth: 2007, a project led by Jean-Philippe Cotis. It might be suspected that these indexes of hindrances to innovation and to the conduct of business generally purport to measure the unmeasurable. However, the indexes are compounded out of concrete and measurable things, such as the number of days it takes to obtain a license to build a warehouse, which ranges from about 80 days in the United States and Canada to about 170 days in France and Germany and 284 days in Italy. It might also be wondered whether these differences among economies matter at all. However, a nation’s investment in information and communications technologies (ICT) exhibits a rather tight relationship to its product market regulation index. Nations’ unemployment rates have been shown to have some relationship to their EPL indexes.
7. The data can be found in Layard and Nickell, Handbook of Labor Economics.
8. This last ordering, dubbed the Index of Social Infrastructure, can be pulled off figure II in Hall and Jones, “Why Do Some Countries Produce So Much More Output per Worker Than Others?”
9. Early political philosophy touching on the scope of government is the subject of Andrzej Rapaczynski’s 1987 volume, Nature and Politics.
10. See OECD Economic Outlook, Annex table 24, Capital income shares in the business sector, p. 214.
11. Another point: Whatever the Continental and Anglo-Saxon productivity levels, measured by output per hour of labor, Continental productivity levels would be decreased relative to Anglo-Saxon levels if they were all measured by output per basket of labor and capital—the measure called multifactor productivity (or total factor productivity)—because Continental economies raise their output per labor ratios by investing more capital with which labor can work than Anglo-Saxon economies do. For this extra output, it may be argued, the Continentals must suffer the reduction in consumption levels required to meet the interest payments on the extra capital.
12. These OECD data are shown in Phelps, “The Importance of Inclusion” (2000/2); see figure 3a, “Trends in Wage Rate Dispersion, 1997.” The gauge here is the 50-10 ratio, that is, the ratio of the mean of the wage rates of workers one-tenth of the way up the population of employed persons, thus at the 10th percentile, to the mean wage rate at the 50th percentile. It is also known as the D1/D5 ratio.
13. See Phelps, “Reflections on Parts III and IV” (2003, figures 3 and 4).
14. It is often commented that employment will be falling if output is growing slower than productivity: the growth rate of productivity is the “stall speed” of the economy. That may suggest that a decline in productivity growth would have the silver lining of reversing the fall of employment. But little is known about the short-run effect of that on the direction of employment. It is known that there is no long-run, sustained link going from the productivity growth rate to the growth rate of employment; the latter is a matter of demographics. There are long-run connections between the level of employment and the productivity growth rate, as pointed out above. (Moreover, a drop in the productivity growth rate certainly would reduce the long-run growth rate of output.)