Markers of Post-1960s Decline
I called Silberman collect one morning … crazed on acid.… So what came up was this “Death of the American Dream” thing, and I thought, well, the best way to do that is to take a look at politics.
HUNTER S. THOMPSON, Songs of the Doomed
THE AMERICAN ECONOMY IS NOW QUITE DIFFERENT from the modern economy that was so scintillating over most of the 19th and 20th centuries. The central dimensions of performance—job satisfaction, un employ ment, and relative productivity—make this very clear. Data show deterioration setting in on all three fronts as early as the mid-1970s, with only a temporary uptick in job satisfaction in the last giddy years of the internet boom. A similar deterioration came sooner or later to the rest of the West: to Germany in the 1980s and to both Italy and France in the late 1990s. These nations, so lacking in indigenous innovation, could not prosper any longer on the back of the American economy when it was similarly lacking.
The secular deterioration of the American economy was at first a mystery. The torrent of women and young people entering the labor force from the late 1960s to the late 1980s caused some rise of unemployment and somewhat reduced wages, but the effects of such demographic shocks on productivity growth were surely transient. That the deterioration has been lasting suggests that the economy was undergoing a shift of its tectonic plates—a systemic, qualitative change.
Early Data on Diminished Performance
Although evidence of a serious slowdown of productivity in the American economy became unmistakable by the early 1970s, it had actually begun several years earlier, only to be masked by booming employment. In the fall of 1962, John F. Kennedy campaigned for the presidency with the slogan “Get America Moving Again.” Ironically, present-day data show that a discernible slowdown of productivity began around 1964 and gained force—off and on—until the mid-1970s. Productivity growth remained very slow until 1993, and after recovering nicely during the build-out of the internet, fell back to the snail’s pace set in the 1970s.
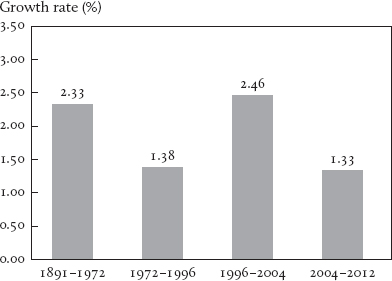
FIGURE 9.1 Average growth rates of U.S. labor productivity over selected intervals, 1891–2012. (Source: Robert J. Gordon.)
The anatomy of the productivity slowdown helps us understand it. There are two types of productivity. The more familiar is the relation between output and hours worked, called labor productivity. The growth rate of labor productivity is charted in Figure 9.1.1 For a great many decades, the growth rate of labor productivity averaged 2.33 percent per year until 1972. Since then it has averaged 1.57 percent. For a time, it could have been supposed that the rapid growth of hours worked from the early 1970s to the early 1980s had brought diminishing returns to labor. However, the underlying slowdown was marked by an even greater reduction of the growth rate of output per unit of capital, which could hardly be laid to larger labor inputs. We may as well cut to an amalgamated measure of the two: the growth rate of so-called total factor productivity or multifactor productivity, as previously defined in Chapter 7: roughly output per basket of capital and labor inputs. The growth rate of productivity is charted in Figure 9.2. The data show the growth rate of total factor productivity to have run around 2.26 percent before 1972 and then around 1.17 percent after 1972. The slowdown of total factor productivity is more severe. As Figures 9.1 and 9.2 suggest, the slowdown was put in doubt by the productivity speedup during the years of the build-out of the internet, but since then the growth rate has been even worse than before the internet years.
FIGURE 9.2 Average growth rate of multifactor productivity over selected intervals, 1922–2011. (Source: Robert J. Gordon.)
By 1973, when the fall of the growth rates was already pronounced (and on its way to becoming even more so), a towering rise of the un employment rate began—from lows of 3.4 percent over much of 1968 and 1969 to a high-water mark of 9.0 reached in May 1975. The rate averaged 6.6 percent in 1972–1981 after two decades when the average was 4.6 and the non-war years from 1900 to 1929 when it was 4.95. The urban unrest in this period was extraordinary. Sharp rises in oil prices in 1973 and 1979 added fuel to the fire, but they proved transitory (in inflation-adjusted terms). In the next three decades the unemployment rate averaged 6.3 percent: 7.0 in 1982–1991, 5.4 in 1992–2001, and 6.5 in 2002–2011. The increases in unemployment in European nations during this era were comparable. Throughout the West, heightened joblessness was as emblematic of the era as slower growth of productivity.
Are the fall in growth and the rise of unemployment cause and effect? Two decades of observing a variety of economies, some still quite modern and some no longer modern if they ever were, suggest a systematic connection from the slowdown to the joblessness. Starting from levels below the American level, the unemployment rate in the United Kingdom climbed above the American level in the early 1980s; the rate in France climbed further above the American level later in the 1980s; and the rate in Germany climbed further still by the mid-1990s, as The OECD Jobs Study (OECD 1994) records. Correspondingly, the decline in the growth rate of productivity was greater in the United Kingdom than in America, still greater in France, and greatest in Germany. So slower growth was systematically followed by increased unemployment, a fact uncovered in a 1997 paper by Hoon and the present author.2 (It was so clear in the minds of journalists that they began to use “growth” as a synonym for high employment. It took the “jobless recovery” of 2010–2011 to break the habit.) It is noteworthy that the growth connection was very tight despite the fact that the slower growth in Europe had origins different from those in the United States. Still, the 1930s saw blistering productivity growth in America alongside a depression of employment—the Great Depression. (And economists remind us that high innovation is liable to create some frictional unemployment.) But that mass unemployment cannot plausibly be laid to rapid productivity growth; other monetary and nonmonetary forces pushed up unemployment. Unemployment might have been worse without that productivity growth—without men laying electric cable across the land.
Three mechanisms connect employment to the rate of innovation. One of these is direct. A firm raises prices and lowers employment if it expects a reduced threat of new products or new methods to come from new or old competitors.
The second mechanism connects a firm’s employment to its own innovation prospects. If it expects its productivity to be growing at a reduced rate, it will place a reduced value on each additional employee it hires. (The fall in the growth rate is like a rise in the interest rate.) That will lead the firm to cut back its hiring.
The third mechanism works through wages and wealth. The simplest setting is an economy in which output is produced by labor without any physical capital; its capital is the investment companies have made in transforming new recruits into production-ready employees, as in the Hoon and Phelps paper. Here an increase in the productivity of labor would raise labor demand—that is, it would raise the wage that employers are willing to pay a given work force—and that, taken alone, would pull up employment and the going market wage. What if, after a long period without any change, the technology is suddenly improving, so that output per man is suddenly on a rising trend? The wage will then likewise start rising, and employment will be pulled up at least for a while. But how far? What matters for employment is the wage relative to wealth—the value of households’ shareholdings. As levels of productivity and hence income go higher, saving per year will be correspondingly higher, so wealth will be rising. And the increase in household wealth will contract labor supply: it raises the wage required by workers so that it pulls employment down and pushes the wage up. Yet wealth is not going to grow large enough to bring employment back down as long as wealth has not caught up with the wage. And if productivity and the wage go on increasing steadily, wealth will never catch up to wage. (There is a phase, then, in which wealth, while rising, will be falling relative to the wage; that phase ends when the wage-wealth ratio is so elevated that wealth, though reduced as a ratio to the wage, is at last growing at the same rate as the wage.)3
Hence, a decline in productivity growth in the American economy and in some others can be seen as having two deleterious effects on employment and unemployment. First, when the pace of productivity growth slowed, saving did not drop, so wealth did not slow at first: as a result, the ratio of wage to wealth, which had reached a postwar high of .38 by 1968, fell over the 1970s to .32 in 1980 and to .29 by 1990. Disgruntled with their wages, many demanded higher wages—else they would retire or look elsewhere. (The corresponding swelling of the wealth-to-wage ratio boosted consumption relative to income as well as wage demands: consumption rose from about 62 percent as a percentage of domestic output in 1970 to about 69 percent in 2001.) See Figures 10.2a,b. Second, as the lowered expectations for growth of profitability lowered valuations of business assets—employees and customers included—share prices turned down sharply in 1968; as poor results reinforced the lowered expectations, shares did not level off until 1974. Reduced employment resulted. Workers in consumer goods industries, finding themselves devalued as a business investment by employers, would have had to accept a much reduced real wage to salvage their jobs, and many of these workers would not have accepted lower real wages, since their real wealth had largely held up or had not so dramatically fallen. Similarly, workers in capital goods industries, finding that the market value of their output was depressed, would have had to accept a steep real wage cut if they were to hold on to their jobs. Yet some degree of gradual recovery is normal as wealth falls, though a full recovery of wages and employment from a such structural shift cannot be expected.4 Share prices ultimately regained their 1968 level in 1992. But the opportunities of the labor required to produce additions to the capital stock had improved by 1992—thus the opportunity cost of labor in producing capital goods was greater by then—and 1992 workers had much greater wealth than they had in 1968, so many had to be paid more to stay on.
Does all this imply the paradox that saving is bad? No. Acts of saving are necessary to finance investing and projects aimed at innovation. Current stocks of capital and hard-won knowledge are proud monuments to people’s savings. Yet this wealth makes additional investing and innovating harder by reducing people’s need to save and work in the future. Normally, productivity growth brought by saving helps an economy to “grow out” of the wealth that saving brings. But when innovation is nil or weak, saving brings less and less productivity growth, so the economy cannot go on growing out of the wealth that saving has brought.5 The cause of the slump and the accompanying malaise, then, was the sustained and still prevailing slowdown of total factor productivity—known also as multi-factor productivity. And this slowdown can only be laid to a contraction of indigenous innovation, since grassroots innovation—not scientific advance—was the main source of innovation in America from the 1830s to the 1960s.
A concomitant effect of the decline of innovation was a reversal of the gains in inclusion that innovation had brought. When prosperity comes to a region, it is the marginal workers and the marginal properties that see the largest gains—even going from a zero level to a positive level. Likewise, depression visits the worst damage in percentage terms on the marginalized in society—not the advantaged or the wealthy. This development was to become an increasing part of the discussion in subsequent years.
In summary, investment activity of all kinds—investing in new machines, new employees, and the like—and the innovation that underpins investment provide the force essential for high employment as well as growth of labor productivity. The waning of innovation was largely behind the increased joblessness and downward pressure on wages that have been endemic to the post-1972 period.
Policy reactions and other feedback. The policy reactions to the decline of growth and the rise of unemployment—and the subsequent failure of those policies—are a major part of ensuing events. It was apparent by the 1980s that productivity growth was still slow, with no hint of when, if at all, fast growth would resume. Businessmen stopped banking on the fast productivity growth of previous times. (An employee today would not be a super-employee in the future.) Economists and politicians understood that to engineer a sustained lift of total factor productivity growth by as much as it had fallen would require moving mountains, but no one knew which ones to move. However, they could consider steps that would offer prospects of symptomatic relief: medicine for swollen unemployment and for the disproportionate privations among the less advantaged.
In 1981, Ronald Reagan, just elected president and keen on the prescriptions of supply-side economics, wanted cuts in income tax rates across the board, believing they would boost employment by raising people’s incentives to join the labor force and to work hard in hope of better pay. He also proposed tax credits to business for their investment outlays. (More investment in plants and equipment, while not raising total factor productivity, would increase growth of output per unit of labor.) In those times, fiscal responsibility in the Congress was not as elastic as it had become by the 2000s. Kennedy’s tax cut bill had been enacted by the grieving Congress after his assassination. Rather similarly, Reagan won passage of the tax cut bill after he was shot in an assassination attempt. (Tax loopholes were closed with the hope of bringing in nearly as much revenue as the rate cuts would lose—thus achieving so-called tax neutrality.) With the Reagan cuts, the unemployment rate rose some more, peaking at 10.4 percent in 1982, before falling to 5.4 at the end of 1989.
In 1989, George H. W. Bush, just elected and suspicious of supply-side economics—he once called it “voodoo economics”—wanted to address the lingering fiscal deficits. When in 1990 Democrats refused to agree to expenditure cuts, the Congress voted and Bush signed into law a 1990s bill increasing tax rates. The unemployment rate began rising in mid-year, reaching 7.5 in 1992, then shrank to 6.1 in 1994. When in 1993 Bill Clinton took office, thinking changed: his advisers argued that budgetary surpluses would create more jobs within a few years than they would destroy in the meantime. In any case, the second half of the 1990s saw the internet revolution and the dot.com boom. Then, in 2001, with joblessness heading up again, the newly elected George W. Bush, subscribing to the supply-side model, pushed through income tax cuts in 2002, then the invasion of Iraq and the expansions of entitlements in 2003, and finally measures to heat up the housing boom. Yet the boom did not last, and unemployment grew higher than before. (That massive numbers of baby boomers were absorbed into the economy—upping the employment-population ratio from 58 percent to 60 in the 1970s, 60 to 63 in the 1980s, and almost 64 in the 1990s—is evidence of effective labor market institutions.)6
Evidently, even in those years of initially low public debt, Keynesian stimulants to consumer demand and supply-sider fillips to the supply of labor could not push back the tide of slow growth and enlarged unemployment. This is not to say that every effort was futile, only that the action taken could bring temporary relief but little lasting benefit—and less benefit over cost, if any.
Fallout: Inclusion, Inequality, Job Satisfaction
A setback of another kind started toward the end of the 1970s and grew until the early 1990s: a decline of economic inclusion. This “inclusion” generally refers to the relative unemployment rates and the relative wages among the disadvantaged. A rule of thumb has long been that the unemployment rate of disadvantaged groups is nearly twice that of the rest. A setback in relative unemployment rates was not evident over this period. However, there was a widening gap between the lower reaches of the labor force and the middle strata of the labor force in terms of wages—the magnitude of which is captured by the 10-50 ratio: the size of the wage earned by workers found 10 percent of the way up the distribution as a ratio to the wage of workers found 50 percent of the way up (better known as the median wage). The decline in the position of low-wage men was particularly deep. In the 1940s, the position of low earners relative to median wage earners improved strikingly—men included. Yet this era of improved wages for workers at the low end of the spectrum sputtered out in the last quarter of the 20th century. Low-wage men in fulltime jobs fell farther behind the median earners by 9 percent in the 1970s and by another 10 percent in the 1980s. They lost ground at about the same rate in the early 1990s and stabilized in 1995. As a result, the relative wage of low-wage men by the mid-1990s was about 20 percent below its 1975 level.
Since the wage gap was rising markedly by the late 1970s, a few scant years after the slowdown took hold, it is natural to suspect that the productivity slowdown was behind the widening of the gap. The links from the former to the latter are still rather speculative, though not improbable. Much has been made in this book of the point that innovative activity itself, quite apart from its stimulating higher valuations of capital goods and thus driving productivity, wages, and employment onto a steeper path, generates jobs directly, since product development, marketing, and evaluation are apt to be quite labor intensive. But the phenomenon for discussion here is the decline in the wage going to low-wage workers relative to the median wage. The answer could be that the emergence of high-tech systems—ICT systems—raised the skill requirements for most business innovating. Steve Jobs had to acquire an understanding of these technologies to be able to judge well whether some new product would be feasible. The new high-tech systems also required more highly skilled workers for their operation. In short, rapid innovation has been the problem. But the data on the productivity slowdown suggest that, in the economy as a whole, the rate of innovation sagged from the mid-1960s onward and recovered only partially in the sub-period 1996–2007. Imagine the misery if innovating had kept to its rapid pace! A more realistic hypothesis is that companies innovating or adopting innovations are constantly driving down the costs of what they make, and when the innovation stops, their prices stop falling—at a cost to disadvantaged workers and most of the working class.7
The U.S. government made efforts, starting in the 1970s, to roll back or contain this increase in inequality. Prophetically, Rawls’s Theory of Justice opened the decade. He argued for a conception of economic justice that would require the state to intervene with subsidies or other tools to raise the lowest wage rates as high as it could raise them. A few years later, Wilbur Mills in the House of Representatives led the way to passage of the Earned Income Tax Credit (EITC) in 1975. Those with low wage earnings for the year could take a credit against future taxes owed. Seven hundred dollars might turn into a thousand. This measure was just in time, as the wages earned by the bottom tenth slipped in the late 1970s and continued to do so until the early 1990s. The 1985 Reagan Tax Act amended the EITC, making it more biased toward working families with dependent children than it was at the outset, and therefore it became more of a child raising subsidy than a work subsidy. In any case, the annual expenditure never approached even 1 percent of GDP.
The efforts to address inequality were mainly directed not at raising earnings and thus stirring people to help themselves by continuing to work—Smith’s “self-help.” They were directed at providing economic support of low-income persons whether or not they were employed. The modest flow of income from the EITC was a drop in the bucket next to the sums a low-income person was provided in food stamps, Medicaid, low-income housing projects, aid to mothers of dependent children, disability benefits, and many smaller programs, all of which added up to a massive flow of income compared to the wage they could earn. OECD data record that “social transfers” in the United States grew from 7.26 percent of the GDP in 1960 to 10.21 in 1970. But in the 1970s these transfers grew to 15.03 percent, thus almost matching the United Kingdom, then grew to 21.36 percent in the 1980s, far outstripping the United Kingdom. As the slowdown remained, so did the trend in social benefits. Data from the U.S. Census Bureau record that the percentage of the population living in a household receiving some government benefits climbed in a virtually straight line from 29 percent in 1983 to 48 percent in 2011. Hence the income from not working skyrocketed as low-end pay for work stagnated:
The entire bottom decile earned only $15 billion in 1990, which is about $1,200 per person. (This compares with economy-wide earnings per member of the labor force that year of about $25,000.…) How could 12 million workers have survived on so little? In large part the answer lies in the scale of welfare payments, particularly [but not only] those for which active and potential workers are eligible.… Total public spending for Medicaid, food stamps, housing benefits, and supplementary security income, all of benefit to the employed, came to about $150 billion that year. Thus the income received under current entitlement programs dwarfs the wage income of those in the bottom decile. We have here a measure of their dependency: they earn only a small fraction of the total income (cash and in-kind income) they receive. But removing the support of the welfare system would not make them independent.… [T]hey would still be dependent, their dependency shifting to relatives and charities.8
Thus work was seriously devalued. No wonder fewer low-wage people found it convenient to work in a fulltime job or any job.
Another response of the policymakers in recent decades was the near-abolition of taxation in the lowest 40 percent—essentially the lower half of the population. Those who did choose to work, mostly people farther up the wage ladder, were taxed at rates that are lower than almost any other country in the Western world: very nominal tax rates on income, no tax on the ownership of residential property, no federal value-added tax, and so on. By running a huge budgetary deficit on the lower half, the government had very nearly scaled after-tax wages, wealth, and consumption back to the size they would have had in the absence of the decline in their relative wages. Yet this policy did nothing to restore the lower half’s integration in society and their sense of self-support through the earnings from their contribution. The country’s lower half went from running their careers but having no share in running or monetarily supporting the government to having no careers but a say in the running of government without sharing in the cost of it.
But all these efforts of the state to redress the damage where it could be seen and treated to a degree were superficial. The economy had fundamentally changed. Furthermore, even if the tax credits, the social expenditures, and the tax cuts had been enduringly effective in reducing unemployment and inequality back to their initial levels, there would have been a problem. If the economy was weighed down by diminished innovation, the satisfactions of economic life would likely have been depressed too. The policy measures were not of a nature to treat the effects of the slowdown on the texture and experience of economic life.
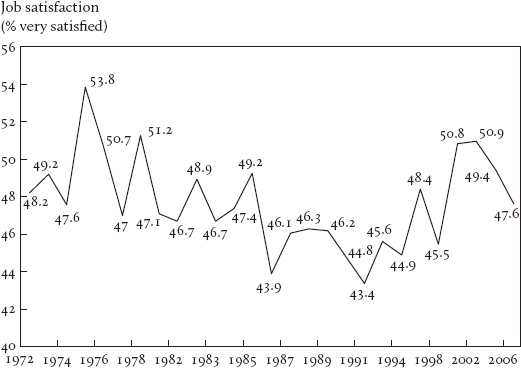
The losses in job satisfaction and the issue of job security. Job satisfaction did in fact suffer a significant decline in the new era of slowdown. In theory, with new products and methods coming up much less rapidly after the early 1970s, especially new methods and products that were the fruit of indigenous grassroots imagination, we would expect that work in the business sector soon became much less rewarding than previously; so data on the trend of job satisfaction provide a test of the thesis of important economic deterioration. It should not be surprising that, among all the many questions about job satisfaction asked by the several household survey organizations, some of the responses show no downward trend after the early 1970s. But overwhelmingly, the surveys found a marked decline. Surveys by Gallup and Ipsos-Reid asked, “Do you enjoy your work so much that you have a hard time putting it aside?” The percentage that said “yes” was 51 in 1955, 33 in 1988, and 23 in 2001. Roper asked, “Is work the most important thing and the purpose of leisure to recharge batteries … or is it leisure?” The percentage saying “work” was 48 in 1975, 46 in 1985, 37 in 1995, and 34 in 2000. Finally, Gallup asks whether you are “satisfied or dissatisfied with your job/the work you do.” The percentage saying “satisfied” averaged 86 around 1966, was 77 in 1973, 70 in 1984, 73 in 1995, and 70 in 2001.9
The analysis of job satisfaction data from General Social Surveys by David Blanchflower and Andrew Oswald, pioneering economists in investigating job satisfaction data, likewise confirms “a small but systematic” downward trend across the period. Blanchflower and Oswald point out that this is a start ling result precisely because physical working conditions steadily improved over the decades in question. The trends are not very different between men and women.10
One might wonder whether the downward trend in job satisfaction reflects only some ill effects on morale or on the worker-employer match resulting from the shift to higher unemployment rates following the great slowdown. After all, the unemployment rate shot up to 10.8 percent in November and December 1982—the worst months in the campaign to slay the dragon of inflation. However, the decline is barely less steep when we restrict our attention to the (increasingly rare) years when the unemployment rate was as low as that in the early 1970s.11
FIGURE 9.3 Job satisfaction in the United States, 1972–2006. (Source: David Blanchflower and Andrew Oswald.)
Declining job satisfaction was not confined to America. Although internally generated innovation in Western Europe, which had been a large source of job satisfaction there, had paused in the 1940s and finally died in the late 1950s, the flow of designs for new products and blueprints for new methods coming into Europe from overseas, largely from America, had been filling the gap with little let-up from the late 1950s to the late 1970s, thus providing jobholders with a modicum of job satisfaction in those years. But America’s slowdown in the 1970s and the Continent’s running low on overseas ideas in the 1980s sharply reduced opportunities for job satisfaction in Continental workplaces—just as it reduced available jobs. So we should be prepared to find that Europe experienced a moderate decline in job satisfaction in the 1980s—a lesser decline since it had less to lose. In fact, drawing on the earliest and smallest wave of data collected by WVS in 1980, we see that Britain suffered a serious decrease of job satisfaction from 1980 to 1991 and an equal decrease from 1991 to 2001. Italy suffered a decrease from 1980 to 1991, and Germany a smaller one. Ultimately, Europe’s own productivity had to slow down. Italy went into a sharp productivity slowdown around 1997 and France in 1998. (France enjoyed an upswing of job satisfaction between 1991 and 2001 but a decline in the 2000s.) Germany has had recurrent periods of slow growth since 1984.
Many suppose the loss in reported job satisfaction reflects a loss of job security. Those who only think of security would suppose that. So do some who take a broader view: Several experts in household surveying suggest that job security is a part of job satisfaction. Their thinking seems to be that if you draw immense satisfaction from “the work you do” and something makes you fear you will lose it, you will say you are dissatisfied with your job! (But wouldn’t it then be more accurate to say that your economy is dissatisfying?) At least one survey directs respondents to include their feeling of job security in their reported job satisfaction by presenting it to them as one of three or four components of what the survey defines as job satisfaction. Do we see a statistical correlation between job satisfaction and job security? One can be seen if enough underbrush is cleared away. But that statistical relationship may not be causal, running from security to satisfaction. Low job satisfaction and low job security may be a feature of economies with large numbers of low-level jobs. Job security is not sufficient for job satisfaction: Hungarians report great job security but miserable job satisfaction. In any case, the historical data of the era of diminished performance do not show significant downward trends in job insecurity—in the perception of precariousness. Gallup reports that the percentage of U.S. jobholders “completely satisfied” with the “job security aspect of your job” went from 45 percent in 1989, the first year of the survey, to 55 in 2002 and again in 2006. (These data, drawn from the AEI compilation of job satisfaction data, do not go back further.) The General Social Survey reports that the percentage who felt it “not at all likely” or “not too likely” they would lose their jobs or be laid off in the next 12 months fell insignificantly: from 91 percent in 1977–1978 (the earliest data available) only to 89.5 in both 1990–1991 and 1994–1996. The percentage who felt it was “very easy” or “somewhat easy” to find another job with the same remuneration went from 59 percent in 1977–1978 up to 60 percent in 1990–1991, then down to 57 percent in 1994–1996.12 It appears that the lost dynamism caused little insecurity.
In fact, there was little basis for supposing that the loss of dynamism would cause increased insecurity. With productivity growing more slowly, one would suppose that Schumpeterian “job destruction” fell along with “job creation.” And the evidence confirms the prediction. In 1989, 8 percent of jobs were measured as destroyed, while the percentage destroyed fell to the 7s in 1992–2000 and to the 6s in 2002–2007.13 This may seem improbable, but it is not. Job insecurity is heightened in recessions. But the two long stretches in the 1990s and the 2000s each came after a recession. In recoveries and even in flat times, jobs are not particularly prey to destruction—even if the previous recession has left employment depressed—since the storm and its destruction have passed: the loss of dynamism and the wave of dismissals, while not reversed, are over for the foreseeable future.
A new development in the era of diminished performance was the onset in the 1990s of a structural shift from manufacturing to services and to finance. Employment in heavy industry—in durable goods manufacturing—started and finished the decade at 11.5 million persons. The number employed in non-durable goods manufacturing, though, fell from around 7.2 million to 6.7 million by 2000. Since manufacturing is worker intensive, especially intensive in workers without a college education, the shift of expenditure to the other sectors did not create enough new labor demand to absorb the loss of old labor demand. A full recovery of employment would have required a much greater level of total output. The insufficiency of the output rise for a full recovery of employment came to be known as a “jobless recovery.” The decline of manufacturing steepened in the next decade—the 2000s—as a result, in part, at any rate, of increased imports from China. For awhile, however, the boom in construction soon took up the slack and more. (Resources for a rise in domestic investment—in construction expenditure—were made available by a shift from buying domestic products to products imported from China, with no change in domestic saving. When the latter decreased and the boom increased, all that was necessary were counterbalancing increases in the import surplus—fewer exports or still more imports from China.)
Last, but not least, in the era of reduced performance is the greater fluctuation of employment. The tendency toward elevated unemployment has been noted, but job separations and the resulting dislocation are another dimension of economic performance. The era produced five downswings in little more than three decades: the recession of 1975 (when the monthly unemployment rate brushed 9.0 percent), 1982 (when the rate hit 10.8), 1992 (when the rate hit 7.8), 2002–2003 (when the rate hit 6.3), and the Great Recession of 2008–2009 (when the rate touched 10.1). It is fair to infer that the post-1972 economy became more recession prone. A familiar explanation draws an analogy to the bicyclist who is more likely to go off course when forced to go at a slow speed. While a slowdown of innovation is apt to be the cause of a slowdown of productivity and hiring, a recent paper makes the point that companies are apt to draw back from an innovative venture when, on top of the possibility that the new product may fail because it is rejected in favor of other products, there is the strong possibility that the demand will be critically weak because of another recession.14
The violent slide of 2008–2009 is in a special category not because it is the deepest of these, which it is not, but because it became the prelude to the protracted slump from which the economy is emerging only haltingly. (In contrast, the 1933–1937 recovery from the Great Depression set a speed record for rate of recovery. But deep troughs often reflect overshooting, not fundamentals, and thus are followed by a period of high-speed recovery.) Yet all the recoveries from the aforementioned recession were unusually protracted. The bicycle explanation argues that a rapidly growing economy is more robust to recessions, just as a bicyclist going at high speed is quicker to get back on track. In the 1949 recession, at a time when the American economy was gaining back the rapid growth of old, the unemployment rate, after peaking at 7.9 percent (up from 3.7 a year earlier), was back to 4.2 in just a year. In the 1975 recession, after peaking at 9.0 percent (up from 5.1 a year earlier), the unemployment rate took 3 years to fall back to 6.0. It is fair to infer that in the post-1972 era America’s recoveries from downswings were much more protracted than they were in the golden years 1950–1972. Even in the high-growth period 1920–1941, the American economy was not highly recession prone or chronically in great flux: it suffered its steep downswing following the speculative excesses of the late 1920s, a downswing exacerbated by policy errors.
The set of actions that caused the 2008–2009 collapse to be so powerful are widely known: government actions aimed mainly at widening home ownership, unsophisticated efforts to make a profit on the naïve speculation that housing prices could only go higher (long enough to sell), fraudulent practices of mortgage originators, big banks greatly leveraging their capital by borrowing huge sums with which to bundle mortgages into packages to be sold to banks overseas—“originate and distribute”—and other practices.15
Yet the 1975 and 2008–2009 downswings and many of the other stresses of the era we are examining show the influence of many households stretching thin their income by drastic cuts in saving, the national economy stretching its national wealth by borrowing heavily from overseas, and, not least, the government stretching thin its revenues by borrowing heavily and deploying one ingenious measure after another to pump up investment, output, and employment in ways that would prove unsustainable and thus disappoint expectations. Through it all there has been a dogged denial of the era of slowdown and thus refusal to make a sober reckoning of the domestic consumption that the future would make possible. The result was a sick society, an electorate to whom political leaders did not dare to speak the truth. This state of affairs need not have followed the Great Slowdown. One could not have predicted that the slowdown would send society into a manic mode leading inevitably to speculative excess. (It could have sent the society into a mode of depression and paralysis.) In any case, it is important that we understand why the slowdown took place and what best we can do to end it.
1. The calculations in Figure 9.1, based on standard data from the U.S. Commerce Department, and the very effective organization of the chart were set out by Robert J. Gordon. Figure 9.1 is Figure 4 in Gordon, “Is U.S. Economic Growth Over?” (p. 13). He kindly provided to me for use here the further calculations, based on the same data set, shown in Figure 9.2.
2. A simple analysis measured a nation’s slowdown by the decrease of the growth rate from 1950–1970 to 1970–1990. See Hoon and Phelps, “Growth, Wealth and the Natural Rate” (1997).
3. This argument is along the lines of Hoon and Phelps, “Growth, Wealth and the Natural Rate.” Households will be enjoying rising profits alongside the rising wage, but that does not alter the conclusion: saving does not jump, so wealth falls behind the wage. The implications are clouded if households extrapolate the observed income growth into the future: Then consumption would jump, saving would drop, and the drag on wealth adds to the rise of the wage-wealth ratio. Yet the sense of future riches—of increased “expected wealth”—operates, considered by itself, to boost “expected wealth” and thereby to encourage increased consumption and decreased work. However, the analysis in the text could still carry the day.
Once the argument is broadened to economies using physical capital for production as well as labor, real complications arise. Declining labor requirements and declining capital requirements have different results. Falling labor requirements in producing capital goods would exert a downward push on the relative price of the capital goods, which would reduce the wage that these industries would be able to pay but also reduce the wage that households would require. Falling capital requirements in producing consumer goods would raise relative prices received in capital goods industries, thus boosting the real wage in the latter labor-intensive industries while also raising wealth.
4. In some conventional representations of the economy, all products are produced with the same method or recipe, capital goods and consumer goods alike. A fall in the valuations put on capital goods—plant and equipment—in some use does not cause total employment or the real wage to be depressed in the long run: The idled quantities of capital and labor finally regain their use and regain their rental and wages in parts of the sector where relative prices did not dip. But in fact consumer goods production is, generally speaking, relatively capital intensive, unlike capital goods, not to mention the capital firms have invested in employees. In two-sector economies, for example, the relative, or real, prices might fall over a great range of the capital goods sector, owing to a slowdown of the productivity in the consumer goods sector or a slowdown (or possibly a speedup) of the productivity of labor in the capital goods sector. Then workers in the capital goods sector will face the problem that most of the consumer goods producing sector is relatively capital intensive, much of it dramatically so—as Hitchcock impressively illustrated in North by Northwest, where on the vast cornfield there is no labor in sight, only the Cary Grant character looking out of place. So labor can find work only at a wage so reduced that some workers with high wealth levels may not accept it. In Phelps, Structural Slumps (1994), this model, the customer market model, and the trained-employee model offer escapes from the conventional model.
5. The question of which did the worst damage, the slowdown of labor productivity or the rare fall of capital productivity, would be difficult to answer. Some observers have made that discussion all the more difficult in claiming that there was a speed-up of innovation in new information and communication technologies (ICT), which raised labor productivity in making transistors, semiconductor chips, and other capital goods used in making consumer goods; and this productivity increase pulled up real wages and thus employment. Of course, no employment boom is apparent in the aggregate data. Yet such a spurt of labor’s physical productivity in producing capital may very well have occurred. However, a speed-up in the productivity of labor in making capital goods, if it occurred, might not have been a force in the direction of raising “total output” and real wages at all: productivity advances in the production of semiconductor chips and other capital goods could have driven down the prices of the capital goods produced by enough to be a force for lower real wages and employment. So productivity gains in capital goods industries may have contributed to the reduction of real wages and increase in unemployment (relative to trend)! But aggregate technical progress almost stopped between 1968 and 1978, so it would be odd to blame such progress for the slumping economy. (A related paper that explores some of these insights in its beginning pages is Hoon and Phelps, “Effects of Technological Improvement in the ICT-Producing Sector on Business Activity.”)
6. These fiscal experiments have inspired a basic proposition in public finance: when an income tax cut increases the after-tax wage, which makes work more attractive in the normal case, saving goes up (not just consumption); so wealth rises faster until it catches up to the after-tax wage, after which work no longer looks more attractive. Leaving aside the effect of whatever uses the government would have put the lost revenue to, across-the-board tax cuts have no long-lasting effect on unemployment—only a lasting effect on the fiscal deficit. See Hoon and Phelps, “Payroll Taxes and VAT in a Labor-Turnover Model of the ‘Natural Rate.’%”
7. Another possibility is that productivity slowed down in the consumer goods industries, which slowed the decline of consumer goods prices relative to capital goods prices, while productivity in the capital goods industries actually increased, which slowed the rise (or caused a fall) of capital goods prices relative to consumer goods prices. Both developments would lower the path of prices—relative to the past trend—for the goods that low-wage labor had the greater stake in, namely, capital goods. Similarly, it is shown in a recent paper that a technical improvement in the ICT-producing industry, in lowering the real price of ICT equipment, reduces the “demand wage” employers will pay, thus lowering employment as well as the real wage. See Hoon and Phelps, “Effects of Technological Improvement in the ICT-Producing Sector on Business Activity.”
8. Phelps, Rewarding Work (1997, p. 23). The book discusses how the devaluation of work might be reversed.
9. See the valuable compilation of several survey results in AEI Public Opinion Studies, The State of the American Worker 2009: Attitudes about Work in America, updated August 21, 2009. http://www.aei.org/publicopinion17. Of the half-dozen surveys, two recorded no decline of job satisfaction between the early 1970s and the early 1990s. The National Opinion Research Center asked whether “work gives a feeling of accomplishment.” The percentage saying “yes” showed no trend between the mid-1970s and the early 1990s, then a drop-off in the 2000s. Asked by Harris Interactive “how satisfied are you with your job—very satisfied, somewhat satisfied …,” the percentage saying “very satisfied” was 59 in 1974 and the same in 1984 (after dipping to 45 in 1978). The later percentages were lower: 46 in 1994 and 49 in 2002.
10. Blanchflower and Oswald, “Well-Being, Insecurity and the Decline of American Job Satisfaction.” The authors comment that the last finding “might be viewed as unexpected because of a presumption that gender discrimination has dropped over the last few decades.”
11. Of those over age 30, asked by General Social Surveys, “How satisfied are you with the work you do?,” the percentage replying “very satisfied” was 54 in 1972 (when the yearly unemployment rate was 5.6 percent), 51 in 1988 (the year when the unemployment rate recovered to 5.5 percent), and 47 in 1996 (a year with a 5.4 percent unemployment rate—the new normal of that era). Blanchflower and Oswald, “Well-Being, Insecurity and the Decline of American Job Satisfaction” (table 1B). This development is presented in Figure 9.3.
12. Blanchflower and Oswald, “Well-Being, Insecurity and the Decline of American Job Satisfaction” (1999, table A1, a and b). It is only the most secure who felt a noticeable loss of security. The percentage who felt it “not at all likely” they would lose their jobs or be laid off in the next 12 months went from 68.5 percent in 1977–1978 to 64.5 percent in 1990–1991 and on to 62 in 1994–1996.
13. These data were reported in Business Dynamics Statistics, a product of the U.S. Census Bureau that measures business openings and closings, startups, job creation, and job destruction by firm size, age, industrial sector, and state.
14. Aghion and Kharroubi, “Stabilization Policies and Economic Growth” (2013). If it is expected the economy is heading down, the cost of innovation is still high, but the future benefit, if the effort achieves an innovation, will be reduced. Symmetrically, if the economy is thought to be on the uptick, the cost of innovating is still low and the benefit contingent on success will be high.
15. The epilogue is a vehicle to take up the degradation of the financial sector that developed in the past decade and the new policies needed from the perspective of this book. The body of the book focuses on the questions raised by a well-functioning modern-capitalist economy—questions about stability, economic inclusion, and especially unemployment, and kinds of inequality; the questions raised by diminished economic dynamism, which even an economic system free of malfunctions can suffer; and the question of whether modern capitalism is politically sustainable and morally justifiable.