Use RRDtool to easily generate graphs for just about anything.
You might be familiar with graphing bandwidth usage with tools such as MRTG. From a security standpoint, graphing bandwidth usage is useful because it can help you spot anomalous behavior. Having a history of typical bandwidth usage gives you a baseline to judge activity. This can make it easier to determine if somebody is performing a DoS attack on your site, or if a machine on your network is acting as a Warez depot.
RRDtool
(http://people.ee.ethz.ch/~oetiker/webtools/rrdtool/) provides functionality similar to MRTG, but it is much more flexible. RRDtool is basically a tool for storing data in a general-purpose database that will never grow in size. RRD stands for round-robin database
, which is a special type of database that maintains a fixed number of entries: the oldest entry is constantly being replaced by the newest data. RRDtool also has the ability to generate graphs of the data contained in this database.
The most common use of RRDtool is to make pretty bandwidth graphs, which is easily done with RRDtool and snmpget , a utility that queries devices managed with SNMP. First, you’ll need to create a round-robin database by running a command similar to this one:
$ rrdtool create zul.rrd --start N \DS:de0_in:COUNTER:600:U:U \DS:de0_out:COUNTER:600:U:U \RRA:AVERAGE:0.5:1:600 \RRA:AVERAGE:0.5:6:700 \RRA:AVERAGE:0.5:24:775 \RRA:AVERAGE:0.5:288:797 \RRA:MAX:0.5:1:600 \RRA:MAX:0.5:6:700 \RRA:MAX:0.5:24:775 \RRA:MAX:0.5:288:797
This command creates a database containing entries for two separate counters: de0_in and de0_out. These entries store samples of interface statistics collected every five minutes from an SNMP daemon on a router. In addition, the database contains several fields for automatically maintaining running averages.
You can populate the database by running a command like this:
$ rrdtool update zul.rrd N:\\Qsnmpget -Oqv zul public interfaces.ifTable.ifEntry.ifInOctets.4\Q:\\Qsnmpget -Oqv zul public interfaces.ifTable.ifEntry.ifOutOctets.4\Q
This command queries the input and output statistics for the de0 interface on a computer named zul. To schedule it to run every five minutes, you can make a crontab entry similar to the following:
0-55/5 * * * * rrdtool update /home/andrew/rrdbs/zul.rrd N:\Qsnmpget -Oqv zul public
interfaces.ifTable.ifEntry.ifInOctets.4\Q:\Qsnmpget -Oqv zul public
interfaces.ifTable.ifEntry.ifOutOctets.4\Q
However, you can use whatever methods you want to collect the data. To generate hourly graphs of the data, you can run a command like this:
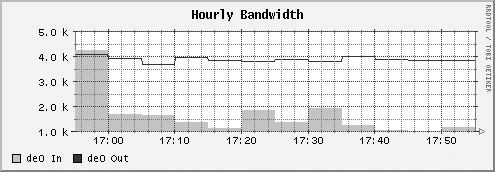
$ rrdtool graph zul_de0-hourly.png -t "Hourly Bandwidth" --start -3600 \
DEF:inoctets=zul.rrd:de0_in:AVERAGE \
DEF:outoctets=zul.rrd:de0_out:AVERAGE \
AREA:inoctets#00FF00:"de0 In" \
LINE1:outoctets#0000FF:"de0 Out"
This command creates an image like the one shown in Figure 9-1.
The -3600 in the command tells rrdtool that you want to graph the data collected over the last hour (there are 3,600 seconds in an hour). Likewise, if you want to create a graph over the course of a day, use -86400.
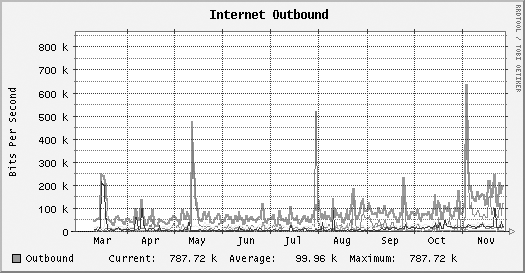
But that’s just the beginning. After collecting multiple data sources, you can combine them all into a single graph that gives you a great deal of information at a glance. Figure 9-2 shows the relative outbound usage of several servers simultaneously, with the total average for all servers just below it. While this figure is in grayscale, the actual graph uses a different color for each server, making it easy to tell at a glance which one is hogging all of the bandwidth.
As you can see, RRDtool is a flexible tool. All you need to do is tell it how much data you want to store and then set up some method to collect the data at a regular interval. Then, you can easily generate a graph of the data whenever you want it.

