Monitor your networks remotely with rpcapd.
If you’ve ever tried to monitor network traffic from another segment using a graphical protocol analyzer such as Ethereal (http://www.ethereal.com), you know how time-consuming it can be. First, you have to capture the data. Then you have to get it onto the workstation on which you’re running the analyzer, and then you have to load the file into the analyzer itself. This creates a real problem because it increases the time between performing an experiment and seeing the results, which makes diagnosing and fixing network problems take much longer than it should.
One tool that solves this problem is rpcapd, a program included with WinPcap (http://winpcap.polito.it). rpcapd is a daemon that monitors network interfaces in promiscuous mode and sends the data that it collects back to a sniffer running on a remote machine. You can run rpcapd either from the command line or as a service.
To start rpcapd, you will probably want to use the -n flag, which tells the daemon to use null authentication. Using this option, you will be able to monitor the data stream that rpcapd produces with any program that uses the WinPcap capture interface. Otherwise, you’ll have to add special code to the program you are using to allow it to authenticate itself with rpcapd. Since the -n option allows anyone to connect to the daemon, you’ll also want to use the -l option, which allows you to specify a comma-separated list of hosts that can connect.
So, to run rpcapd from the command line, use a command similar to this:
C:\Program Files\WinPcap>rpcapd -l obsidian -n
Press CTRL + C to stop the server...
When run as a service, rpcapd uses the rpcapd.ini file for its configuration information. This file resides in the same directory as the executable and is easily created by running rpcapd with the -s switch, which instructs rpcapd to save its configuration to the file you specify.
To create a file called rpcapd.ini, run a command like this:
C:\Program Files\WinPcap>rpcapd -l obsidian -n -s rpcapd.ini
Press CTRL + C to stop the server...
Now, press Ctrl-C to see what the file contains:
C:\Program Files\WinPcap>type rpcapd.ini
# Configuration file help.

# Hosts which are allowed to connect to this server (passive mode)
# Format: PassiveClient = <name or address>

PassiveClient = obsidian

# Hosts to which this server is trying to connect to (active mode)
# Format: ActiveClient = <name or address>, <port | DEFAULT>

# Permit NULL authentication: YES or NOT

NullAuthPermit = YES
To start the service, you can either use the Services Control Panel applet or use the net command from the command line:
C:\Program Files\WinPcap>net start rpcapd

The Remote Packet Capture Protocol v.0 (experimental) service was started
successfully.
Now, to connect to the daemon, you will need to find out the name that WinPcap uses to refer to the network device you want to monitor. To do this, you can use either WinDump, a command-line packet sniffer for Windows, or Ethereal. WinDump is available from the same web site as WinPcap.
To get the device name with WinDump, simply run it with the -D flag:
C:\Program Files\WinPcap>windump -D
1.\Device\NPF_{EE07A5AE-4D19-4118-97CE-3BF656CD718F} (NDIS 5.0 driver)
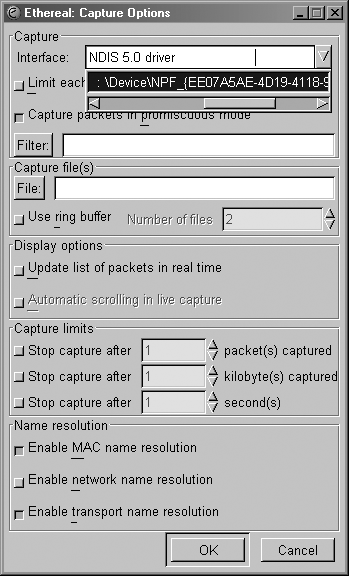
You can use Ethereal to obtain the device name by starting up Ethereal, going to the Capture menu, and clicking Start. After you do that, a dialog containing a list of the available adapters on the system will open, as shown in Figure 9-4. The device names in the list are those that you will later specify when connecting to rpcapd from a remote system.
When you connect to a remote machine with your favorite sniffer, simply put the device name for the interface you want to monitor prefixed by rpcap and the hostname, like this:
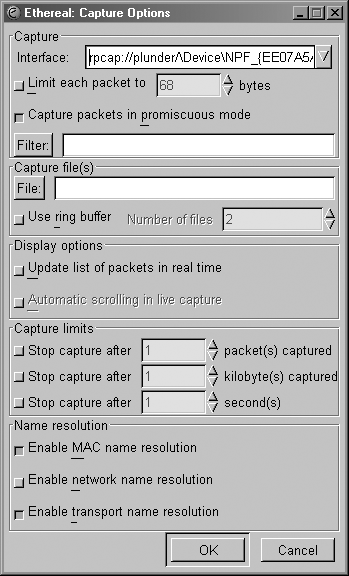
rpcap://plunder/\Device\NPF_{EE07A5AE-4D19-4118-97CE-3BF656CD718F}Figure 9-5 shows an example of using a remote capture source with Ethereal.
If you’ve set up everything correctly, you should see traffic streaming from the remote end into your sniffer, just as if it were being captured from a local interface.

