Appendix 3
Sources for the Book’s Charts
The charts contained in this book provide mostly original evidence of the extent of the current crisis and its roots. For that reason, we determined that it would be wise to add a detailed appendix outlining the sources of the information contained in the charts. We thank our research assistant R. Jamil Jonna of the University of Oregon for guiding our work in this area and preparing this appendix.
CHAPTER 1, CHART 1. Estimated Workforce in Radio and Television Broadcast Media Per 100,000 People, Selected Years 1982–2009
Sources: 1982–2002: David H. Weaver, Randal A. Beam, Bonnie J. Brownlee, Paul S. Voakes and Cleveland G. Wilhout,
The American Journalist in the 21st Century: U.S. News People at the Dawn of a New Millennium (Mahwah, NJ: Lawrence Erlbaum, 2007), p. 2;
2009: Estimated based on Weaver et. al. (2007) and employment trends of Announcers (SOC 27-3011), News Analysts (SOC 27-3021), Editors (SOC 27-3041) and Reporters (SOC 27-3022) in the Radio and Television Broadcasting Industry (NAICS 515100), Bureau of Labor Statistics, U.S. Department of Labor, Occupational Employment Statistics,
http://bls.gov/oes/ (accessed 12 June 2009); Population Division, U.S. Census Bureau, “Annual Estimates of the Population for the United States,” various releases,
http://census.gov/.
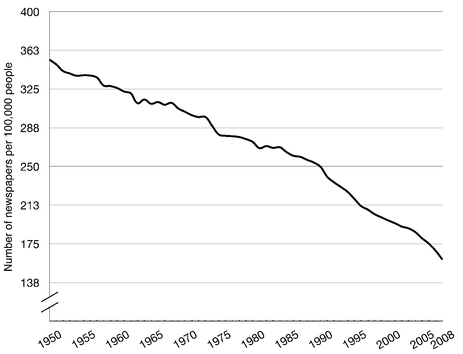
CHAPTER 1, CHART 2. Total Circulation of Daily Newspapers Per 100,000 People, 1950–2008
Sources: Business Analysis and Research, Newspaper Association of America (NAA), “Trends and Numbers,”
http://www.naa.org/ (accessed May 29, 2009); Population Division, U.S. Census Bureau, “Annual Estimates of the Population for the United States,” various releases,
http://census.gov/.
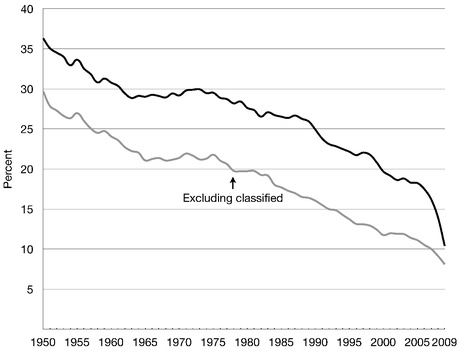
CHAPTER 1, CHART 3. Percentage of All Media Advertising Going to Newspapers, 1950–2009
Sources:
Newspaper advertising spending: Business Analysis and Research, Newspaper Association of America (NAA), “Trends and Numbers.” Available at
http://www.naa.org (accessed May 29, 2009). After 2003, total includes both print and online advertising spending. This is estimated based on the first two quarters;
Total advertising spending:
1950–1998: Daniel M. G. Raff, “Advertising expenditures, by medium: 1867–1998,” in Susan B. Carter et al. (eds.),
Historical Statistics of the United States, Earliest Times to Present: Millennial Edition (New York: Cambridge University Press, 2006);
1998–2007: Universal McCann, “Historical Cross-Media Ad Expenditures” (Television Bureau of Advertising: TVB Online),
http://www.tvb.org/ (accessed June 13, 2009);
2008–2009: forecasted data from
Magna Global, “Insider’s Report: Robert Coen Presentation on Advertising Expenditures,” December 2008, p. 3.
CHAPTER 1, CHART 4. Ratio of Average Salaries of CEOs in Leading News Media Firms to Average Salaries of Editors and Reporters, 1970–2009* (Five-year Avertages, exept 1970)
1989; “Corporate America’s Most Powerful People: The Pay,”
Forbes, May 28, 1990; “The People at the Top of Corporate America,”
Forbes, May 20, 1996; “Spoils of Success,”
Forbes, May 19, 1997; “How They Got There,”
Forbes, May 18, 1998; “The Scorecard,”
Forbes, May 17, 1999; “The Top Paid 800 CEOs,”
Forbes, May 15, 2000;
2005–2008:
Forbes.com (accessed June 24, 2009).
Aside from the U.S. Census, there is no consistent data on the average salaries of editors and reporters from the 1970s to present. Weaver et. al. (2007, Table 3.15, p. 101) provide data from 1970 to 2001, and while they report the median annual salaries of journalists,
average salaries are required for this comparison. Incidentally, the census numbers track Weaver et. al. very closely. With some qualifications—see the explanation on ‘estimating the editorial and public relations workforce’ given in chart 6—we believe data from the U.S. census is adequate.
Table 3 summarizes our results and compares them with those of Weaver et. al.
TABLE 3. Detail of Reporter Pay by Year

Thirteen major public media companies were used as a starting point to gather CEO compensation data: CBS, Cox Enterprises, Disney, E. W. Scripps, Gannett, McClatchy, NBC (General Electric), New York Times, News Corp, Time Warner, Tribune Company, Times Mirror, Washington Post. These companies represent the media industry in its most concentrated form, having merged or taken over numerous other companies. Such extinct companies—when they appeared in the Fortune lists—were used when data was available. For example, Times Mirror and Time Inc. were distinct companies for much of this period, until the formation of Time Warner. Similarly, Disney was not included until it had media interests, even thought it has been a Fortune 500 company for many years. According to the time periods used in this study, Disney was included for the first time in 1996, by which time it had purchased Capital Cities Communications/ABC (prior to their merger, each of the latter companies’ data were used).
What links all of these companies together over time is that they had newsrooms. While it is impossible to obtain CEO compensation data for significantly large private companies, such as Hearst and Advance Publications, we believe this survey is sufficient for our purposes. The actual years surveyed, number of companies used and average CEO pay are detailed in
table 3.
| Year | Average CEO Pay | Number of Companies |
|---|
| 1970 | $231,610 | 5 |
| 1976 | $304,616 | 8 |
| 1977 | $385,281 | 8 |
| 1978 | $445,500 | 8 |
| 1979 | $535,050 | 11 |
| 1980 | $615,063 | 9 |
| 1986 | $1,028,600 | 10 |
| 1987 | $1,620,818 | 11 |
| 1988 | $3,014,000 | 11 |
| 1989 | $2,248,083 | 12 |
| 1990 | $1,551,000 | 12 |
| 1996 | $3,398,667 | 12 |
| 1997 | $5,808,417 | 12 |
| 1998 | $8,375,417 | 12 |
| 1999 | $74,348,645 | 12 |
| 2000 | $40,318,600 | 10 |
| 2005 | $8,427,000 | 10 |
| 2006 | $11,400,000 | 9 |
| 2007 | $14,018,750 | 8 |
| 2008 | $17,002,857 | 7 |
| 2009 | $15,590,000 | 7 |
CHAPTER 1, CHART 5. Number of Top 500 Firms with Interests in Broadcast News, Newsmagazines or Daily Newspapers, 1960–2008 (Five-year moving averages)
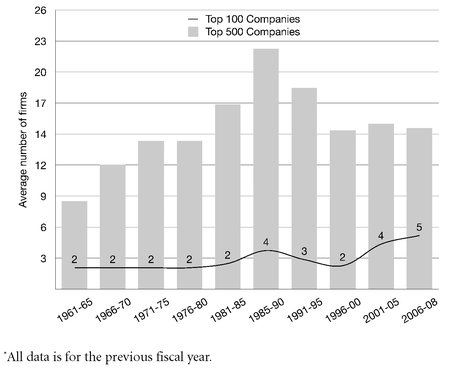
Sources: Publicly held firms: Fortune 500 listings; Securities and Exchange Commission (SEC) 10-K Filings; Privately held firms: “The Private Enterprisers: The U.S.’ 60 Largest Private Companies,” Forbes, February 1, 1965; “Private: Keep Out,” Forbes, May 15, 1969; “S.I. Newhouse and Sons: America’s Most Profitable Publisher,” Business Week (Industrial Edition), January 26, 1976; “After Years of Hoarding Cash, Hearst is Spending Big,” Business Week, September 15, 1976; “In Privacy They Thrive,” Forbes, November 1, 1976; William H. Jones and Laird Anderson, “Newhouse Sprawling, Rich, Private.” Washington Post, July 28, 1977, p. D13; “ABC’s Profit Grows 6.7%.” New York Times, July 23, 1982; Martha M. Hamilton, “Inside the Newhouse Empire: Newhouse Outbid Competitors; Newhouse Revenue, Profit Revealed,” Washington Post, October 16, 1983; “RCA Net Rose 45% In Fourth Quarter On 17% Sales Gain” Wall Street Journal (Eastern edition), Jan 24, 1984, p. 1; Stephen Grover, “CBS Profit Fell 53% in Quarter,” Wall Street Journal, February 13, 1985; “The Largest Private Companies in the U.S,” Forbes, November 18, 1985; “The Largest Private Companies in the U.S,” Forbes, November 17, 1986; “The Largest Private Companies in the U.S,” Forbes, December 14, 1987; “The 400 Largest Private Companies in the U.S,” Forbes, December 12, 1988; “The 400 Largest Private Companies in the U.S,” Forbes, December 11, 1989; “The 400 Largest Private Companies in the U.S,” Forbes, December 10, 1990; “The 400 Largest Private Companies in the U.S,” Forbes, December 9, 1991; “The 400 Largest Private Companies in the U.S,” Forbes, December 7, 1992; “The 400 Largest Private Companies in the U.S,” Forbes, December 6, 1993; “The 500 Largest Private Companies in the U.S,” Forbes, December 5, 1994; “The 500 Largest Private Companies in the U.S,” Forbes, December 4, 1995; “America’s Largest Private Companies,” Forbes, 1996–2008 (available online; accessed August 6, 2009); “Gannett Soars 30%; Scripps Net Up 22%,” Financial Post (Toronto, Canada), July 15, 1998.
Media company ownership data were compiled from
Forbes or
Fortune profiles, Hoover’s Company Profiles, the “Funding Universe” website (
http://www.fundinguniverse.com/), individual company websites, and various news sources. The Top 500 firms were determined by revenue, using the
Fortune listings as a basis.
Forbes’ “largest private companies” lists started in 1985. For previous years, estimates are based on revenue data from scattered sources (cited above); where no data was available, revenue was estimated based on available dates.
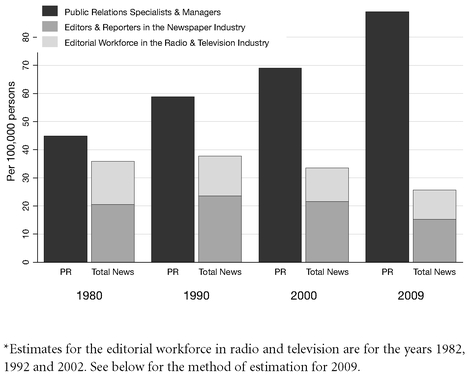
CHAPTER 1, CHART 6. Estimated Employment of Editors, Reporters and Announcers in the Newspaper, Radio and Television Industries, and Public Relations Specialists and Managers Per 100,000 People, 1980–2009*
Sources:
Radio-Television: Weaver et. al. (2007). Figures for 2009 were estimated based on the employment trends of Announcers (SOC 27-3011), News Analysts (SOC 27-3021), Editors (SOC 27-3041) and Reporters (SOC 27-3022) in the Radio and Television Industry (NAICS 51-5100) in the Bureau of Labor Statistics (BLS), Occupational Employment Statistics (OES), U.S. Department of Labor, 2003-2009,
http://bls.gov/oes. Also see Chart 1;
All other editors and reporters and PR persons: S. Ruggles, et. al, IPUMS. Figures for PR persons in 2009 were estimated based on the employment trends of Public Relations Specialists (SOC 27-3031) and Public Relations Managers (SOC 11-2031), also using the OES series published by the BLS;
Population: Population Division, U.S. Census Bureau, “Annual Estimates of the Population for the United States,” various releases,
http://census.gov.
Estimating the editorial and public relations workforce: Estimates of the editorial workforce of the U.S. News Media outside of radio and television, as well as those employed in public relations, were made using occupational and industry data recorded in the U.S. Census from 1960 to 2000. We used the following samples: 1960, “1% sample”; 1970, “Form 2 Neighborhood sample”; all subsequent years, “5% sample.” 2001–2009 data are from the American Community Survey (ACS). Census and ACS data was retrieved from the IPUMS database published by the Minnesota Population Center (as cited above). Occupation and industry titles, variable names and variable descriptions are taken directly from the IPUMS online codebooks (see
table 1).
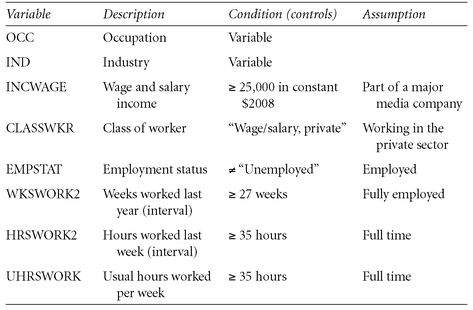
To get an accurate estimate of the number of editors and reporters in the newspaper industry it was necessary to add certain conditions to narrow the focus to those employed by major media companies. For example, a census respondent might have reported that they were an “Editor” or “Reporter” in a given year but they might also have been unemployed, part-time, working for the government or a non-profit, or receiving very low pay (and thus unlikely to be working in the mainstream news industry). By controlling for these characteristics, it is possible to estimate the full-time editorial workforce. Similarly, controls restricted public relations specialists to those that were employed full time (see
table 2).
TABLE 1. Occupation and Industry Variables for Each Census Year
| Year | Occupation | Industry |
|---|
| 1960 | Editors and Reporters | Newspaper publishing and printing |
| 1960 | Public Relations Men and Publicity Writers | None or Public Administration |
| 1970 | Editors and Reporters | Newspaper publishing and printing |
| 1970 | Public Relations Men and Publicity Writers | None or Public Administration |
| 1980 | Editors and Reporters | Newspaper publishing and printing |
| 1980 | Public Relations Specialists | None or Public Administration |
| 1990 | Editors and Reporters | Newspaper publishing and printing |
| 1990 | Public Relations Specialists or Public Relations Managers |
| None or Public Administration or Active Duty Military |
| 2000–07 | Editors or News Analysts, Reporters and Correspondents | Newspaper publishers |
| 2000–07 | Public Relations Specialists or Public Relations Managers | |
| None or Public Administration or Active Duty Military |
TABLE 2. Variables Used to Estimate the Full Time Editorial Workforce
A major benefit of utilizing census data is that many additional characteristics are available for each case or respondent. For example, the INCWAGE variable was used to determine the average wage of reporters in chart 4 of chapter 1, in addition to being a control variable. Given the large number of cases that the census provides, narrowing the sample by industry, occupation, and non-response to controls, was not an issue. Indeed, our figures correspond closely with other researchers who have made estimates of the editorial workforce in the U.S. (e.g., Weaver et . al. [2007]).
CHAPTER 1, CHART 7. Comparative Survey of Political Knowledge, International Hard News
CHAPTER 1, CHART 8. Comparative Survey of Political Knowledge, Domestic Hard News
Sources: The charts appear in an unpublished ms: Shanto Iyengar, Kyu Hahn, James Curran, Anker Lund and Inka Morin, “Cross-National Versus Individual-Level Differences in Political Information: A Media Systems Perspective.” Unpublished ms, (Department of Communication, Stanford, 2008).
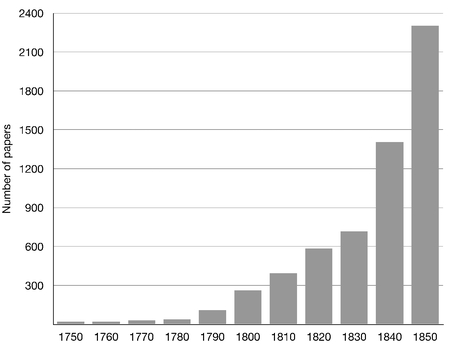
CHAPTER 3, CHART 1. Daily, Weekly, Semi-weekly and Tri-weekly Papers, 1750–1850
Sources:
1830–1850: Alfred McClung Lee,
The Daily Newspaper in America (New York: Macmillan, 1937), 718, Table VIII (for 1830 there is no data for semi-weeklies and tri-weeklies so only weeklies and dailies make up “all papers”);
1750–1820: Jeffrey L. Pasley,
“The Tyranny of Printers”: Newspaper Politics in the Early American Republic (Charlottesville: University of Virginia Press, 2001), 403, Chart 2 (figures are rough estimates based on the chart).
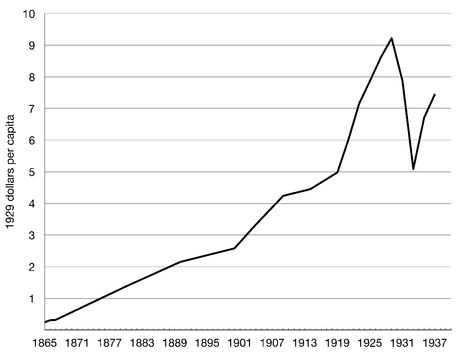
CHAPTER 3, CHART 2. Print Advertising Per Capita, 1865–1937 (constant 1929 dollars)
Sources: Neil H. Borden,
The Economic Effects of Advertising (Chicago: Richard Irwin, Inc., 1942), 48,
Table 1; “The Inflation Calculator.”
http://www.westegg.com/inflation/ (accessed February 28, 2009). Figures for total U.S. advertising expenditure become most reliable starting in 1935, when complete census data is available. Before this, analysts have made estimates based on various industry sources.
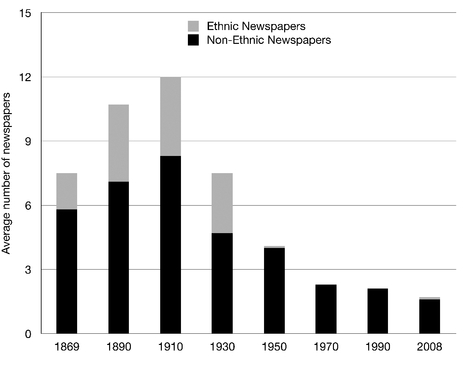
CHAPTER 3, CHART 3. Average Number of Daily Newspapers for the Twelve Top Ranked U.S. Cities by Population, 1869–2008
CHAPTER 3, CHART 4. Average Number of Daily Newspapers in U.S. Cities Ranked Three to Twelve by Population, 1869–2008
Sources:
Newspapers:
1869:
Geo. P. Rowell and Co.’s American Newspaper Directory (New York: Geo. P. Rowell & Co., 1869);
1890–1930:
N.W. Ayer & Son’s American Newspaper Annual, (Philadelphia: N.W. Ayer and Son, 1890, 1910 and 1930);
1950–2008 :
Editor & Publisher International Year Book, (New York: Editor & Publisher Co., published annually)
Population:
1869–1990: Michael R. Haines, “Population of Cities with at Least 100,000 Population in 1990: 1790–1990, ”Table Aa832–1033 in Susan B. Carter et. al. (eds.),
Historical Statistics of the United States (New York: Cambridge University Press, 2006);
1990–2008: Population Division, U.S. Census Bureau. “
Table 1: Annual Estimates of the Population for Incorporated Places Over 100,000, April 1, 2000 to July 1, 2007” (released July 10, 2008).
Only daily newspapers were counted and if morning and evening editions differed they were counted separately. For 1930, only newspapers with paid circulation (weekly or Sunday) greater than 10,000 were counted; for 1950, the cutoff was 30,000; and for 1970–2008, the cutoff was 35,000. All specialty papers, such as those covering the bond market, legal or agricultural news, were excluded. For New York, all boroughs (Bronx, Brooklyn, Manhattan, Queens, and Staten Island)—if they appeared separately—were combined to correspond with census figures.
By the 1950s, most “foreign language” and “ethnic” newspapers were printed in English or were bilingual but became weeklies or monthlies. In
Editor & Publisher, the titles of the sections listing these papers changed and split over time as a consequence. Only daily newspapers in the following sections were counted: in 1950, “Principle Foreign Language Dailies in the United States”; in 1970, “Principle Foreign Language Dailies in the United States”; in 1990: “Ethnic Newspapers Published in the United States”; and in 2008, “Ethnic,” “Hispanic,” and “Jewish” sections.
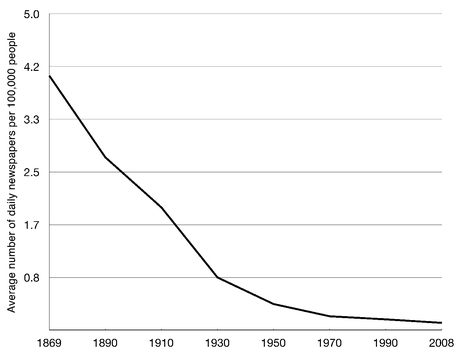
CHAPTER 3, CHART 5. Average Number of Daily Newspapers in the 12 Top Ranked U.S. Cities Per 100,000 People, 1869–2008
Sources: See source notes to Chapter 3, Charts 3 and 4.
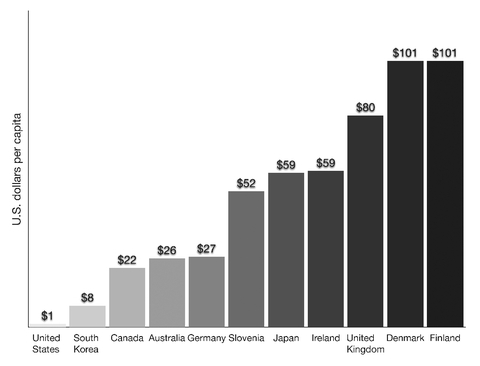
CHAPTER 4, CHART 1. Global Spending on Public Media, 2007
Source:
Changing Media: Public Interest Policies for the Digital Age (Washington, D.C.: Free Press, 2009), p. 267.


