DNA analysis is one of the greatest technical achievements for criminal investigation since the discovery of fingerprints. Methods of DNA profiling are firmly grounded in molecular technology.
—Committee on DNA Forensic Science,
National Academy of Sciences1
For those who can benefit from a primer on genetics and DNA profiles, this chapter reviews the nomenclature and genetic technology that form the basis of forensic DNA analysis. After a brief discussion of the basics of the genetic code, we explain such topics as DNA typing methods, short tandem repeats (STRs), and random-match probabilities. This chapter is designed for people who have very little background in molecular biology and forensic DNA analysis. Those who already possess this knowledge can proceed directly to chapter 2.
What Is DNA?
Deoxyribonucleic acid, or DNA for short, is the chemical in cells that specifies the composition of proteins and, along with other cellular components, contributes to their synthesis. DNA is also largely responsible for the inherited characteristics of organisms. The structure of DNA, as first postulated by James Watson and Francis Crick in 1953, is often compared with a spiral staircase or double helix with rungs or steps (see figure 1.1). The spine or backbone of the helix (analogous to the banister of the spiral staircase) consists of sugar-phosphate groups that link the steps of the spiral staircase and thus are constant throughout the length of the DNA strand for all individuals. The steps of the spiral staircase are composed of chemicals that are called bases or nucleotides. There are only four possible bases, adenine, guanine, thymine, and cytosine, denoted by the letters A, G, T, and C, respectively. The pattern or arrangement of these letters determines a person’s genotype, or genetic identity, as opposed to a person’s physical identity or phenotype (defined as the physical appearance or biochemical characteristics of an organism). No two people, with the possible exception of identical twins, have exactly the same series of letters that make up their DNA.

FIGURE 1.1. The double helix DNA structure. Left: A helixlike structure with two ribbons representing the sugar-phosphate groups and the horizontal steps or bases of the DNA molecule. Center: The hydrogen bond connecting complementary bases. Right: A model of a DNA molecule represented by a twisted lattice of spherical components. Source: From Modern Genetic Analysis by A. J. F. Griffiths, W. M. Gelbart, J. H. Miller, and R. C. Lewontin, ©1999, by W.H. Freeman and Company. Used with permission.
When a multicellular organism reproduces, it is the DNA within the reproductive cells (gametes or sperm and eggs) of the organism that serves as the template for the development of the fertilized egg. This fertilized egg develops into an organism of the same species, with species-similar but not necessarily identical physical (phenotypic) properties.
The complete set of human DNA is found in virtually every one of our cells (except the sperm and egg cells, which contain one-half of the DNA, and red blood cells, which have no nucleus), in every organ, and in our blood and immune system. DNA is found both in the nucleus of our cells and in the cell’s mitochondria (a component of the cell outside the nucleus that resides in the cytoplasm). The long, continuous nuclear DNA molecules are distributed on chromosomes, which also contain ribonucleic acid (RNA) and proteins. Humans have 23 pairs of chromosomes that are packaged in the nucleus of each cell. The DNA in the chromosomes is packed tightly, wound up and coiled into the nucleus of the cell. Proteins called histones help stabilize the tightly packed DNA within each chromosome.
Although DNA is thought to provide essential instructions for the functioning of our cells, it is not self-effectuating—it does not act by itself. DNA responds to prompts from the cell’s proteins, the body’s enzymes and hormones, RNA molecules, and sometimes external environmental factors. As Barry Commoner notes in “Unraveling the DNA Myth,” “Genetic information arises not from DNA alone but through its essential collaboration with protein enzymes.”2
Outside an organism, DNA can persist for many years under optimal conditions (see box 1.1). However, prolonged exposure to sunlight, warm temperatures, high humidity, and bacterial and fungal activities can result in DNA degradation. Some of the chemical enzymes released upon cell death may initiate the degradation of DNA. It is also more likely to degrade when it is on soiled rather than clean materials.
BOX 1.1 Brown’s Chicken Massacre and the Persistence of DNA Evidence
In 1993 seven people were ruthlessly killed in a robbery and left in two walk-in refrigerators at Brown’s Chicken and Pasta, a suburban Chicago restaurant. Collected from a trash can at the scene of the crime was a partly eaten dinner (two half-eaten chicken pieces). DNA testing techniques at that time were not sophisticated enough to produce any DNA profiles from traces of human saliva, so the chicken was frozen in hopes that developments in DNA testing would allow for future testing. Seven years later, that testing occurred, producing two DNA profiles. The profiles did not match any of the crime victims or suspects that police had at that time. Two years later, in 2002, a woman came forward with important details of the crime to police, including names of people who, she claimed, spoke about their involvement in the robbery. Police obtained a DNA sample from one suspect and matched it to a sample of saliva from the chicken dinner. A month later, Juan Luna and James Degorski were arrested and charged with the murders. Luna’s defense argued unsuccessfully that the DNA evidence against him should not be allowed because it had been mishandled over the years, including that it had been retested on multiple occasions and handled by scientists who acknowledged that they had not worn gloves. Both Luna and Degorski were found guilty of all seven counts of murder and were sentenced to life in prison.
Source: Authors.
What Is the Size of DNA?
If you uncoiled the entire nuclear DNA of a single human somatic cell (any cell other than sperm, egg, or red blood cells), holding the strands of the double helix end to end, its length would be about 2 meters (around 6 feet). The DNA is so thin and so tightly coiled that it can be this long but reside within the nucleus of the cell, which is about 5 millionths of a meter in diameter.
The length of a thread of DNA is usually measured in units called kilobases (kb). One kb is the molecular length equal to 1,000 base pairs of double-stranded DNA (there are two strands in the double helix), or 1,000 pairs of the bases (A, G, C, or T).
How many kilobases are there in the entire human genome? A human genome is made up of approximately 6 million kb (or 6 billion base pairs; see figure 1.1), 3 billion base pairs for each set of 23 chromosomes. To give some sense of this length, typing out the letters in a complete strand of our nuclear DNA would take up 57 million lines (where each line contained approximately 53 letters) and would fill about 1.2 million single-spaced pages.
Our DNA is distributed unequally among our 23 pairs of chromosomes. For example, chromosome 1, the largest human chromosome, has a length of 245,000 kb and would require 4.6 million lines of print or approximately 100,000 pages, while chromosome 22 of about 49,000 kb would require 925,000 lines of print or approximately 20,000 pages.
What Is a Gene?
A gene is usually defined as a segment of DNA that can be used by the machinery of the cell to synthesize a protein. In humans most of the genes are in the nucleus of the cell, dispersed across the 23 pairs of chromosomes (see figure 1.2). Genes can range in size from 100 bases (.1 kb) to as large as 2 million bases (2,000 kb). An average gene is about 5,000 bases long (5 kb).
A gene located on one of a pair of chromosomes (a particular form of a gene or a noncoding DNA sequence is called an allele) may be the same but is not necessarily identical to that of its “copy” located on the other chromosome of the pair. One of the genes residing on a chromosome was contributed by the egg and the other by the sperm. A person can often be perfectly healthy with one “good” and one “defective” copy of a gene.
The totality of the DNA in an organism or cell is called its genome. The human genome can be thought of as a set of encyclopedias with 23 volumes, where each chromosome represents one volume. The DNA code comprises the text of those volumes, and the genes make up discrete chapters or paragraphs inside each volume.
The stretch of DNA on which the gene resides has more DNA than is required to encode a protein. The region of the DNA that is used to synthesize the protein is called the coding region (also called exon). The extraneous DNA on the segment, which is excised during the process of transcription (when the protein is being synthesized), is called the noncoding region (or the intron). To use the analogy of the page of text, imagine a sequence of letters (each representing a single nucleotide) such as AAGTACATATGAACAT. Suppose that the letters CAT represent the noncoding text (intron). When the gene is read and copied into a usable message for synthesizing a protein, the noncoding regions are removed, and the remaining segment in our example is AAGTA-ATGAA. This segment (representing the functional gene) is used to make a protein product.
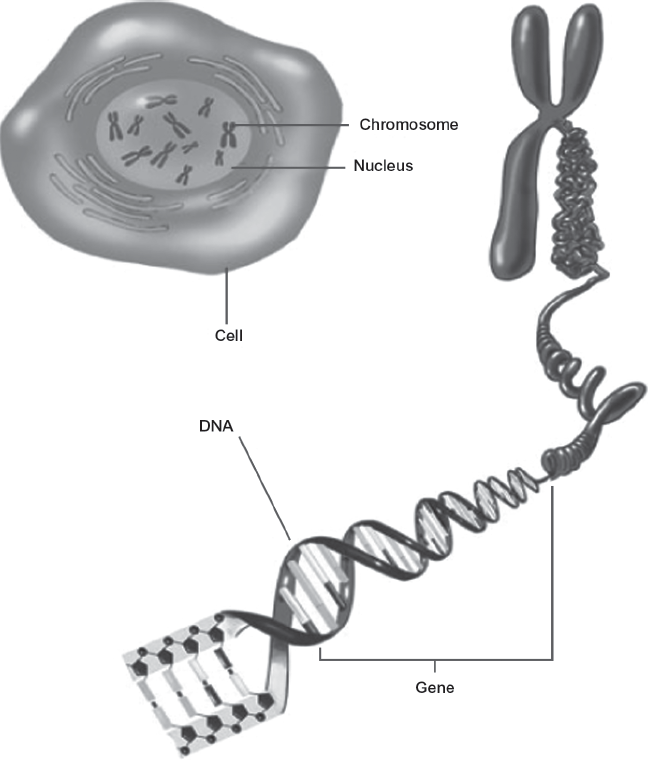
FIGURE 1.2. Human chromosomal DNA in the cell nucleus. Clockwise from the top: The cell and its nucleus, one of the 23 chromosomes, and the DNA molecule. Source: National Institute of General Medical Sciences, National Institutes of Health.
In human cells, where there are 3 billion base pairs of DNA in the nuclei, the number of genes, defined as functional segments of DNA that are used to encode proteins, is still uncertain. The International Human Genome Sequencing Consortium placed the number of protein-coding genes at 20,000 to 25,000. Other groups predict larger numbers. It is estimated that 97 to 98 percent of our DNA consists of noncoding regions.3 Some of these sequences may have other functions. For example, promoters reside near the genes and initiate gene expression starting with transcription (the process of preparing a readable RNA message of the DNA so a protein can be synthesized by a process known as translation). Other DNA sequences, called enhancers, can raise the amount of product produced. There is also noncoding DNA, sometimes referred to as “junk DNA” or “evolutionary debris,” that allegedly has no function, or at least not one that is known.
More recently, through a project called ENCODE (meaning the encyclopedia of DNA elements), scientists have discovered that a large amount of the DNA previously considered useless is essential to regulatory processes in the so-called functional part of the genome where gene transcription takes place.4 In the words of geneticist Francis Collins, formerly director of the U.S. National Human Genome Research Institute, “Transcription appears to be far more interconnected across the genome than anyone had thought.”5 The so-called noncoding regions probably play a role in coding small RNA molecules.
The Typing of DNA for Forensic Identification
Sequencing DNA means reading its code, or the series of four letters (A, G, C, and T) that make up the bases of the DNA molecule. As discussed earlier, humans have about 3 billion nucleotides in each of the 23 pairs of chromosomes. The sequence of nucleotides (reading of the human DNA) is 99.9 percent identical for all people. In other words, human genetic variation is accounted for by only 0.1 percent of DNA, or about 3 million bases.6 It is this variation in a segment of DNA that allows forensic scientists to determine whether two DNA samples could have come from the same individual.
The process of DNA analysis always begins with a sample of biological material: it could be a strand of hair, blood, sperm, tissue, skin cells, or saliva. To be useful for the analysis, the sample must have intact cells or DNA that has been removed from the cell. Unless the samples are very carefully handled, they can become contaminated by elements from the environment, such as DNA from plants, animals, insects, bacteria, or other human beings.7
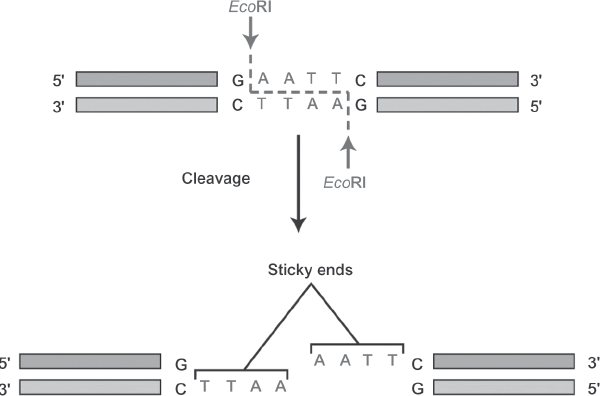
If the biological sample contains cells, the first task is to break open the cells (lysing the cell membrane) or to dissolve the matrix surrounding the DNA (as in a hair shaft) to retrieve the DNA. The separation of the DNA from the biological sample is called extraction, while the separation of sperm-cell and non-sperm-cell DNA is called differential extraction. Breaking the membrane of the cell to release its DNA can be done by exposing the cells to detergents and other chemicals; different chemical recipes are effective for different cell types. Once the DNA is removed from the cell, it has to be broken down into manageable pieces so that it can be identified by its unique sequence of bases. One method to accomplish this involves the use of proteins isolated from bacteria called restriction enzymes (EcoRI in figure 1.3) that cut DNA at specified sites, leaving fragments of DNA varying in length and defined by the presence of a restriction site.
To identify specific fragments with the genetic variation of interest, scientists use probes—short, single-stranded fragments of DNA that are synthesized in a laboratory and labeled radioactively or with some other detectable molecule. A probe will seek out and attach to its complementary sequence (if it is present) to form a double-stranded sequence of DNA. Within the DNA code, base A is always complementary to base T, and G is always complementary to C. Thus a probe consisting of the nucleotide AGTTAGC is the complementary strand to TCAATCG.
FIGURE 1.3. A restriction enzyme EcoRI is used to cut double-stranded DNA at a specific site, leaving the ends available for reattachment to complementary pairs. Source: From Molecular Cell Biology, 5th ed. by Harvey Lodish, Arnold Berk, Paul Matsudaira, Chris A. Kaiser, Monty Krieger, Mathew P. Scott, S. Lawrence Zipursky, and James Darnell. © 2004 by W.H. Freeman and Company. Used with permission.
Early Method of DNA Analysis
The first widely used method of forensic DNA analysis was based on restriction enzyme digestion and was called restriction fragment length polymorphism (RFLP). Introduced in 1988, RFLP involves cutting relatively large segments of the DNA molecule into smaller fragments and sorting those fragments by their size using a process called gel electrophoresis (see figure 1.4). RFLP analysis requires that a minimum amount of DNA from a sample be within a particular range from 50 to 500 nanograms (ng; 1 nanogram = 1 billionth of a gram or 10–9 gm). This corresponds to a bloodstain about the size of a dime to a quarter.
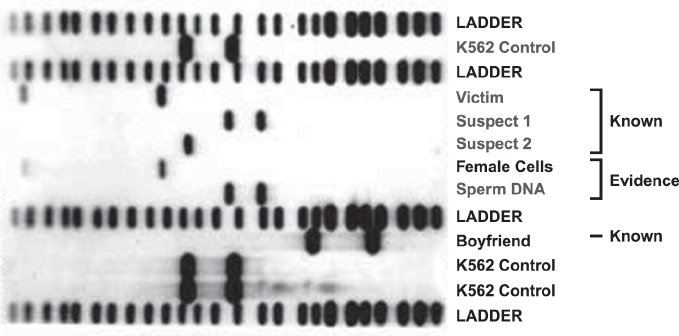
The restriction enzymes break the long DNA strand at specific sites. Because the DNA from two different individuals may have fragments that differ in size when they are excised at a specific place or locus (the term “locus” is used to designate the position or site of a DNA sequence on the genome), measuring the size of the fragments can distinguish DNA samples from different individuals. The difference in size of a fragment at a locus between individuals is due to the presence or absence of a restriction site and/or the number of short repeating noncoding sequences contained within a fragment. Once the DNA strand taken from a sample is broken up into discrete segments by restriction enzymes, it is then put through a process that separates the segments by weight. The DNA is placed in small wells on one end of a flat gelatin surface and then exposed to an electric field. The separation of the DNA segments by size is based on the fact that each DNA strand is negatively charged. When placed in an electric field, the negatively charged DNA will move toward the positive side of the electric field. Smaller DNA fragments move more quickly than larger ones because the latter experience more resistance migrating through the sieving gel medium, thus allowing the fragments to be separated according to size. After the fragments are put through gel electrophoresis, placed on a membrane, and exposed to x-ray film, the result is a series of black bands like the bar code in consumer products. When the two profiles with dark bands (each representing the size of a DNA segment) match, this suggests that the DNA samples may have come from the same individual. If the two profiles are different, then the two samples could not have originated from the same individual. The x-ray photograph showing the position of the DNA segments is called an autoradiograph or autorad (figure 1.5).
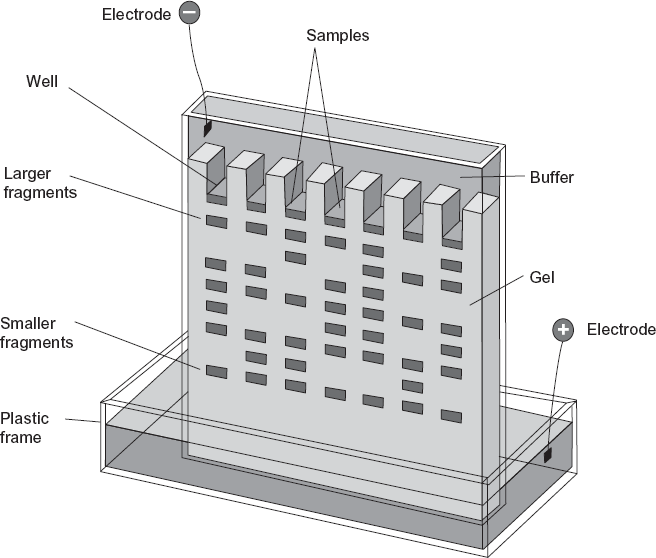
FIGURE 1.4. A rendering of a gel electrophoresis device in which gene fragments exposed to an electric field over a gelatin surface are separated by their size. Source: From Genetics: Principles and Analysis, 4th ed. by Daniel T. Hartl and Elizabeth Jones, 1998, Jones & Bartlett Publishers.
The RFLP analysis given in figure 1.5 is of DNA from suspects in a sexual assault case. The columns show the DNA segments of the victim (column 4), suspect 1 (column 5), suspect 2 (column 6), and the crime-scene sperm DNA (column 8). There is a matching profile at this locus between the crime-scene sperm DNA and suspect 1. The other columns are controls with known DNA patterns to validate the process. The columns marked ladders contain known sizes of the band sequence fragments that are used to estimate the size of the resulting profile bands.
FIGURE 1.5. An example of an autoradiograph of radio-labeled DNA segments in a sexual assault case, developed from RFLP analysis. It includes the DNA typing of two suspects and a victim with results for control samples and ladders that are used to estimate the size of the DNA fragments. Source: Genelex.Com, http://www.healthanddna.com/genelex/about.html (accessed May 23, 2010).
PCR Method for Copying and Amplifying DNA
RFLP has been replaced by a far more sensitive method of DNA analysis, based on a technique called the polymerase chain reaction (PCR). PCR involves replicating, by a form of chemical copying, tiny defined segments of an individual’s DNA (see figure 1.6). The PCR technique has revolutionized forensic DNA analysis because it is far more efficient and can be applied to the analysis of very small DNA samples. While the RFLP method could take upwards of six to eight weeks, PCR can complete a DNA analysis in one to two days. More important, RFLP requires a relatively large DNA sample; however, typical sample sizes for PCR analysis range from .5 to 2.0 ng. Thus PCR is equipped to analyze DNA samples 500 times smaller in quantity than RFLP requires. Because it is so much more sensitive, PCR is more useful than RFLP for analyzing degraded samples of DNA from blood, saliva, hair, semen, and other sources. On the other hand, because of its high degree of sensitivity, PCR is also more vulnerable to contamination (see the introduction and chapter 16).
The basic idea behind PCR is that copies of a small segment of DNA are made, and then copies of the copies are made through a cyclic process until a sufficient quantity of the DNA is obtained for analysis. A simple analogy to the PCR amplification process is given as follows. Imagine an all-school dance, where the number of boys and girls is equal. The event begins with one pair of dancers (one boy and one girl) in the center of the room. Surrounding the dancers on the perimeter of the room are girls and boys in no special order. At some point in the dance, prompted by a change in the music, the dance pair divides (analogous to the split of a double-stranded DNA molecule into two single strands). The boy meanders to the perimeter to select another partner, his new complement—while the female does the same. The result is that from one dance pair come two, four, eight, and so on. The process can be repeated many times until the dance floor is filled to capacity and no one is left in the periphery (all complementary pairings are actualized).
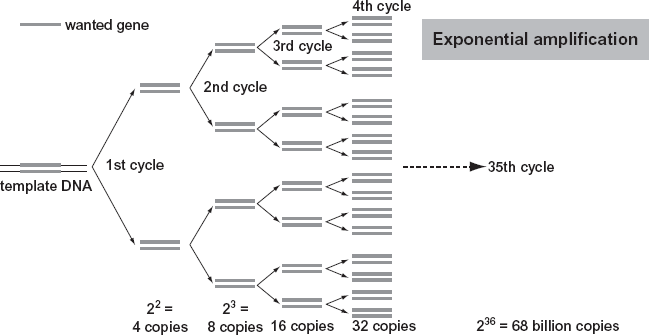
FIGURE 1.6. A representation of the DNA amplification process using the polymerase chain reaction (PCR). Source: Andy Vierstraete.
In the PCR process the DNA extracted for analysis is mixed with a group of chemicals including primers (chemicals that will identify the specific DNA targets to copy and initiate DNA replication) and enzymes. The primers are single-stranded nucleotides synthesized in the laboratory and attached to specific target sites of the DNA sample of interest. The extracted DNA and these chemicals are then placed in a machine called a thermal cycler. This machine runs the sample through a series of heating and cooling cycles. The thermal cycling consists of three steps. In step 1 the sample is heated to 95°C, which is the temperature at which double-stranded DNA unzips to form two single strands. This process is sometimes called denaturing the DNA. In step 2 the sample is cooled to 55–60°C, which is the temperature range best suited for the primers to attach to the single strands. In step 3 the temperature is raised to 72°C, and an enzyme called Taq DNA polymerase acts as a catalyst to synthesize a complementary target to the single-stranded template DNA. A complete double-stranded DNA molecule is created. This is called the synthesis step. This process duplicates segments of DNA. A cycle of the PCR takes less than a few minutes. The three-step process is usually repeated two to three dozen times (using commercially available kits), and with each process the number of copies of the target DNA is doubled. By the 28th cycle the PCR process can make billions of copies of a particular DNA molecule that may have been present only a few times in the original sample. Once the DNA segments from two or more samples are replicated, these segments have to be measured and compared, as described in the following section.
Polymorphisms in DNA Sequences
Polymorphisms are defined as variations in DNA sequences at a particular position (locus) on the human genome, when the locus varies in at least 1 percent of the population. The variation in the DNA sequence can take multiple forms. It can be a change in one base of a sequence. For example, the difference between the DNA sequences AGACCTAG and AGACCTAC is that the last base G in the first sequence is replaced by the base C in the second sequence. Because the difference in the sequences is one base, this is called a point (or site) mutation or a single-nucleotide polymorphism (SNP, pronounced “snip”). A mutation at the site of a DNA sequence recognized by a restriction enzyme may prevent the enzyme from cutting the DNA at that site. Thus, if an enzyme cuts a DNA sequence every time it sees the base sequence TAG, it will cut the first sequence but not the second site if that individual carries a SNP that changed the sequence.
A second type of polymorphism is represented by repeated short sequences that lie adjacent to one another on the DNA thread (tandemly repeated). For example, in the two DNA sequences listed below, one has three repeats of AGTCA, and the other has five repeats of the same base sequence at a particular locus of the genome. This is called a “length polymorphism.” A polymorphism may or may not affect the physical characteristics of an individual. Those used in forensic identification do not seem to have an effect on the physical characteristics of an individual. Human DNA loci that are highly polymorphic (variable) are especially useful for identifying individuals when the length polymorphisms are made up of STRs because they are more likely to display differences between two randomly selected individuals. Thus the more variable the locus, the better chance there is of excluding a person wrongly associated with a forensic evidentiary item.
AGTCAAGTCAAGTCA (three repeats of AGTCA)
AGTCAAGTCAAGTCAAGTCAAGTCA (five repeats of AGTCA)
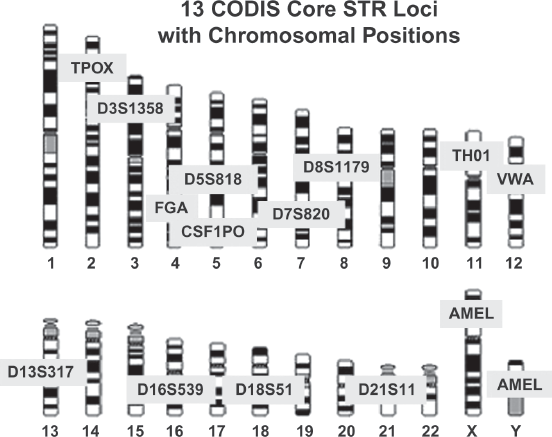
Repeats of short contiguous segments of DNA (i.e., STRs) are used to ascertain the source (identity of the contributor) of a biological sample in most forensic DNA laboratories. In the U.S. forensic DNA database system, 13 STR loci are chosen that have high variability. The names and locations of these 13 core STR loci on the chromosomes, as well as the loci on the X and Y chromosomes that are used to determine the gender of the DNA donor, are shown in figure 1.7.8
These loci are named by scientists within the genetics community by alphanumeric terms like D3S1358 or FGA. The nomenclature does not follow a logical form, but the letters and numbers do have significance for the chromosome in which the sequence is found, whether the sequence is part of an intron (noncoding region of DNA) or resides outside a functional gene, and when the sequence was discovered. The automated DNA analyzer determines the number of STRs for each of the two alleles (one for each chromosome) in a designated locus. In table 1.1 the evidence sample shows 13 and 15 repeats for the STR at locus A and 12 and 14 repeats at locus B. It matches the number of repeats at the same loci for suspect 2. Thus suspect 2 cannot be excluded as a potential source of the evidence sample, while suspect 1 can be excluded.
TABLE 1.1 Short Tandem Repeats for Two Alleles
STRs with more repeats are longer. The lengths of the STRs are compared in a DNA analyzer in a process similar to that of electrophoresis described earlier. The DNA segments are exposed to an electric current in a narrow capillary tube instead of a flat gel. As with electrophoresis, the shorter segments move more quickly through the capillary tube, and thus the length of the segment can be determined by the analyzer.
In table 1.1 suspect 1’s DNA does not match the evidence sample in two loci. All we need is one mismatch of an STR length in a single locus to declare that the samples are not from the same individual, assuming that no errors were made in the analysis. Suspect 2 matches the evidence sample in two loci. If the match in the STRs continued across 13 loci, then suspect 2 would not be excluded as the source of the DNA of the evidence sample, and the probability that suspect 2 carried that same DNA profile by chance would be extremely low.
To obtain absolute 100 percent probability of a match, we would have to compare 3 billion base pairs of the sample and the suspect’s DNA. That would be very expensive and time consuming and would provide more scientific evidence than would be necessary to make a strong case. Instead, a very small portion of the genome is analyzed (26 alleles) and, in cases of a “match,” an estimate is provided for the chances that this match might have occurred by chance. This is called the “random-match probability.”
Random-Match Probability
On November 13–14, 1997, at a meeting of representatives of 21 laboratories throughout the United States, forensic scientists and the FBI reached an agreement on using 13 STR loci for submitting profiles to the national forensic DNA database, otherwise known as the Combined DNA Index System (CODIS). What level of certainty does this system achieve, and on what grounds?
Let us suppose that we are comparing a crime-scene sample with the DNA of a suspect using 13 loci (see table 1.2). For each STR locus, forensic technicians determine the number of repeats for each of the two alleles. For example, suppose that at locus A (table 1.2) both the suspect and the crime sample have 10 and 6 repeats. The next logical question is: how many people in the population of the suspect (racial, ethnic, and/or ancestry group) have 10 and 6 repeats at that locus? At locus B we find that there are 12 and 8 repeats for both the crime-scene sample and the suspect. Again, how many people in the suspect’s reference population have 12 and 8 repeats for locus B? The reliability of the statistics for estimating that a random person in the population has the same repeats (random-match probability) is based on the frequency of the number of repeats at a locus in various reference populations. This information is critical for establishing the likelihood that two random people have the same number of STRs for 13 loci. The chance that two people have identical repeats is increased the closer they are in their genetic lineage. Close family members are more likely than those who are not related to have the same number of repeats in many (but not all) loci.
Table 1.2 also shows the frequencies with which each specific short tandem DNA segment would be observed in 13 loci (26 alleles) for a hypothetical reference population. Some geneticists like L. A. Zhivotovsky argue that the reference population is critical in establishing the probability of a random match between two samples because the frequencies of matched STRs are likely to be higher and the random-match probability also higher for people in the same geographical region or of the same ethnic or racial ancestry.9 If the suspect is Asian, the chance of finding a random match in the European population is less than it would be for the Asian population. Because the suspect is presumed innocent, it is incumbent on our criminal justice system to consider seriously the conditions under which someone else in the population who has a forensic DNA profile identical to that of the suspect left his or her DNA at the crime scene. For locus A, the frequency of 10/6 STRs is .01, or 1 in 100. Similarly, for loci B, C, and D, the frequencies within the reference population are .06, .03, and .08, respectively.
TABLE 1.2 Calculating the Probability of a Match in Two DNA Samples for 13 Loci
The next step is to determine the rarity of the forensic DNA profile in the population. If the STRs at the loci are truly independent (as they are assumed to be), the chance that two people in a reference population will have the same number of repeats is obtained by taking the product of the frequencies for each locus. This is analogous to determining the chance of getting two heads when one simultaneously flips two different coins (which are independent events). The chance of getting a head on the first flip is .5, and similarly for the second. The chance of getting two heads on flipping both coins is .5 × .5 = .25. Thus, if one flips both coins enough times, then one-quarter of the simultaneous flips will yield two heads.
For the first four loci in our example, the frequency of the specific STRs in a reference population would be determined by (A = .01) × (B = .06) × (C = .03) × (D = .08) = 1.44 × 10⁻⁶, or about one chance in a million people. Thus in a population of 6 million people, approximately 6 people would be expected to have the same eight STRs on four loci.
If a crime were committed on an isolated island that had only 500 people, then a random-match probability of one person in nearly 1 million might be high enough to convince a jury that the suspect is the source of the crime-scene DNA, but few places are that isolated. If we completed the calculations for all 26 alleles, the probability of getting a random match in STRs for two people would be quite small—typically less than one in many billion.
Criminal justice agencies may differ in what they choose as the match probability that eliminates any doubt they have that a suspect was the source of the crime-scene DNA. Whatever number they choose as evidence of a “definitive match,” they should not neglect to consider that there is a much greater likelihood that a close relative would have a matching profile.
The Laboratory Process for DNA Analysis
When evidence is received by a facility, it is characterized and coded, and a determination is made whether it is appropriate for DNA testing (see figure 1.8). If so, it is sent to a section of the laboratory for DNA extraction. Whether a garment, blood, hair, or saliva is involved, the extraction process removes proteins and other non-DNA components, leaving purified DNA residue for analysis. The extraction process may also involve the separation of sperm-cell and non-sperm-cell mixtures, such as sperm cells from vaginal epithelial cells. Different methods and reagents are used for the extraction of DNA depending on the nature and homogeneity of the sample. Once the DNA is extracted and purified from the sample, it is sent for DNA quantification, a process of measuring and setting the proper amount of DNA so it falls within the optimum ranges for analysis.
As an example, in a rape case the sample might consist of a stain, which is expected to contain a mixture of the perpetrator’s sperm and the victim’s epithelial cells (cells on the outer layer of the skin or organs). A portion of the sample is removed and exposed to a group of chemical reagents that degrade the proteins and break open the epithelial cells to release the nuclear DNA. The sperm pellets remain intact, and the freed epithelial DNA in solution is removed and analyzed. The original sample has undergone “differential extraction” when sperm and nonsperm fractions of the sample have been separated. The sperm pellets can then be exposed to another set of reagents to isolate the pure DNA. The DNA analyzer is optimally designed to handle certain amounts of DNA. If the DNA quantities are too large, artifacts (any result which is caused by the DNA analyzer itself and not by the DNA entity being analyzed) and other problems will likely occur, such as split peaks (a peak is an indicator of an allele at a locus) or off-scale peaks. If there is too little DNA, then some peaks will not appear. This is called allele dropout or possibly locus dropout. The analysis of STRs works best for samples containing 0.25 to 2.0 ng of DNA. One nanogram of DNA is contained in about 160 to 168 cells.
When the profiling is complete, the DNA analyzer produces a graphic and numerical output (an electropherogram) to a computer. The output shows a continuous oscillating line with periodic peaks and numerical values next to the peaks. The heights of the peaks represent the amount of DNA that was amplified for each allele segment (see figure 1.9), which is related to the amount of evidentiary DNA used for the analysis.
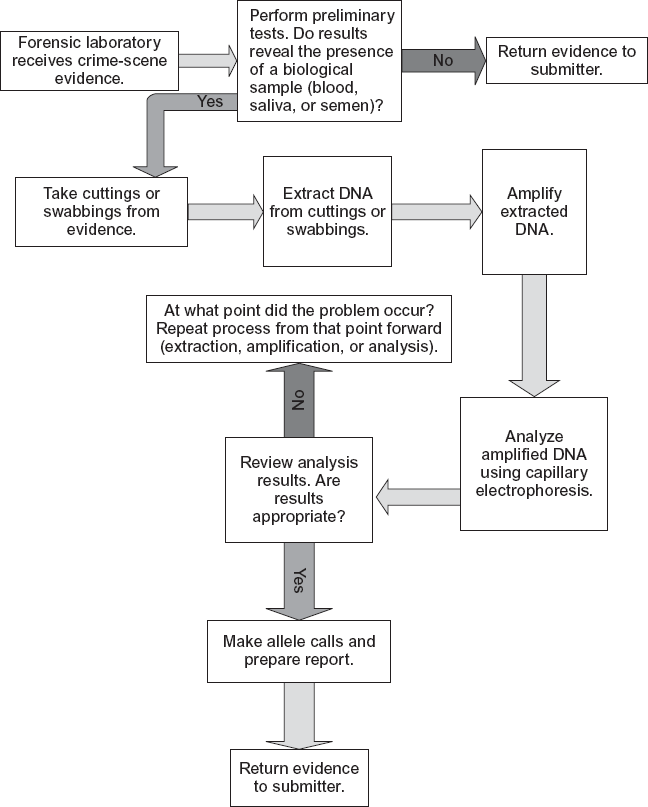
If the DNA comes from a single individual and is not degraded, two peaks should appear for each locus where the individual has inherited different alleles from each of his or her parents (heterozygous for that locus). In cases where an individual has inherited the same allele from each of his or her parents (homozygous for that locus) only one peak will appear (figure 1.9). If the DNA consists of a mixture of two individuals, there can be anywhere from one to four peaks at a particular locus, significantly complicating the picture. For example, if both individuals are heterozygous at a particular locus and have the same STR alleles at that locus, only two peaks will appear; if the two heterozygous individuals have no STR alleles in common, then four peaks will be observed; and if they share the same STRs for just one allele, then three peaks will be observed.
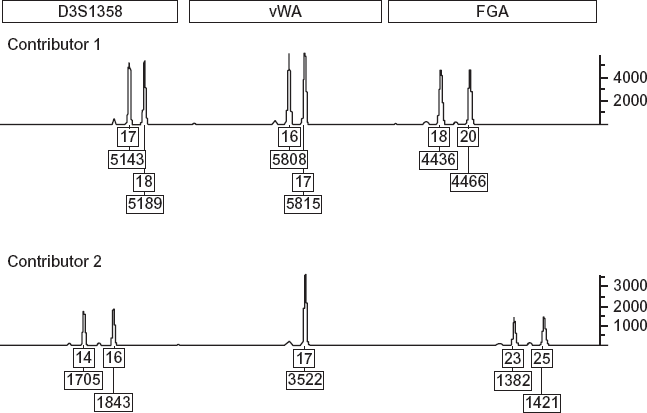
FIGURE 1.9. The output from a forensic DNA analyzer (called an electropherogram) showing the STR alleles for two contributors at three loci. The top number reports the number of STR repeats for the allele. The bottom number is a measure of the height of the peak (in RFUs), which represents the quantity of DNA (vertical axis). Source: Dan Krane.
The position of the peaks on the x-axis of the electropherogram indicates how long it takes the allele to pass through a capillary tube, which correlates with the length of the DNA segment, and therefore indicates the number of repeats. The height of the peaks in “relative fluorescence units” (RFUs) measures the amount of DNA present in the sample. Peaks from all the alleles in a profile coming from the same individual are expected to have about the same heights. The computer-generated numbers under each peak tell us how many repeats there are in the sample at that locus and the height of the peak relative to a baseline.
Quality-Control Procedures
The machines are calibrated and the reliability of the overall assay is monitored by analysis of samples of known DNA type as a control standard (like an official measuring rod). In all accredited forensic laboratories and others that follow good scientific practice, technicians are instructed to include a sample of known DNA sequence in every analysis sample they undertake. Any analysis where systematic errors have occurred (affected possibly by temperature, pressure, vibrations, or machine malfunctions) will be reflected in the control sample (see chapter 16). In addition, every step in the process, including technician interpretations, is required to be documented for purposes of troubleshooting and replication.
For example, the New York City forensic DNA lab has designed a number of control procedures that aim to minimize the possibility of false positives (false matches) and false negatives (false exclusions). The facility has an isolated laboratory that tests all reagents for purity and for any traces of DNA. The reagents are put through a DNA analyzer to validate that they are DNA free. Every sample of DNA that is put through the DNA analyzer is required to be checked against a DNA sample that has a known STR profile. If the profile of the quality-control standard does not match its expected values, the run is invalidated. There are strict protocols for how evidence moves through the different stages in the testing regime: The people who initially prepare the evidence for testing are different from those who do the extractions or place the sample in a DNA analyzer. The stages in the DNA analysis are segmented by physical spaces and are also separated by personnel who conduct different tasks in the process. In addition, those who handle the evidence during extraction, the PCR, or DNA analysis are required to be suited up from head to toe in protective garments designed to prevent cross-contamination of DNA. No one whose DNA is not on file is allowed to enter the high-security laboratory. In case there is a breach in the protective outerwear, the contaminant DNA from the technician can be traced.
Notwithstanding the strict quality-control procedures adopted by some laboratories and the crisp-looking output of electropherograms, there is still room for judgment calls in reading the output of the analyzer. In the words of William Thompson and colleagues, “Although many technical artifacts are clearly identifiable, standards for determining whether a peak is a true peak or a technical artifact are often rather subjective, leaving room for disagreement among experts.”10
It is the policy of the FBI’s forensic DNA laboratory that it will not report out a DNA profile with fewer than 10 complete STR markers. The New York City lab’s policy is less stringent; it will accept 6 or more good STR markers. Also, the New York City lab’s policy is that it will not enter a single peak at a locus (representing one allele) if the second peak at the locus (representing a second allele) is known to have been badly degraded and not found in the output. The computer program has a peak (height) threshold for scoring alleles. If the peak height is below 75 RFU, it is not reported. This avoids giving the forensic DNA analyst some discretion in calling the peak real or spurious. By the time it reaches 75 RFU, the peak is considered unambiguous. Other laboratories may use a different threshold below which peaks are ignored. Erin Murphy observes: “The FBI Protocol allows only peaks over 200 relative fluorescence units (RFU) to be considered conclusive for match purposes, though it recommends interpretations of any peak over 50 RFU including for exculpatory purposes.”11 Thus the FBI has ostensibly adopted 50 RFU as the detection threshold.
DNA analysis for use in criminal investigation is a highly complex process that involves collecting biological samples from individuals and crime scenes, extracting DNA from those samples, using the PCR to amplify the amount of DNA from subanalytical levels to analytical levels along noncoding regions of the DNA, and then using some method to determine the genetic variation of the sample. The result of this process is a DNA profile that can be stored electronically and used to identify an individual or to link that individual to a crime or exclude him or her from it by comparing that profile with others.
A new generation of DNA analyzers, genetic typing techniques, and forensic laboratory protocols has dramatically increased the efficiency of DNA testing and has helped address the most obvious sources of error of the first generation of DNA testing systems. Separation of samples, isolation of functions, proficiency testing, and protocols for interpreting mixed samples are among some of the quality-control innovations practiced, in theory, by all accredited laboratories. The shift from the autoradiograph with the dark bands generated by RFLP and gel electrophoresis to the PCR and the electropherogram has also reduced the likelihood of reading errors.
Nonetheless, no technology is errorproof, and DNA analysis is no exception to this rule. Artifacts in the output can be produced by the machine because of imperfections or environmental effects. Human error can also occur. Sample contamination, misinterpretations or mischaracterizations of data, and the reporting of inaccurate or misleading statistics are all sources of human error that can and have occurred in DNA cases, sometimes resulting in the wrongful conviction of an innocent person. The potential for error and abuse was made painfully clear in the case of the infamous Houston Police Department Crime Laboratory, where a final report by an independent investigator revealed that, of a total of 135 DNA cases reviewed, major issues were identified in 43—or approximately 32 percent—of those cases, including four death penalty cases. The report found that:
The Crime Lab’s historical DNA casework reflects a wide range of serious problems ranging from poor documentation to serious analytical and interpretive errors that resulted in highly questionable results being reported by the Lab. The profound weaknesses and flawed practices that were prevalent in the Crime Lab’s DNA work include the absence of a quality assurance program, inadequately trained analysts, poor analytical technique, incorrect interpretations of data, the characterizing of results as “inconclusive” when that was not the case, and the lack of meaningful and competent technical reviews. Furthermore, the potential for the Crime Lab’s analysis of biological evidence to result in a miscarriage of justice was amplified exponentially by the Lab’s reported conclusions, frequently accompanied by inaccurate and misleading statistics that often suggested a strength of association between a suspect and the evidence that simply was not supported by the analyst’s actual DNA results.12
The fallibility of DNA testing will be discussed in more detail in chapter 16.
Fallible or not, DNA is here to stay. Few would argue with Simon Cole’s statement about the stature of forensic DNA in criminal justice: “New technology is changing the administration of criminal justice. Among the most prominent of such changes is the development of forensic DNA technology, which includes a forensic assay with potentially enormous discrimination and sensitivity and the development of large databases based on that assay.”13 However, as stated in the book Truth Machine, “This seemingly unassailable, transcendent form of criminal evidence remains bound up with stories that are infused with contingent judgments about the mundane meaning and significance of evidence.”14


