In nature, things are either translucent, reflective, or opaque, and they have a unique hue. Here’s a simple explanation of color: When sunlight strikes an object, the object absorbs a part of the solar spectrum and reflects the rest back at the viewer. The color that the object does not absorb—the color it reflects—is the color that you see. But not all of the visible light that we see comes from the sun. Lightning, fire, and phosphorescent organisms all produce their own light. Additionally, many other natural phenomena lead to visible color.
Color can be generated in the following ways:
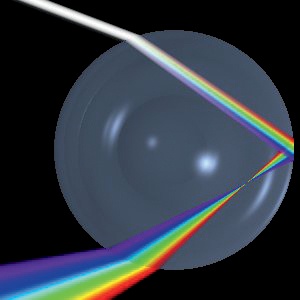
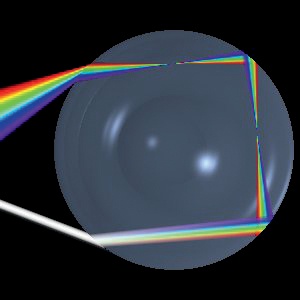
Color by refraction: When light passes through a refractive material, it is split in a pattern that depends on its wavelength. Because white light is made up of a combination of all visible wavelengths, it is split into a rainbow of colors. You’ve probably seen this happen as light passes through a prism whose nonparallel faces increase the light’s refraction (see Figure A-29). But when light passes through a parallelepipedic piece of glass, which has parallel faces, the first face refracts the light, and the second face refocuses it back into white light.
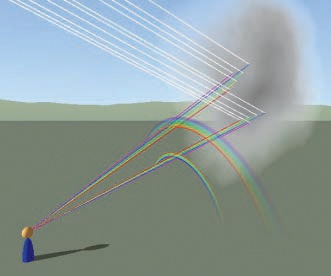
Rainbows: A unique case of color by both reflection and refraction is the rainbow. Solar light is refracted by a large number of tiny water drops. These droplets are spheres, which disperse the colors in a uniform way, as shown in Figure A-30 and Figure A-31. The direct refraction creates the primary rainbow. A secondary rainbow forms when light that’s reflected on the bottom of a droplet is then indirectly refracted. A double rainbow is illustrated in Figure A-32.
Color by diffusion: When light passes through a space that contains many small particles, such as the atmosphere, it’s diffused. The dynamics of the diffusion depend on the size of the particles and on the wavelength of the light passing through. Some wavelengths are diffused and reflected in random directions, some are absorbed, and some will pass through. One of the most common cases of color diffusion is the blue sky. As light moves through the atmosphere, most of the longer wavelengths, such as red, orange, and yellow, pass straight through. Much of the shorterwavelength blue light is absorbed by the gas molecules, however. The absorbed blue light is then radiated back out and scattered in every direction. That scattered light fills the sky, making it look blue.
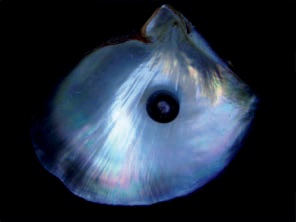
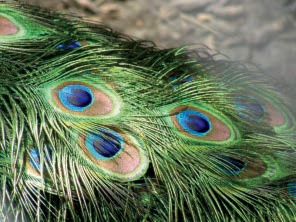
Color by interference: Light is partially reflected by the first face of a thin, semitransparent material, and the remaining light passes through and is reflected by the second face at the far side of the material. The reflected light from both faces combines, and depending on the depth of the material (the distance between faces), wavelengths are either amplified or canceled out. The resulting phenomenon is called interference and can be seen on soap bubbles, mother of pearl (see Figure A-33), puddles covered with oil, and other shimmery surfaces. The color appears to change depending on the angle of observation and can cause iridescence if the material is barbed. The striking colors of a peacock’s tail (see Figure A-34) are produced by interference, as are those on a butterfly’s wing. Peacock feathers and butterfly wings are both barbed surfaces, so they exhibit iridescence.
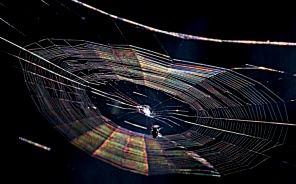
Color by diffraction: When light moves around an object, or passes through a very small hole or slot, its path changes, like water flowing around rocks or passing from a narrow creek into a lake. The path that the light takes as it moves past the obstacle depends on the wavelength. White light is split into a rainbow of colors. The effect is often subtle, but you can see colors by diffraction on the threads of a spider web in certain conditions (see Figure A-35).
The main characteristic of colors by refraction, diffusion, interference, or diffraction is that they’re passive and so can yield only a subrange of colors from the solar spectrum. If light of a single color undergoes one of these four processes, the result is the same color. No other colors are produced during the process.
When we artificially create an image to represent something we’ve seen, we can’t use these phenomena because we couldn’t easily produce all the colors we would need. Instead, we use color emitters, like the phosphor on a cathode ray tube, or bodies that are only transparent to certain colors, like the liquid crystals on an LCD screen. We can also use opaque materials, such as paint or mosaic tiles, that reflect only certain colors. Ultimately, the color of a material is determined in one of three ways:
Color by emission: The sun appears white because it emits light in all visible frequencies (and many invisible frequencies, too). An incandescent light bulb or a fluorescent tube has a wavelength spectrum similar to that of the sun. A phosphor pixel on a CRT screen emits light at one specific wavelength.
Color by reflection: The wavelengths reflected are the only ones that are visible—the others are all absorbed by the material. The color of the material depends on the light it receives: In normal sunlight, a piece of chalk or a sheet of paper looks white because it receives white light and reflects all wavelengths in the visible range. But in red light, they would appear red.
Color by absorption: For semitransparent materials, such as water and ice, only the wavelengths that pass through the material are visible—the rest are absorbed. For example, if a piece of sea ice absorbs green wavelengths less than other wavelengths, it appears to be green. Once again, a given frequency can only be visible if it’s present in the light that strikes the material.
The colors we see are created differently in the three examples just given. With color by reflection, a material that reflects all wavelengths is white, and a material that reflects nothing (absorbs all wavelengths) is black. With color by absorption, a material that absorbs all wavelengths is opaque, and a material that absorbs no wavelengths is transparent. Blue paint reflects the blue frequencies and absorbs the others. Blue glass also absorbs frequencies other than blue, but unlike blue paint, the blue light that gives glass a color passes through the glass to reach us. These concepts lead to the different models of color representation: additive, subtractive, and HSV.
The additive model is not the most intuitive, but it is the most natural. It corresponds to color by emission and to the way our eyes perceive colors.
We already saw that the retina contains three types of cones that are sensitive to red, green, and blue light. These are the three fundamental colors of the additive model. They are also used on computer screens (both CRTs and LCDs): Each pixel contains three subpixels that emit red, green, or blue light.
This model is commonly referred to as RGB. On the screen, the relative intensity of light in each subpixel determines what color is produced. If the three subpixels are all at maximum intensity, white light is produced. If they’re all at minimum intensity, they produce “black light” (i.e., no light). If they’re all at equal levels somewhere between the minimum and the maximum, gray light is produced. A lower intensity results in a darker final color.
Note that although the white light emitted by the sun contains the full wavelength range of visible light, we still perceive a white color when only three wavelengths are present. Whenever all three of the cone types are fully stimulated, we perceive something to be white.
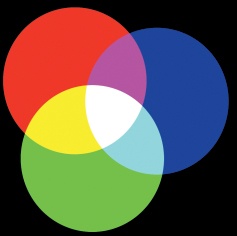
If light is emitted only by the subpixels of one of the fundamental colors, we see that color. If two different subpixels emit light, we get a complementary color, as shown in Figure A-36. Red and green produce yellow, red and blue produce magenta, and green and blue produce cyan. The three complementary colors also exist as monochromatic colors: They’re present in the solar spectrum as single wavelengths.
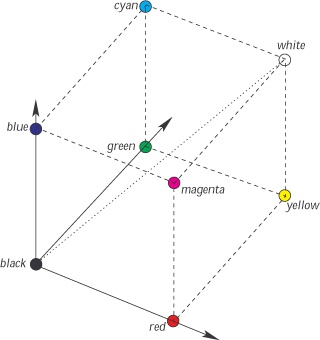
Because the three fundamental color values are in a limited subrange (usually [0 to 255]), the points they define in three-dimensional space are limited to a cube, as shown in Figure A-37. The corners of this cube are labeled with the fundamental colors, the secondary colors, and black and white. The diagonal that links the black corner (coordinates 0,0,0) to the white corner (coordinates 255,255,255) is the diagonal of grays. Each point is opposite the point of its complementary color.
The RGB cube defines the gamut of all colors that can be represented on a computer screen. This gamut is smaller than the visible gamut of colors that we can perceive, as shown in Figure A-26.
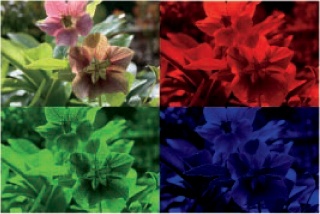
Figure A-38 shows an image decomposed into its three RGB channels. Brighter areas indicate areas where the corresponding channel is more active.
The RGB model is not intuitive: It requires a leap of faith or some serious thought to accept that adding red to green produces yellow. Most people think of color as pigments. When you mix red and green paint, you get something closer to brown, and if you mix the three fundamental colors, red, green, and blue, you get some darker color, not white. Pigment doesn’t follow the additive model.
Another challenge of the RGB model is that matching a particular color is difficult. For example, how do we get the color of a pink rose, clean copper, or mahogany wood? The answer could be 248,192,236 for the pink rose; 198, 113,76 for copper; and 100,0,0 for mahogany. All three of these materials appear to be dominated by red, yet pink and copper require a surprising amount of green and blue. (And the mahogany requires only a small amount of red.) Clearly, a more intuitive model would make image creation easier.

The subtractive model (also known as the CMY model) is used to produce color by absorption, as pigments do. Its three fundamental colors are the complementary colors in the RGB model: cyan, magenta, and yellow. Each fundamental color absorbs light of a certain wavelength. If the three colors are all at maximum value, they produce black. If they’re all at zero, they produce white. This model assumes that we’re adding color to a white surface.
Figure A-39 shows the three fundamental colors and their combinations. The complementary colors of the CMY model are the fundamental colors of the RGB model: Cyan plus magenta is blue, cyan plus yellow is green, and magenta plus yellow is red. When the intensity of all fundamental colors is low, the color is washed out.
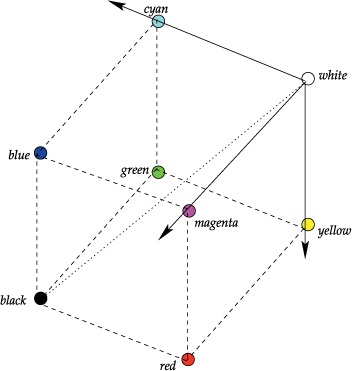
The CMY cube (shown in Figure A-40) is complementary to the RGB cube: The same colors are in the corners, but the coordinate values are the complement to the RGB coordinates. The gamut is the same because the cube is the same.
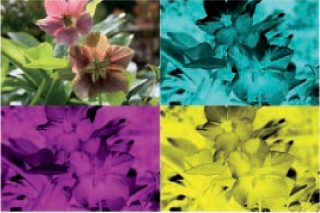
Figure A-41 shows the same image as Figure A-38 but decomposed into its three CMY channels. As before, the lighter areas indicate more active channels, but in this case, when all channels are active, an area is darker, which gives the channels a negative appearance.
The CMY model is the native model for printing. Microscopic dots of the fundamental colors are printed on paper, and their juxtaposition produces the effect of the subtractive method. Transparent inks can also be used in overlapping layers to produce a similar result. But generating a good black color using the three fundamental colors is difficult, and black ink is relatively cheap, so most printers also include black and use the CMYK model (K stands for black).
The values of these four channels are easily computed from the CMY values: K is the minimum (lowest value) across the three channels in a given pixel, and the other channels are replaced with their value minus K. Sometimes the printer requires a lower value for K, with corresponding changes in the other three channels to avoid overly dark, wet prints. In those cases, the values of the other channels are computed in a way that preserves the colors as best as possible.
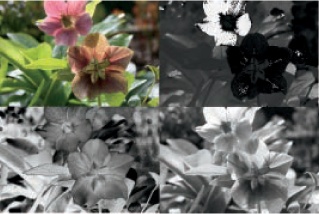
Figure A-42 shows the same image as Figure A-41 but decomposed into the four CMYK channels. We see the CMY channels are much darker than in Figure A-41, which means that much less ink is needed for printing this image.
Low-cost inkjet printers use only the four ink colors of the CMYK model. As the quality and cost of printers increase, the number of ink colors generally increases as well. Midrange printers frequently add a light cyan and a light magenta ink. High-cost printers, intended for professional photography, add several gray and black inks, which enhance unsaturated colors.
Neither the RGB model nor the CMY models are very intuitive to work with. Determining the purity, intensity, or hue of a given color when using those models is difficult because each color is represented abstractly as three coordinates.
In fact, some research has indicated that our visual system doesn’t simply transmit the three signals emitted by the three types of cones to the brain. The R, G, and B signals are first combined into R + G, R – G and B – (R + G). The R + G signal corresponds to what is called luminance. Luminance is equivalent to the value dimension in pigment colors, which goes from black to white. The blue component doesn’t contribute to the perceived lightness or darkness of a given color, possibly because of the very small proportion of blue cones present in the retina. The two other values (R – G and B – (R + G)) represent the chrominance, or the hue of the color. These concepts contributed to the CIE standards and the chromaticity diagram shown in Figure A-26.
The HSV model is based on these concepts and is designed to be a more intuitive way to represent colors. Conversions are required to switch between HSV and the other two models, but any modern computer can easily handle the computations needed. This model is the best one to use when you want to choose a color or build a color scheme for a project. The CMYK model is useful only for printing, and, in fact, most software tools for printing make the necessary conversion at the last minute, using information specific to the printer being used. The RGB model is a very important model because all images are internally represented using it. To sum up, images are stored as RGB, the HSV model provides an intuitive way to choose colors, and printing software usually converts an image to CMYK just before printing it.
Now let’s look more closely at the HSV model, which is shown in Figure A-43. It contains three coordinates:
H is the hue. The hue is a value on a color wheel that ranges from 0 to 360 degrees. Red is 0°, and the hue wavelength decreases as the angle increases.
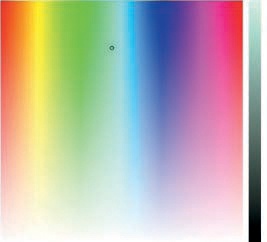
Figure A-43 represents the color wheel as an unrolled cylinder. The “angle” increases from 0 on the left to 360 on the right. Most of the colors shown are monochromatic, except for purple, which is present at the transition between red and violet.
S is the saturation. Saturation is represented as a percentage: Full saturation (pure color) is 100%, and white (no color) is 0%. As the percentage decreases, the color becomes more washed out. In Figure A-43, the saturation is represented by the vertical dimension of the unrolled cylinder and goes from 0 (at the bottom) to 100 (at the top).
V is the value. Value is also a percentage: Fully luminous is 100%, and black (no luminance) is 0%. When the percentage decreases, the color darkens. In Figure A-43, the value is the vertical bar on the right, from 0 (at the bottom) to 100 (at the top).
The small circle in Figure A-43 specifies a precise color (a slightly desaturated cyan hue). The value bar shows this hue at the top and darkens it as it goes down.
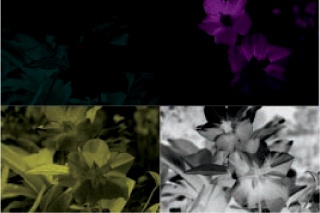
Figure A-44 shows the decomposition of an image into the three channels of the HSV model. Because the H and S channels are represented here as grayscale images, they aren’t really meaningful. But the V channel is a good representation of the image in grayscale.
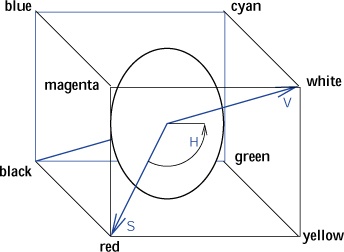
Graphically representing the relationship between the HSV model and the RGB model is not easy. Figure A-45 shows the HSV circle and its vectors inside the RGB cube.
The space defined by the three values of the HSV model is represented as a cylinder. But black fills the cylinder’s entire bottom. The conical representation, shown in Figure A-27, eliminates that redundancy by representing black as the point of the cone and white as the center of the top circle.