Our interest in studying intrafamily relationships began serendipitously because membership in a health maintenance organization is usually held on a family rather than an individual basis. Our sampling procedures therefore yielded sub-samples of married couples. More recently, exposure to the behavior genetics literature suggested that the Seattle Longitudinal Study (SLS) would be a natural vehicle for studying family similarity in the general (nontwin) population, and we began to gather data systematically on many adult children and siblings of our longitudinal panel members.
Similarity between married couples has usually been examined in the context of marital assortativity. Previous researchers have found significant correlations between spouses on a number of cognitive abilities and personality dimensions (see Murstein, 1980; Zonderman, Vandenberg, Spuhler, & Fain, 1977). The observed similarity was typically explained as based on initial couple similarity, the convergence of abilities over the marriage, the divorce of couples who are dissimilar, or confounds because of age-related trends (Price & Vandenberg, 1980). Cross-sectional research designs have dominated research in this field, and findings are thus based on comparisons of similarity within couples of different marriage durations. By contrast, we were able to examine a longitudinal sample of married couples for whom we could investigate change in couple similarity over time on our measures of cognitive abilities and cognitive styles (Gruber-Baldini & Schaie, 1986; Gruber-Baldini, Schaie, & Willis, 1995; Hoppmann, Gerstorf, Willis, & Schaie, 2011).
This study addressed five questions. First, we asked to what degree couples’ scores are similar on cognitive and cognitive style measures and whether spousal similarity varies across abilities. Second, we raised the question of whether further convergence occurs, as couples remain married for long periods of time. Third, we inquired whether the observed level of similarity is attributable to spousal similarity on background variables such as age and education. Fourth, we examined whether convergence is a product of changes of both spouses or whether one spouse is more likely to move closer to the other’s level of functioning over time. And finally, we inquired whether the obtained cognitive similarity also generalized to other variables of importance in long-time relationships, such as congruence of the perception of life satisfaction.
We were able to identify 169 married couples with both partners participating in at least two SLS waves. Couples entered the study in 1956, 1963, or 1970. Data are available over 7 years for 150 couples, over 14 years for 106 couples, and over 21 years for 66 couples. At initial testing, participants ranged from 22 to 79 years of age. The participants included in the 21-year analyses (mean age 42.31 years) were slightly younger than those in the 7-year (mean age 44.94 years) and 14-year (mean age 43.18 years) data sets. There were no significant differences in educational, income, and occupational characteristics.
Variables included in the couples analyses consist of the five Primary Mental Abilities (PMA) subtests (Verbal Meaning, Spatial Orientation, Inductive Reasoning, Number, and Word Fluency), the composite indices of Intellectual Ability and Educational Aptitude, the three factor scores from the Test of Behavioral Rigidity (Motor-Cognitive Flexibility, Attitudinal Flexibility, and Psychomotor Speed), the questionnaire scale of Social Responsibility, and a Likert scale measuring perceived life satisfaction.
The initial correlations among spouses were statistically significant for Verbal Meaning, Inductive Reasoning, and Word Fluency as well as the Index of Educational Aptitude and the Social Responsibility scale in all three data sets. The correlations remained significant when controlling for age and educational level of the spouses. Changes (increases) in similarity among couples across time were significant for Verbal Meaning and the Index of Intellectual Ability as well as for the factor scores in Attitudinal Flexibility.
Examination of cross-lag panel correlations suggested that the question of which spouse has more influence on the other may be ability and time specific. The earlier Inductive Reasoning scores of the husbands positively influenced their wives’ Inductive Reasoning scores 7 years later, and wives’ Verbal Meaning scores influenced their husbands’ Verbal Meaning scores 14 years later.
When couples were divided according to which spouse had the higher initial score, the lower spouses’ Attitudinal Flexibility influenced the higher spouses’ Motor-Cognitive Flexibility 7 years later. When both age and education were controlled, the higher functioning spouses’ Word Fluency had a positive effect on the lower functioning spouses’ Word Fluency and Verbal Meaning scores over both 7 and 14 years.
Couples were also classified on the basis of whether they became more similar or more different or had not significantly changed in magnitude of similarity over a 7-year interval. Couples who became more similar on the ability variables had husbands with higher occupational levels. Couples whose similarity did not change significantly over time had husbands with fewer changes of profession. Couples who became more dissimilar over time had husbands who changed professions more frequently.
A recent secondary analysis (Hoppmann et al., 2011) has considered the hypothesis that the development of feeling of happiness does not occur in isolation and is often interrelated with close others such as marital partners. To examine interrelations in spousal happiness across midlife and old age, longitudinal data from the SLS over 35 years were examined for both members of 178 married couples.
Happiness was measured using responses to the item “Would you describe your life until the year X (current study wave) as being …” with answers provided on a 5-point Likert scale ranging from “very happy” (1) to “very unhappy” (5). The item was asked as part of a larger personal data form filled out by participants to survey background characteristics and has been administered in the same version since the inception of the SLS. Responses were reverse coded so that higher scores reflect reports of higher happiness. Similarly worded happiness items are regularly assessed in large-scale longitudinal panel studies and have been widely used in psychological research (e.g., Fujita & Diener, 2005; Gerstorf et al., 2008; Lucas, 2007).
To control for potential confounds, some of our models included individual (age and education) and spousal factors (number of children and length of marriage) at baseline time-invariant covariates. Information about each covariate was obtained from the self-administered personal data form.
To examine spousal interrelations in change in happiness, we used a two-variable latent growth curve model (LGM; McArdle, 1988). As a straightforward extension of a univariate LGM, a two-variable LGM estimates fixed effects (average levels and slopes) and random effects (interindividual differences in levels and slopes). The repeated measures of wives and husbands have three sources: (a) the latent intercepts with loadings of 1 (x0, y0), (b) the latent slopes with linear loadings (xs, ys), and (c) the time-specific residuals (ex[t], ey[t]). Intercepts and slopes are estimated at the population level and are allowed to vary and covary. The time-specific residuals are assumed to have a mean of zero and exhibit occasion-specific variances.
Pairwise structuring of the data allowed us to treat the spousal couple as the unit of analysis. In total, the model estimated 26 free parameters. Models were estimated based on all data points available using the full information maximum likelihood estimation algorithm, which allowed accommodating incomplete data under the missing at random assumption (Little & Rubin, 1987). We used the Mplus program version 4 (Muthén & Muthén, 1998–2006). Three sets of models were tested. In a first step, we estimated separate growth processes for happiness of wives and husbands and determined if interindividual differences in one growth process relate to interindividual differences in the other growth process. In a second step, we additionally included individual factors (age and education of both partners) and spousal factors (number of children and length of marriage at T1) into our models and examined if spousal interrelations in happiness exist over and above these covariates. The covariates were specified as having their own means, variances, and covariances as well as regression effects on intercepts and slopes of both partners. In a final step, we randomly paired women and men from the SLS couple sample, applied the two-variable LGM to the newly paired sample, and by using a multigroup setup determined if the size of the partner associations were comparable to those found between the real SLS couples.
Fixed effects indicate that both spouses showed on average minimal and statistically nonsignificant decline in happiness. Also, statistically nested model comparisons revealed that wives and husbands did not differ reliably from one another in either average level (Δχ2/df = 0.5/1, p > .10) or slope (Δχ2/df = 0.1/1, p > .10). More importantly, there were between-person differences in the rate of change among both wives and husbands, indicating that some individuals declined in happiness, whereas others remained relatively stable or reported more happiness over time. Intercorrelations revealed that these between-person differences were considerably interrelated between spouses, both in terms of level (r = .54) and slope (r = .85). For the primary question under study, analyses thus revealed sizable spousal similarities both in reports of happiness and in how happiness changes over time.
In a second set of models, we covaried for several baseline individual and spousal variables that may have contributed to the above pattern. More specifically, we included age and education of both partners as well as the number of children and length of marriage at T1 as time-invariant covariates. Findings revealed essentially the same pattern as above with substantial intercorrelations between both intercepts and rates of change between partners. It should be noted that the covariates (particularly age and education) contributed significant portions of overall explained variance to the model parameters (wives’ level: R2 = .089, wives’ change: R2 = .116, husbands’ level: R2 = .089, and husbands’ change: R2 = .194). Of pivotal interest for the question under study, however, was that inclusion of individual and spousal covariates thus did not substantively alter the spousal relations reported.
In a final step, we examined if spousal interrelations go beyond what might be expected in random pairs of participants from the same birth cohorts. To do so, we randomly paired women and men from the same 356 SLS couple participants and reran the above two-variable LGM. We decided to use random pairs over matched pairs because matched pairing would have had to be based on a limited and not necessarily comprehensive number of variables. Random pairs thus offer a rigorous test of our hypothesis, particularly because we reran the analyses 10 more times with new randomly selected pairs to make sure that our findings are not simply based on chance.
Findings indicated that the size of the intercorrelation between these random partners (intercept correlation = –.22, p > .10; slope correlation = –.16, p > .10) were considerably smaller for both levels and slopes than those found among actual spouses in the SLS (intercept correlation = .54; slope correlation = .85). Statistically nested model comparisons using a two-group approach (real couples vs. random pairing) corroborated this pattern. More specifically, substantial losses in model fit were found when intercept correlations were set to be invariant across groups (Δχ2/df = 24.5/1, p < .001) and when slope correlations were set to be invariant across groups (Δχ2/df = 5.3/1, p < .05). Also, when we randomly paired men and women separately among earlier-born cohorts (born 1920 or before) and later-born cohorts (born 1921 or after), the substantive pattern of results remained unchanged (loss in model fit for level invariance: Δχ2/df = 12.5/1, p < .001; loss in model fit for slope invariance: Δχ2/df = 5.1/1, p < .001).
Developmental behavior genetics has recently begun to focus on change. This is often surprising to those developmentalists who tend to associate the adjectives genetic and stable. However, longitudinally stable characteristics do not necessarily have a hereditary base, and genetically influenced characteristics are not necessarily stable (Plomin, 1986). The identification of genetic sources of developmental change is important because change prevails over continuity for most aspects of development. For this reason, a major task for developmental behavior genetics is to explain longitudinal change as well as continuity. It should be emphasized that only longitudinal studies are able to assess genetic change and continuity.
A second issue receiving attention by developmental behavior geneticists is that of nonshared environmental influence. In general, behavioral genetic research provides the best available evidence for the importance of environmental influences. This is because environmental influences have been found to make individuals in the same family as different from one another as are pairs of individuals selected at random from the population. In other words, psychologically relevant environmental influences make individuals in a family different from, not similar to, one another (see Plomin & Daniels, 1987).
The relevance of this issue to our research lies in the usefulness of parent–offspring comparisons for identifying specific sources of nonshared environmental influence by relating experiential differences within pairs to behavioral differences within pairs. The key question in environmental research is why individuals in the same family are so different from each other. This question can only be addressed by studies that include more than one individual per family.
From a behavioral genetic perspective, relatively little is known about the origins of individual differences in cognitive abilities, personality, and adjustment during the last half of the life span (McClearn & Vogler, 2001; Plomin & McClearn, 1990). As our analyses have demonstrated, there are vast individual differences in intellectual change across adulthood, ranging from early decrement for some persons to maintenance of function into very advanced age for others; a basic and fundamental research goal therefore must be to account for this individuality in aging. Most behavior genetic research in adulthood involves offspring in their late teens, typically toward the end of high school or at the time of military induction (see Plomin, 1986). In the handful of studies that included older adults, the average age of the sample was typically in the 20s or 30s, and the age range was so great that it was difficult to conduct cross-sectional analyses of family resemblance as a function of age.
The first systematic behavior genetic study in middle and old age was conducted by Franz Kallman and Gerhard Sander (1948, 1949) in the 1940s. Over 1,000 pairs of twins in New York were studied biennially, with a primary emphasis on physical aspects of aging. Psychological tests were administered to 75 identical and 45 fraternal twin pairs between the ages of 60 and 89 years who were selected for cognitive testing on the basis of concordance for relatively good health, lack of institutionalization, and literacy (Kallman, Feingold, & Bondy, 1951). The results were analyzed in terms of intrapair differences rather than correlations: Identical twins showed significantly smaller intrapair differences than fraternal twins, with the exception of memory tests involving simple recall of recent material, suggesting the importance of genetic influence on individual differences in cognitive functioning later in life. Small samples of surviving twins were studied again in 1955 (Jarvik, Kallman, Falek, & Kleber, 1957) and 1967 (Jarvik, Blum, & Varma, 1971). In 1967, when the surviving intact pairs were from 77 to 88 years old, 19 pairs (13 identical and 6 fraternal) were studied again by seven tests of cognitive abilities. This longitudinal sample, however, was so small as to vitiate the comparison of identical and fraternal twin correlations.
Perhaps the major behavior genetic studies of older adults, with participants obtained from the Swedish twin registry, are currently being conducted in Sweden with a sample of twins reared apart and matched twins reared together (for a major review of the Swedish twin studies, see Pedersen & Liechtenstein, 2000; Smedby, Lundberg, & Sørensen, 2000). In the aging twin study, questionnaire data on personality and many other variables were collected for over 300 pairs of twins reared apart and matched pairs of twins reared together, with an age range from 50 to 80 years (Pedersen et al., 1991; Pedersen & Reynolds, 1998; Plomin, Pedersen, Nesselroade, & Bergeman, 1988). The second phase of this study involves individual biomedical and behavioral testing of 50 pairs each of identical and fraternal twins reared apart and matched pairs of identical and fraternal twins reared together. A second wave of testing occurred after 3 years, and a third wave occurred 6 years after initial testing (Finkel, Pedersen, McClearn, Plomin, & Berg, 1996; Finkel, Pedersen, Plomin, & McClearn, 1998).
By contrast, the research reported here capitalizes on the longitudinal design of the SLS to offer an “instant” longitudinal study of parents and offspring from young adulthood through middle age. Because parents and offspring share family environment as well as heredity, our family design cannot unambiguously disentangle the contributions of heredity and shared environment on familial resemblance. The family design used here, however, has some important advantages over twin and adoption designs. Twins have environmental experiences in common to a much greater extent than do first-degree relatives; furthermore, twin studies estimate higher-order genetic interactions (i.e., epistasis) unique to identical twins. Thus, the results of twin studies may not generalize to the usual case of first-degree relatives in terms of either environmental or genetic factors. Early-adopted individuals are rare, difficult to find later in life, and may differ from nonadopted individuals in terms of the family environments they experience. Also, adoptees are often selectively placed in their adoptive families, thereby attenuating the separation of genetic and environmental influences when the adoption design is used (Plomin, 1983).
Family studies are valuable because first-degree relatives represent the population to which we wish to generalize the results of behavioral genetic investigations. Furthermore, family studies provide upper-limit estimates of genetic influence—that is, additive genetic influence cannot exceed estimates based on first-degree relatives. Although familial resemblance could reflect family environment as well as shared heredity, which is why estimates of genetic influence are called upper-limit estimates, it appears that shared environmental influences are of negligible importance to personality, psychopathology, and cognitive abilities after adolescence (Plomin, 1987; Plomin & Daniels, 1987). In other words, the important environmental factors in development are no more experienced in common by individuals in the same family than they are for pairs of individuals picked at random from the population. Thus, as a first approximation, it is not unreasonable to assume that familial resemblance later in life is primarily mediated genetically.
Our study is a reasonable first step in understanding the etiology of individual differences in functioning later in life, even if a conservative interpretation is taken, in the sense that familial resemblance is not interpreted as exclusively genetic in origin. The family design asks the extent to which individual differences are caused by familial factors, whether genetic or environmental, and it provides upper-limit estimates of genetic and shared family environmental influences.
The long-term longitudinal nature of the SLS provides a unique opportunity to study relatives tested at roughly the same age; differences in same-age comparisons of sibling resemblance and parent–offspring resemblance as a function of year of birth yield a novel test of cohort effects. In addition to these same-age comparisons, the SLS data archives make it possible to trace parent–offspring resemblance forward in time by comparing same-age resemblance of parents and offspring to resemblance when the parents are 7, 14, 21, 28, and 35 years older.
Because behavior genetic data during the last half of the life span are sparse, it was not possible to propose well-founded hypotheses that could be tested with our data. However, four categories of hypothesis were delineated and addressed in this investigation:
1. Family similarity in cognitive abilities will be found throughout adulthood, and the relationship will be stronger for verbal ability than for other cognitive abilities. It is expected that at least modest parent–offspring correlations will be found for all cognitive abilities. However, we also expect that greater similarity will be found for verbal ability. Although evidence is not good that any specific cognitive ability is more heritable than any other (DeFries, Vandenberg, & McClearn, 1976), there is some evidence that shared family environmental factors are greater for verbal abilities than for other cognitive abilities (Plomin, 1987). This hypothesis seems reasonable when the possibilities for training and modeling are considered, for example, for vocabulary as compared with spatial ability. For this reason, we predict that familial resemblance will be greater for the two verbal tests, Verbal Ability and Word Fluency, than for other abilities. Further, if this effect were caused by shared family environment, we would expect the effect to diminish with age.
2. Familial resemblance in cognitive abilities is expected to increase from early adulthood to middle adulthood. It is generally assumed that nonnormative experiences increase in importance during development (Baltes, Reese, & Lipsitt, 1980), which would lead to the prediction that familial resemblance for cognitive abilities should decrease during adulthood. However, four recent behavior genetic studies of adoptive siblings all indicated that shared family environmental influences that affect general cognitive ability are of negligible importance after adolescence (Plomin, 1987). This means that the environmental component of familial resemblance does not appear to change during adulthood. In contrast, there is some evidence that genetic influence increases in importance during adulthood (Plomin & Thompson, 1987). If genetic influence increases, we are led to the counterintuitive (from an environmental perspective) hypothesis that familial resemblance in cognitive abilities increases later in life, decades after family members have left their shared family environment. To test this hypothesis, familial resemblance will be examined as a function of age.
3. Familial influences are expected to exert long-term effects on cognitive abilities throughout the adult life course. If it is assumed that shared environmental influences are relatively unimportant in adulthood (implying that such influences do not contribute to family resemblance), one would not expect to find—strictly from an environmental perspective—familial resemblance with either same-age or cross-age comparisons. However, there is increasing evidence that genetic influence on cognitive abilities shows substantial continuity throughout adulthood (Plomin & Thompson, 1987). For example, model-fitting analyses of adoption data have indicated that genetic effects in childhood are highly correlated with genetic effects in adulthood for IQ (DeFries, Plomin, & LaBuda, 1987). This leads to the prediction that long-term familial (presumably genetic) effects will produce familial resemblance in cognitive abilities even when one family member is assessed at a very different age from another family member. This hypothesis can be tested by assessing family resemblance cross-sectionally over a wide range of ages as well as longitudinally within the same data set. The simplest analytic approach to this problem is to test whether familial resemblance differs as a function of the interval at which the family members were assessed (see also Schaie, 1975, for alternative methods of analysis).
4. Cohort effects will be seen in that parent–offspring correlations will be greater for earlier cohorts of adult offspring. The striking finding that shared family environmental influence is negligible for cognitive ability after adolescence has been studied only in recent cohorts. Earlier cohorts will show greater shared family environmental influence if the influence of the family on cognitive scores has declined or if the importance of extrafamilial influences such as television has increased. Older and younger cohorts of parent–offspring relatives yield the same expectation of genetic similarity unless the magnitude of assortative mating has changed (see Gruber-Baldini. Schaie, & Willis, 1995). As a test of the hypothesis of cohort effects, parent–offspring resemblances were assessed as a function of year of birth.
Parent–offspring similarities have traditionally been studied in young adult parents and their children. In this section, I describe longitudinal data collected on similarity of parents and adult offspring considered specifically as a function of the age of parent–offspring pairs when studied (see Schaie, Plomin, Willis, Gruber-Baldini, & Dutta, 1992; Schaie et al., 1993).
The participants in this study consisted of the adult offspring (aged 22 years or older in 1990) of members of the SLS panels and their target relatives. Those members who participated in the fifth cycle of the SLS had a total of 3,507 adult children. Of these, 1,416 adult children (701 males, 715 females) resided in the Seattle metropolitan area.
The adult offspring were recruited in two ways: (a) A letter containing an update report on the SLS was sent to all study participants tested in 1983–1984. This letter also announced the family resemblance study and requested that panel members provide names and addresses of siblings and offspring. A recruitment letter was then sent to all offspring thus identified. (b) We also searched the participating health maintenance organization records to identify offspring and siblings of longitudinal panel members who had dropped out because of death or illness. Offspring of some panel members were also identified because they were included in their parents’ service contracts. Surviving spouses were also identified in the same manner and were used as informants to obtain addresses for offspring of deceased panel members.
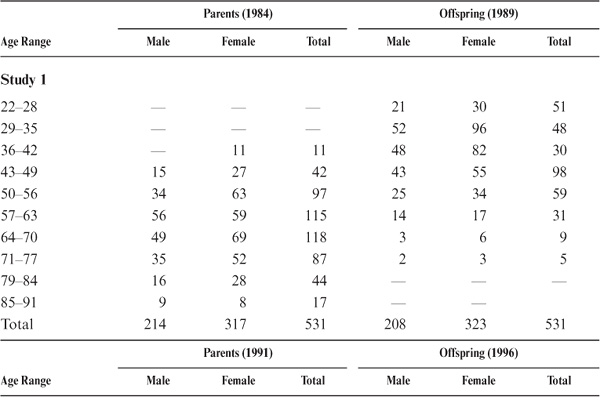
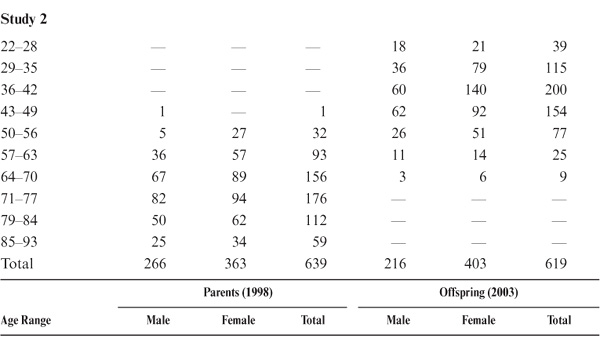
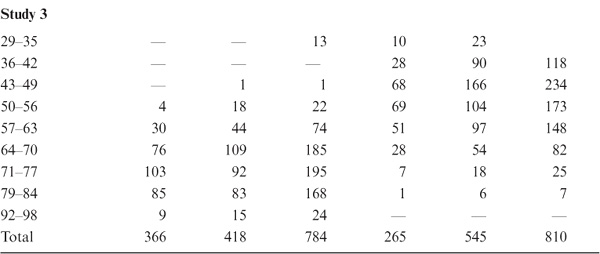
We were able to test 531 adult offspring. Of these study participants, 439 (82.7%) resided in the Seattle metropolitan area; the remaining 92 (17.3%) were scattered throughout the United States and Canada. The offspring in 1990 ranged in age from 22 to 74 years (M = 40.43; SD = 10.45). Target parents ranged in age from 39 to 91 years at the time they were last tested in 1984 (M = 63.66; SD = 10.89). All participants were community-dwelling individuals when tested. This data set included 99 father–son pairs, 211 mother–daughter pairs, 115 father–daughter pairs, and 106 mother–son pairs. A second set of 620 adult children of participants in the 1991 wave of the main study was recruited in 1996. The second data set consisted of 619 adult children, including 105 father–son pairs, 223 mother–daughter pairs, 151 father–daughter pairs, and 111 mother–son pairs. Finally, a third set of 574 adult children of participants in the 1998 wave of the main study were recruited in 2003, including 89 father–son pairs, 221 mother–daughter pairs, 143 father–daughter pairs, and 121 mother–son pairs. Data on age and sex distribution of parents and offspring by subset are provided in table 15.1.
The test battery administered to the participants in this study is a subset of measures administered to their parents. It includes the PMA tests of Verbal Meaning, Spatial Orientation, Inductive Reasoning, Number, and Word Fluency. In addition, the Educational Testing Service (ETS) Finding A’s test was included as a measure of perceptual speed, and the Test of Behavioral Rigidity was used to assess cognitive styles.
TABLE 15.1. Age and Sex Distribution of Parent–Offspring Study Participants

Potential participants who agreed to participate were scheduled by telephone for group assessment sessions. Size of the groups ranged from 5 to 20, depending on the age of the participants. The testing sessions lasted approximately 2.5 hours plus a take-home package of questionnaires requiring approximately an additional hour of effort. Each session was conducted by a psychometrist, aided by a proctor whenever more than five participants were tested simultaneously. Participants were paid $25 for their participation.
Regression analyses were employed to analyze parent–offspring resemblance and to determine the extent to which familial resemblance differs as a function of other variables, such as age and testing interval, as well as other variables such as gender, time of measurement, and demographic factors (DeFries & Fulker, 1985; Ho, Foch, & Plomin, 1980; Zieleniewski, Fulker, DeFries, & LaBuda, 1987). This least-squares model fitting represents a straightforward approach to the analysis of such simple designs as the family design, in which we do not attempt to differentiate genetic and environmental components of variance. For example, we may regress out the effects of parent and offspring age to obtain net estimates of the parent–offspring correlations. Alternatively, we may ask the question of whether the family similarity differs as a function of offspring age. Using hierarchical multiple regression (Cohen & Cohen, 1975), we regressed the parent’s score on three predictors: (a) the offspring’s score, (b) the offspring’s age, and (c) the interaction between offspring age and performance. A significant standard partial regression coefficient for the interaction of offspring score and age indicates that family resemblance differs as a function of offspring age.
In addition to these straightforward analyses of familial resemblance and its interaction with other variables, genetic analyses can be conducted if the assumption is made that shared environment does not contribute to familial resemblance, in other words, if it is assumed that familial resemblance is caused solely by hereditary factors. As indicated here, this appears to be a reasonable assumption for cognitive abilities in adulthood; however, the novelty of this conclusion and the need for more data to confirm it limit the following genetic analyses to exploratory ventures rather than precise estimates of genetic parameters. If the assumption is made that shared environment does not contribute to familial resemblance in cognitive abilities, doubling parent–offspring correlations provides estimates of heritability—the proportion of phenotypic variance that can be explained by genetic variance (see also Plomin, DeFries, & McClearn, 1980). If, for example, a same-age parent–offspring correlation of .30 were obtained for the PMA Spatial Orientation test, it would suggest a heritability of .60 if shared environment does not contribute to the parent–offspring similarity. The rest of the variance is nongenetic; some of the nongenetic variance involves error of measurement, and the remainder is caused by nonshared environment. The regression analyses described above provide estimates of heritability across ages, with interactions between familial resemblance and age defining age trends in heritability.
It should again be emphasized that heritability is a descriptive statistic and thus will change as the relative contributions of genetic and environmental influences change in different populations or during development. These statistics imply no more precision than do other descriptive statistics; as for all descriptive statistics, standard errors of estimate need to be consulted to evaluate precision. Most important, heritability does not imply immutability: It simply refers to the proportion of observed interindividual variance in a population that is caused by genetic differences among individuals.
Findings on parent–offspring similarity are first presented in terms of the correlation of parental performance with that of their offspring, as well as of adjusted coefficients when the regression of parental and offspring age on the dependent variables has been removed. Next, the stability of parent–offspring correlations across time (and age) is considered. The possible effect of shared environment is then reported by considering the correlation of intensity of current contact between parents and offspring. Age/cohort differences in the magnitude of parent–offspring correlation are also examined. Finally, the magnitudes of generational differences in level within families and changes in the magnitude of these differences for successive cohort groupings are considered.
As shown in table 15.2 and figure 15.1, parent–offspring correlations for the total sample were statistically significant (p < .05) for all variables studied except for the trait measure of Social Responsibility. Among the ability measures, correlations were highest for Inductive Reasoning, Word Fluency, and the Intellectual Ability composite measure. They were lowest for the measures of Perceptual Speed (the Finding A’s test) and Verbal Meaning. Among the cognitive style measures, correlations were highest for Motor-Cognitive Flexibility and lowest for Attitudinal Flexibility.
Because of the wide age range among parents and offspring (and to model the assumption of equal ages), we partialed out the effects of parent and offspring age. The correlations adjusted for age at the most recent test are provided in table 15.3 and figure 15.2. Subsequent to the age adjustment, all but the measures of Perceptual Speed and Social Responsibility remain statistically significant (p < .01). However, the magnitudes of the correlations change somewhat, with Word Fluency and Verbal Meaning now displaying the highest ability correlations, along with the composite indices of Intellectual Ability and Educational Aptitude. Both Motor-Cognitive Flexibility and Psychomotor Speed continue to show higher family resemblance than does Attitudinal Flexibility.
TABLE 15.2. Correlation of Parents and Offspring

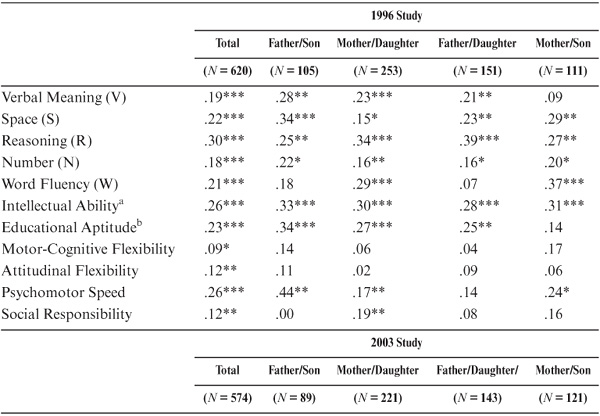
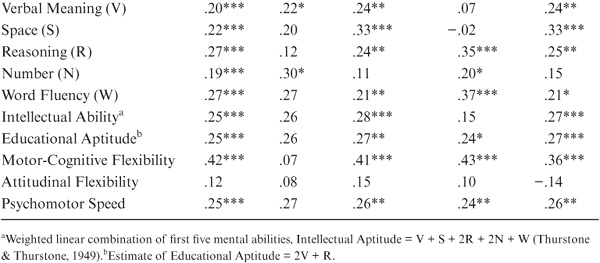
FIGURE 15.1. Parent–offspring correlations.
The correlational findings are not uniform across subsets. When raw parent–offspring correlations are examined (table 15.2 and figure 15.1), statistically significant correlations (p < .05) between fathers and sons are found only for Verbal Meaning, Number, and Educational Aptitude. For the mother–daughter set, however, statistically significant correlations (p < .05) are found for all variables except Attitudinal Flexibility and Social Responsibility. Correlations between fathers and daughters are statistically significant (p < .05) for Spatial Orientation, Inductive Reasoning, Number, Word Fluency, the Index of Intellectual Ability, and Motor-Cognitive Flexibility. Finally, for the mother–son set, statistically significant (p < .05) correlations are found for Spatial Orientation, Inductive Reasoning, Word Fluency, Intellectual Ability, Motor-Cognitive Flexibility, and Psychomotor Speed.
When age of parent and offspring is controlled, further differences between subsets are observed (see table 15.3). Statistically significant correlations (p < .05) between fathers and sons are now found for Verbal Meaning, Word Fluency, Inductive Reasoning, Number, Intellectual Ability, Educational Aptitude, and Psychomotor Speed. For the mother–daughter set, however, statistically significant correlations (p < .05) continue to be found for all variables except Spatial Orientation, Attitudinal Flexibility, and Social Responsibility. Correlations between fathers and daughters remain statistically significant (p < .05) for the same variables as for the raw correlations. For the mother–son set, statistically significant correlations (p < .05) are now found for Verbal Meaning, Spatial Orientation, Inductive Reasoning, the composite indices, Motor-Cognitive Flexibility, Attitudinal Flexibility, and Psychomotor Speed.
TABLE 15.3. Correlation of Parents and Offspring Adjusted for Age at Test
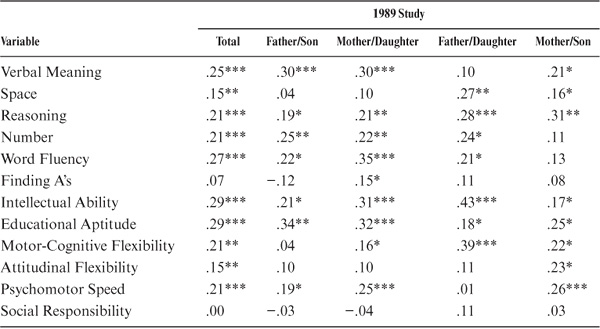
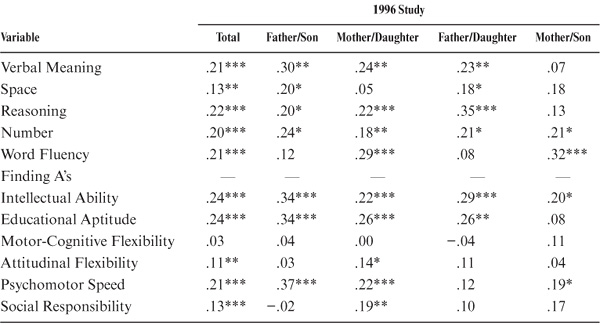
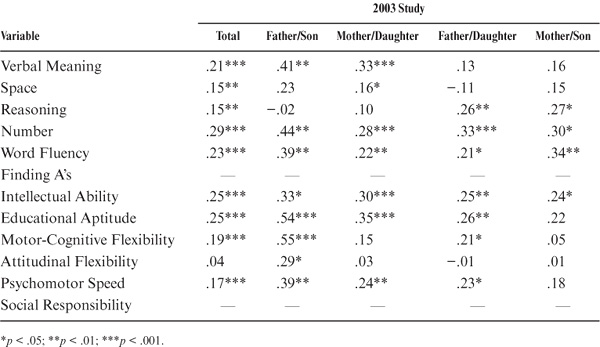
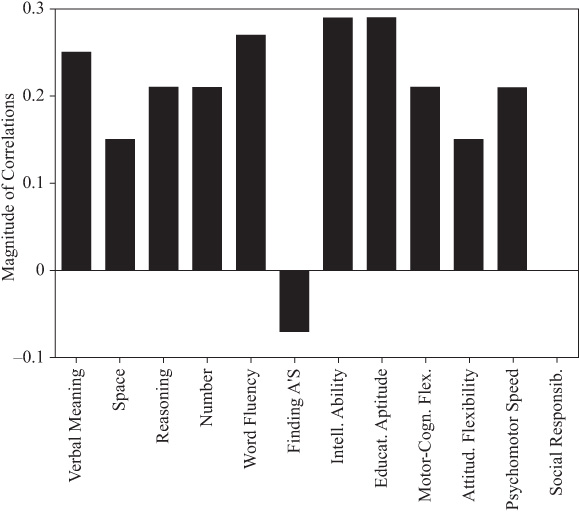
FIGURE 15.2. Parent–offspring correlations adjusted for age.
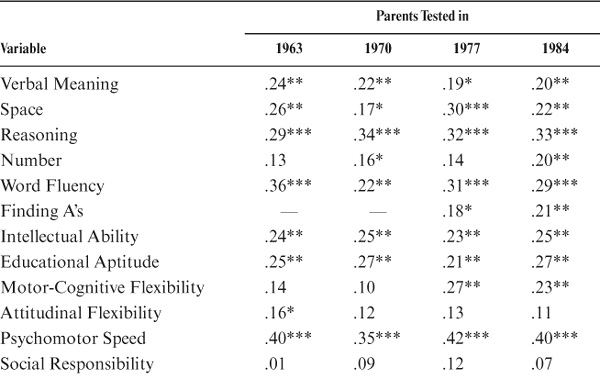
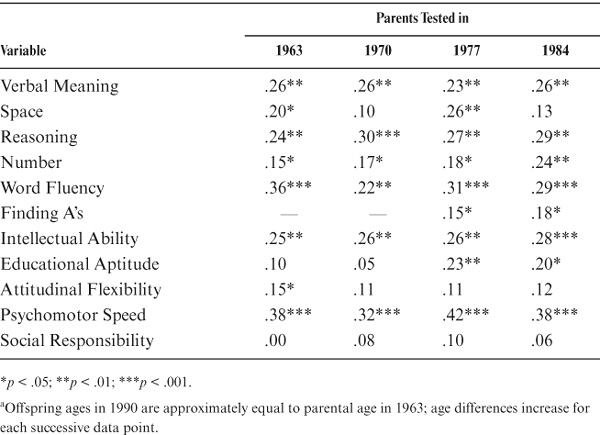
One of the critical issues in studying family similarity in adulthood is to determine whether such similarity remains stable or changes as the distance in age at time of assessment between parent and offspring increases. To examine stability of correlations with a sufficiently large sample, we considered for this analysis only those parent–offspring pairs for whom at least four data points (1963, 1970, 1977, and 1984) were available for the parents, yielding a set of 162 participant pairs tested 6, 13, 20, and 27 years apart, respectively. Note that, for the first data point, parents were close to the same age as that at which their offspring were tested in 1990. The first half of table 15.4 and figure 15.3 show the stability results in terms of raw correlations. Note that there is good stability of parent–offspring correlations for all variables. For this data set, however, values for Social Responsibility do not reach statistical significance at any time point; for Attitudinal Flexibility, significance is reached only for the 1963 comparison, and for Number, it is reached only for 1970 and 1984.
For comparability with the initial analyses, age also was controlled for in the stability analyses. Relevant data are reported in the second half of table 15.4. The observed stability of parent–offspring correlations remains impressive. After age adjustment, values for Social Responsibility continue to fail to reach statistical significance. All values are now significant for Number, but Spatial Orientation is significant only for the 1963 and 1977 comparisons, Motor-Cognitive Flexibility reaches significant levels only in 1977 and 1984, and Attitudinal Flexibility is significant only in the 1963 comparison.
TABLE 15.4. Parent–Offspring Correlations as a Function of Timea
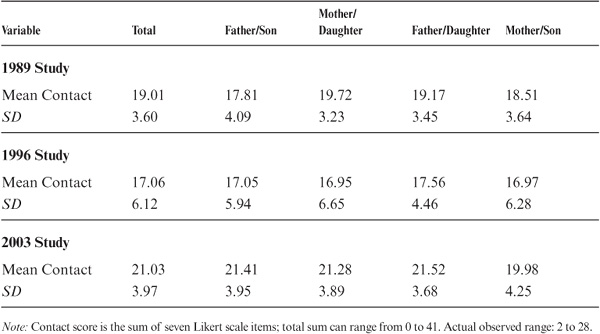
All offspring were asked to indicate on a multiple Likert scale questionnaire the intensity of their current contact with their parents. As can be seen from table 15.5, intensity of contact was slightly greater for daughters than sons; contact was greatest for the mother–daughter and lowest for the father–son sets; the last two sets differed significantly (p < .01). Degree of contact, however, did not significantly correlate with the age of parent or offspring. In the 1996 study, absolute amounts of contact had been reduced by about 10% over 1989, and the differences between sets were no longer significant. There was a significant increase in average contact for all sets, with significantly more contacts for the father–daughter than the mother–son sets. Detailed analysis of the increased contact suggested it to be attributable largely to a marked increase in e-mail contact in all sets.
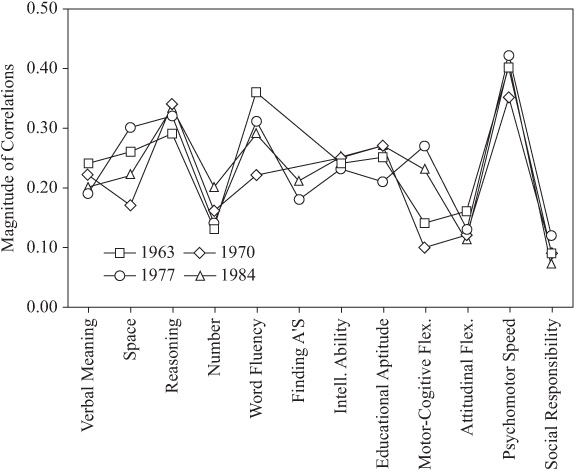
FIGURE 15.3. Stability of parent–offspring correlations.
Magnitudes of parent–offspring resemblance adjusted for age were reexamined to consider the effect of contact. This analysis led to slight upward adjustment of some coefficients, but all significant regressions for intensity of contact were negative. That is, parent–offspring resemblance was greater with less contact. Significant statistical effects of contact (p < .05) were found for the total sample only for Verbal Meaning, Spatial Orientation, Number, and Attitudinal Flexibility.
TABLE 15.5. Contact of Parents and Offspring
The magnitude of parent–offspring correlations is next considered as a function of age/cohort membership. Because most of our participants (whether parents or adult offspring) were assessed at ages for which stability of cognitive performance is the rule rather than the exception (see Schaie, 1983b, 2005a), it makes sense to organize these data by cohort rather than by age. For this reason, we divided the total sample into a youngest cohort (N = 199; birth years 1955 to 1968), a middle-aged cohort (N = 228; birth years 1931 to 1954), and an older cohort (N = 104; birth years before 1931).
As can be seen from table 15.6 and figure 15.4, there are substantial differences in pattern and magnitude of correlations. Parent–offspring correlations for the youngest cohort are statistically significant (p < .05) for all variables but Perceptual Speed, Attitudinal Flexibility, and Psychomotor Speed; for the middle-aged cohort, correlations are statistically significant (p < .05) for all variables except for Motor-Cognitive Flexibility. For the oldest cohort, however, correlations are statistically significant (p < .05) only for Inductive Reasoning, Word Fluency, Intellectual Ability, and Motor-Cognitive Flexibility. Correlations rise generally from the older to the youngest cohorts. However, the correlations drop across cohorts for Inductive Reasoning and Motor-Cognitive Flexibility and show a curvilinear pattern for Psychomotor Speed.
TABLE 15.6. Parent–Offspring Correlations as a Function of Cohort
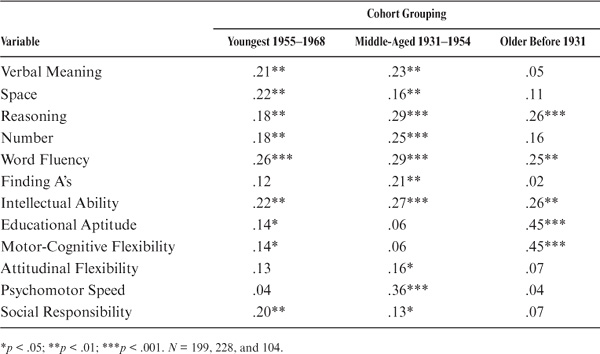
FIGURE 15.4. Parent–offspring correlations by cohort.
In sum, it does not appear that there are significant differences between the younger and the middle cohort, but there might well be lower relationships for the older cohort, albeit this last finding might be shaky because of the smaller size of the older group.
The effect of offspring age on family resemblance was tested directly in the total sample by regressing parent performance scores on the interaction of offspring age and offspring performance while controlling for the offspring performance and for the age main effects (hierarchical multiple regression; see Cohen & Cohen, 1975). Only two statistically significant interactions (p < .05) were found. They suggest that older offspring showed greater resemblance in Perceptual Speed and Motor-Cognitive Flexibility.
To permit comparison with previously determined population values, mean level scores were standardized to T-scores (M = 50; SD = 10). The average parent–offspring differences were then computed in T-score points (see table 15.7). Note first that there are statistically significant level differences (p < .001) for all variables. Raw differences are in favor of the offspring, except differences for Number and Social Responsibility, which favor the parents.
Because of average within-participant age changes, the raw differences must be adjusted before comparison is made with population cohort differences. This adjustment involves computing the average within-participant age changes found over the range of mean ages for our parents and offspring (using the relevant information provided in Schaie, 1983a). These values are found in the third column of table 15.7, with adjusted net differences in the fourth column. After age adjustment, differences are no longer statistically significant for Spatial Orientation, Word Fluency, the Index of Intellectual Ability, and Attitudinal Flexibility. The direction of differences in the remaining variables remains as before the age adjustment.
TABLE 15.7. Parent–Offspring Generational Differences in Performance Levela
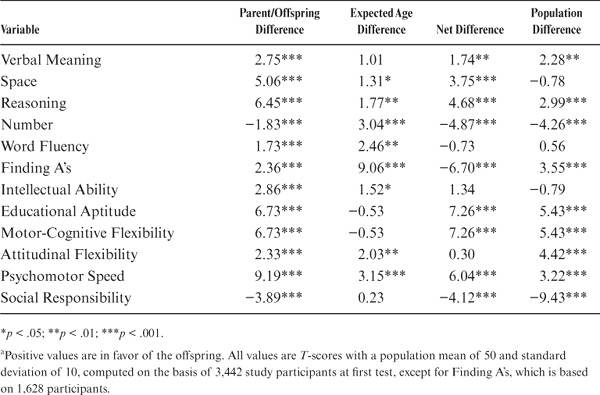
The fifth column of table 15.7 provides population cohort differences over the mean birth years represented by our parents and offspring (also obtained from Schaie, 1983a). Inspection of the fourth and fifth columns of table 15.7 (and figure 15.5) therefore allows comparison of population cohort difference estimates with those found for our “natural” cohort. The cohort difference estimates are quite comparable, except for four noteworthy exceptions:
1. Spatial Orientation provides a significant cohort difference in the present study, but not in the population for similar birth years.
2. Perceptual Speed in the natural cohort favors the offspring, but in the population estimate shows an advantage for older cohorts.
3. We find no significant difference in Attitudinal Flexibility in this study, but population values argue for an advantage for younger cohorts.
4. The Social Responsibility difference favoring the older cohort is less than half the value estimated for the population.
We finally address the question whether parent–offspring performance differences might be affected by cohort groupings. We report raw mean cohort differences in table 15.8 and figure 15.6. As would be expected because of the increase in age of the parents for the groups, differences here are least for the youngest cohort and greatest for the older cohort. Nevertheless, even in the youngest group, differences in favor of the offspring remain significant for Spatial Orientation, Inductive Reasoning, Number, Perceptual Speed, Motor-Cognitive Flexibility, and Psychomotor Speed; differences in Verbal Meaning, Number, and Social Responsibility favor the parents. For the middle group, all variables favor the offspring, except for Number (nonsignificant difference) and Social Responsibility (which favors the parents). For the older cohort, all differences, except Perceptual Speed and Social Responsibility, significantly favor the offspring.
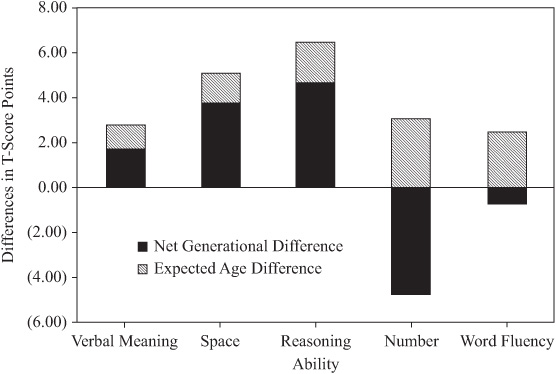
FIGURE 15.5. Generational differences between parents and offspring in T-score points.
TABLE 15.8. Performance Differences Between Parents and Offspring as a Function of Cohort Grouping
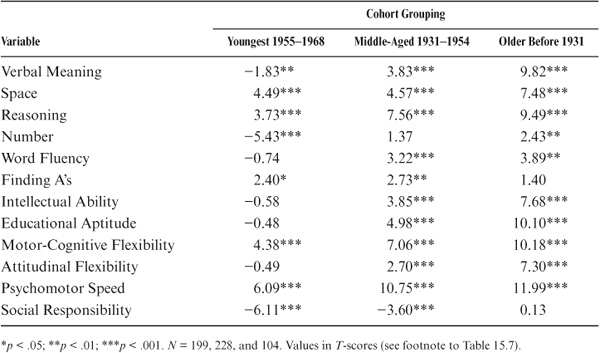
FIGURE 15.6 Generational differences between parents and offspring by cohort.
Significant family similarities were observed for our total sample for all ability measures except Perceptual Speed and the cognitive style measures. The magnitude of correlations for the ability measures are comparable to those found between young adults and their children (DeFries, Ashton, et al., 1976). Like the DeFries, Ashton, et al. study, we also found differences in resemblance across subsets. For example, same-gender pairs showed higher correlations on Verbal Meaning, Number, and Word Fluency, but opposite-gender pairs showed it on Spatial Orientation, Inductive Reasoning, and Motor-Cognitive Flexibility. Greater similarity was also found between mother–offspring pairs than between father–offspring pairs on Inductive Reasoning and Psychomotor Speed. Moreover, higher parent–offspring correlations were found for daughters than for sons, suggesting at least the possibility that females may experience greater shared environmental influences than males. Our first hypothesis also argued for the possible effect of early shared environment on offspring performance on Verbal Meaning and Word Fluency. After age adjustment, these were indeed the abilities that showed the greatest parent–offspring similarity.
If shared environmental influences are relatively unimportant in adulthood, then similarity within parent–offspring pairs should remain reasonably constant in adulthood across time and age. Our data strongly support this proposition for all variables that displayed significant parent–offspring correlations. Indeed, parent–offspring correlations measured at approximately the same age of parent and offspring and when those ages were 20 years apart had similar magnitudes.
It has been argued that family similarity should decrease with age because of the increasing amount of nonnormative, nonshared environment expected as adult life progresses. Counterintuitively, no such decrease in similarity could be observed. Indeed, for two variables, there was evidence for increasing similarity as a function of offspring age. This finding makes good sense for our Perceptual Speed variable. Most of our younger offspring typically have not yet experienced age-related decline on this variable, whereas some of their parents have. Both older offspring and parents may have experienced sufficient decline so that again their observed similarity is increased. The other variable showing an age effect was Motor-Cognitive Flexibility. In this instance, our cross-sectional data may confound substantial cohort effects that could have spuriously inflated the offspring age effect.
Further evidence supporting the absence of shared environmental effects on family similarity is provided by our analyses of the intensity of current parent–offspring contact. All of the few, observed, significant, but very modest, effects of contact on parent–offspring resemblance in performance (for Verbal Meaning, Spatial Orientation, Number, and Attitudinal Flexibility) were in a negative direction.
We had suspected that cohort effects in parent–offspring correlations would result in higher correlations for earlier cohorts because of a decline in shared environmental influence attributed to an increase in extrafamilial influences in more recent cohorts. This proposition could be supported only for the attitudinal trait of Social Responsibility (systematic cohort differences on this variable have previously been reported; see Schaie & Parham, 1974). For the cognitive abilities, again counterintuitively, there seems to be stability or even an increase in family similarity for more recent cohorts. As in the population estimates (Schaie, 1990b) and in other studies (see Sundet, Tambs, Magnus, & Berg, 1988), nonlinear cohort trends were also observed. One plausible explanation for the increase in family similarity in successive cohorts might be the decrease of intrafamilial differences in level of education from our oldest cohort grouping to our youngest.
Finally, we asked whether level differences within families equaled or approximated differences found for similar cohort ranges within a general population sample (see Schaie, 1990b; Willis, 1989a). Comparable differences were the rule, but there were some noteworthy exceptions. Thus, the population estimates underestimated the advantage of the offspring cohort for Spatial Orientation and Psychomotor Speed but overestimated that advantage for Perceptual Speed. On the attitudinal trait of Social Responsibility, however, the estimated cohort difference in favor of the parent cohort was far greater in the population than that observed in the natural cohort. When broken down by cohort groupings, it became clear that cohort differences became generally smaller for the more recently born parent–offspring pairs, with the exception of increasing differences in favor of the parent generation for Number and Social Responsibility.
An important policy-relevant aspect of our generational studies is the possibility of asking whether the rate of aging has changed across successive generations. Recent policy debates in the United States and Europe, for example, have been concerned with the question whether Social Security and other pension systems will remain viable when the baby boomers reach retirement ages. Some have argued that the easiest fix for this problem would be to raise the age at which pensions are now paid (cf. Crystal & Shea, 2002). However, such a fix depends on the assumption that the next generation is able to work to later ages because the rate of aging has slowed, that is, whether the next generation will decline physically and mentally more slowly than did their parents (Schaie & Willis, 2000a). The most direct test of whether the rate of cognitive aging has slowed is provided by the comparison of persons with their biologically related adult offspring at approximately the same ages. We assembled two data sets that meet this condition, one over a 7-year period, and another over 14 years.
The first data set contains 496 participants (248 parent–offspring dyads; 89 sons and 159 daughters). To obtain approximate age equivalence, we compared the 1970 and 1977 test scores of the parents with the 1989 and 1996 test scores of the adult offspring.
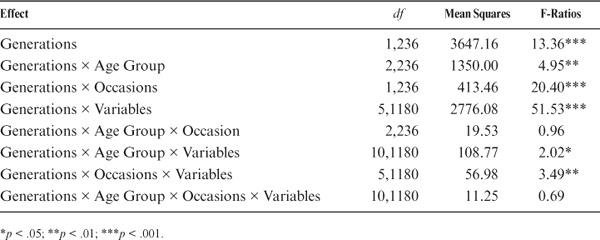
To examine whether the generational differences vary by age level, we further subdivided the data sets into three groups by average age of each dyadic pair as follows: up to 44 years of age (n = 62; M = 40.4, range 31–44); 45 to 59 years of age (n = 128; M = 51.8, range 45–59); and 60 years or older (n = 58; M = 65.5, range 60–82). We then conducted a repeated measurement analysis of variance with 3 Age Levels × 2 Generations × 2 Occasions × 6 Test Variables (Verbal Meaning, Spatial Orientation, Reasoning, Number, Word Fluency, and Psychomotor Speed) and controlled for the gender of parent and offspring by removing variance associated with their main effect and their interaction with the other variables of interest. Individuals are treated as replicates within parent–offspring dyads. Post hoc tests of interaction effects used the most conservative Tukey’s HSD (honestly significant difference) procedure. Table 15.9 lists the analysis of variance results for all of the effects involving generational differences.
Despite the multidirectional nature of the generation effects (Schaie, 1996b; Schaie, Plomin, et al., 1992; Willis, 1989a), the main effect for generation is highly significant. That is, there is an overall gain in level of performance from the parent to the offspring generation. Moreover, there is a significant interaction between age group and generation [F (df = 2236) = 4.95, p < .01]. That is, a significant overall generational difference is found only at the oldest age level (60 years or older). We next examine the significant overall interaction of generation by variable [F (df = 5, 1180) = 51.83, p < .001]. Significant effects in favor of the younger generation are found for Spatial Orientation, Reasoning, and Psychomotor Speed and in favor of the older generation for Number.
For testing hypotheses about generational differences in rate of change, our primary concern is with the interactions involving generational differences and change over time. The overall interaction between generations and occasion (the rate of change) is highly significant [F (df = 1236) = 20.27, p < .001]. There is a significant overall decline over 7 years in the older, but not in the younger, generation [F (2.236) = 20.40, p < .001]. The overall 7-year rate of change also differs across age groups and variable [F (df = 5, 1180) = 3.49, p < .01]. This interaction reflects primarily the greater decline in number for the older generation.
TABLE 15.9. ANOVA Effects for Generational Differences in Rate of Cognitive Change
It is instructive also to examine the change patterns by generation for each variable, as shown by figure 15.7. The interaction between rate of change and level of performance may be critical for the prediction of practical consequences of these changes. It is noteworthy that performance levels for the parent generation are tightly clustered. By contrast, levels of performance for the offspring generation are quite dispersed, with highest performance levels on Inductive Reasoning and lowest on the Number ability.
Information is presented also on differences in within-generation change patterns separately for the oldest group in figure 15.8 because generational differences are most profound at ages above 60 years. Note particularly that there are average decremental changes for this age group in the parent generation for all six variables. For the offspring generation, however, there is gain for Verbal Meaning and Psychomotor Speed and virtual stability for Reasoning and Space, and decline is found only for the Number and Word Fluency abilities.
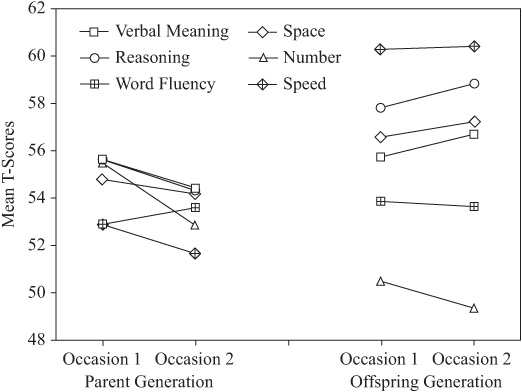
FIGURE 15.7. Generational differences in change over 7 years.
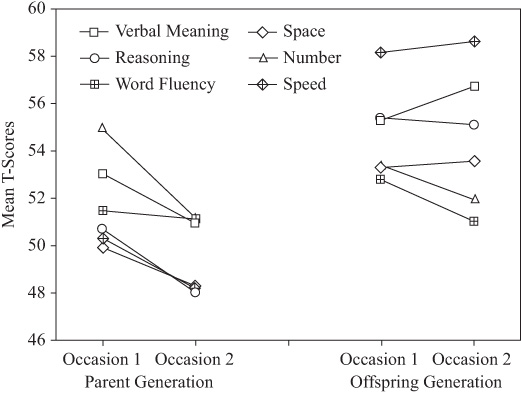
FIGURE 15.8. Generation differences in change over 7 years for older individuals.
The second data set contains 834 participants (417 parent–offspring dyads; 164 sons and 253 daughters). To obtain approximate age equivalence, we compared the 1970, 1977, and 1984 test scores of the parents with the 1989, 1996, and 2003 test scores of the adult offspring.
We then conducted a repeated measurement analysis of variance with 3 Age Levels × 2 Generations × 3 Occasions × 6 Test Variables (Verbal Meaning, Spatial Orientation, Reasoning, Number, Word Fluency, and Psychomotor Speed) and controlled for the gender of parent and offspring by removing variance associated with their main effect and their interaction with the other variables of interest. Individuals are treated as replicates within parent–offspring dyads. Post hoc tests of interaction effects used the most conservative Tukey’s HSD (honestly significant difference) procedure. Table 15.10 lists the analysis of variance results for all of the effects involving generational differences.
The main effect for generation when examined over a 14-year time span is again highly significant. That is, there is an overall gain in level of performance from the parent to the offspring generation. We next examined the significant overall interaction of generation by variable [F (df = 5, 840) = 21.91, p < .001]. Significant effects in favor of the younger generation are found for Verbal Meaning, Spatial Orientation, Reasoning, Word Fluency, and Psychomotor Speed and in favor of the older generation for Number.
TABLE 15.10. ANOVA Effects for Generational Differences in Rate of Cognitive Change Over 14 Years
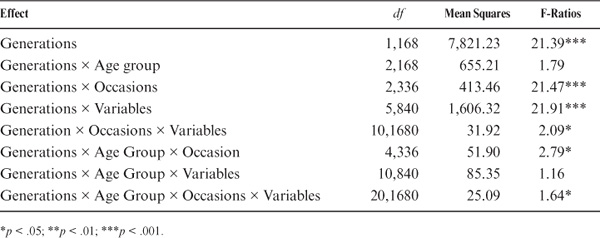
For testing hypotheses about generational differences in rate of change, our primary concern is with the interactions involving generational differences and change over time. The overall interaction between generations and occasion (the rate of change) is highly significant [F (df = 2236) = 21.47, p < .001]. There is a significant overall decline over 14 years in the older, but not in the younger, generation [F (4.336) = 2.79, p < .05]. The overall 14-year rate of change also differs across age groups and variables [F (df = 20, 1680) = 1.64, p < .05]. This interaction reflects primarily the greater decline in number for the older generation.
It is instructive also to examine the change patterns by generation for each variable, as shown by figure 15.9. The interaction between rate of change and level of performance may be critical for the prediction of practical consequences of these changes. It is noteworthy that performance levels for the parent generation are tightly clustered. By contrast, levels of performance for the offspring generation are quite dispersed, with highest performance levels on Inductive Reasoning and lowest on the Number ability.
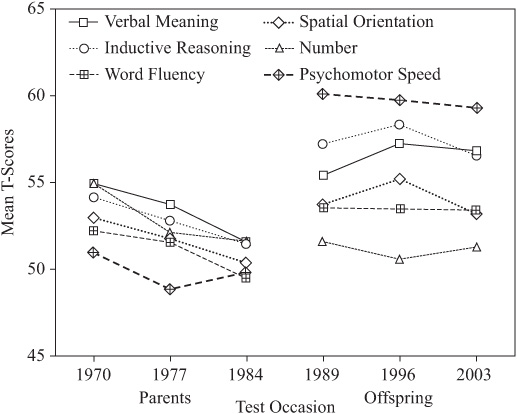
FIGURE 15.9. Generational differences in change over 14 years.
As part of the family study described here, we identified a total of 1,799 siblings, including 779 brothers and 1,020 sisters of our panel members. In 1989, we were able to assess a total of 304 siblings, resulting in 45 brother–brother pairs, 102 sister–sister pairs, and 157 brother–sister pairs. The siblings ranged in age from 22 to 89 years (M = 58.26; SD = 14.56). Target siblings ranged in age from 24 to 89 years when tested in 1984 (M = 53.26; SD = 13.95). All study participants were community-dwelling individuals when tested (see Schaie et al., 1993).
In 1996, we were able to recruit a second sample of 412 siblings, resulting in 73 brother–brother pairs, 151 sister–sister pairs, and 188 brother–sister pairs. The siblings ranged in age from 22 to 90 years (M = 59.03; SD = 14.15). Target siblings ranged in age from 29 to 93 years when tested in 1984 (M = 62.42; SD = 13.81).
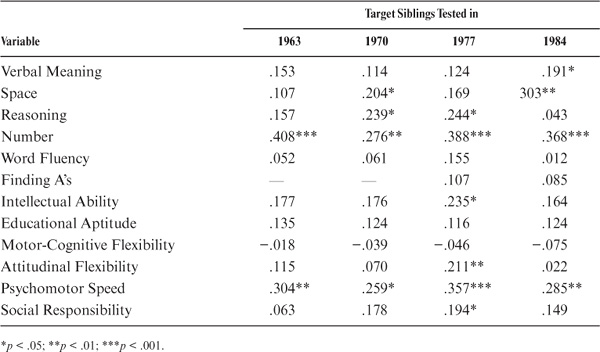
In the case of the siblings, the performance of the target sibling is regressed on the index case (the sibling assessed in 1990). The raw correlations are shown in the first column of table 15.11. Sibling correlations are statistically significant (p < .01) for all variables studied except for Perceptual Speed and the trait measure of Social Responsibility. Among the ability measures, correlations are highest for Inductive Reasoning and Verbal Meaning, as well as for the composite measures. They are lowest for the measures of Perceptual Speed (the Finding A’s test), Space, and Word Fluency. Among the cognitive style measures, correlations are highest for Motor-Cognitive Flexibility and lowest for Attitudinal Flexibility.
Again, adjustment is needed for the age of siblings to meet assumptions for heritability estimates. The standardized regression coefficients adjusted for the age of both siblings can be found in the second column of table 15.11. Subsequent to the age adjustment, all but the measures of Perceptual Speed and Social Responsibility remain statistically significant (p < .05). However, the magnitudes of the correlations change somewhat, with Verbal Meaning and Number now displaying the highest ability correlations. Correlations for the cognitive style measures are reduced and are now of about equal magnitude.
Regression coefficients adjusted for age of both siblings were also computed between the index sibling and the performance of the target sibling in 1963, 1970, 1977, and 1984. Because of the relatively small number of pairs for which all four data points were available (N = 72), the demonstration of stability is not quite as good as for the parent–offspring pairs. Relevant data are provided in table 15.12. There is strong evidence for the stability of sibling concordance for Number and Psychomotor Speed. Stable trends seem to prevail as well for Space, Reasoning, and the composite indices.
TABLE 15.11. Sibling Correlations
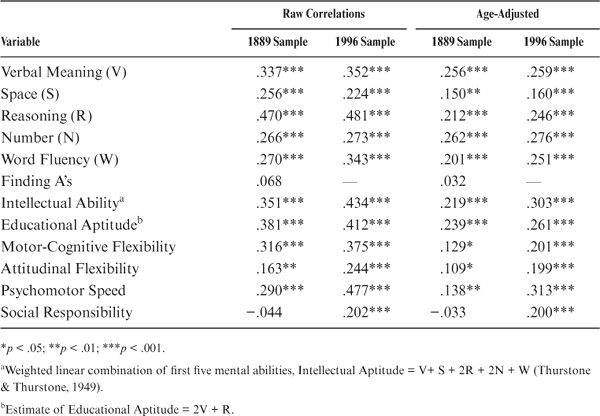
TABLE 15.12. Sibling Correlations as a Function of Time Adjusted for Age of Both Siblings
Just as for parent–offspring pairs, substantial adult family similarity can be documented for the sibling pairs. The two exceptions to this finding are the attitudinal trait of Social Responsibility and the measure of Perceptual Speed, neither of which seems to display heritable characteristics. In general, parent–offspring and sibling correlations are of similar magnitude. However, after controlling for age, sibling correlations are somewhat lower than those observed for the parent–offspring pairs. Stability data for the siblings can be strongly confirmed only for the variables of Number and Psychomotor Speed. Trends comparable to those observed for the parent–offspring pairs for other variables probably failed to reach significance because of the limited power of the longitudinal sibling sample.
Married couples were studied for as long as 21 years. They showed significant initial within-couple correlations on Verbal Meaning, Inductive Reasoning, and Word Fluency, the Index of Educational Aptitude, and Social Responsibility, even when controlling for age and education. Spousal similarity increased by length of marriage on Verbal Meaning, the Index of Intellectual Ability, and Attitudinal Flexibility. Several reciprocal cross-lag effects were found over time, with husbands influencing wives on Inductive Reasoning and wives influencing husbands on Verbal Meaning. The higher-functioning spouse influenced positively the performance level of the lower-functioning spouse over time on Word Fluency and Motor-Cognitive Flexibility.
A recent secondary analysis of the longitudinal couples data over 35 years addressed the question of the spousal interrelation of the development of happiness in midlife and old age. Latent growth curve models revealed sizable spousal similarities not only in levels of happiness, but also in how happiness changed over time. These spousal interrelations were considerably larger in size than those found among random pairs of women and men from the same sample. Results are in line with life span theories emphasizing an interactive minds perspective by showing that adult happiness waxes and wanes in close association with the respective spouse. Our findings also complement previous individual-level work on age-related changes in well-being by pointing to the importance of using the couple as the unit of analysis
Studies of families involved adult parents and their adult offspring as well as adult siblings. Significant correlations (averaging about .30) were found for all mental abilities (except for Perceptual Speed) for parent–offspring pairs, with somewhat lower correlations for the siblings. The within-family correlations were of a magnitude similar to those found in parent–offspring studies at younger ages. Some significant differences were found in the magnitude of correlations between same-sex and opposite-sex parent–offspring pairs, and higher parent–offspring correlations were found for daughters than for sons. The stability of parent–offspring correlations remained high over 7, 14, and 21 years and was not affected by the degree of family contact. Significant within-family cohort ability differences were found in favor of the offspring generation, but generational differences became smaller for more recently born parent–offspring pairs.