Research on intellectual aging has usually focused on the objective assessment of study participants’ performance. However, there is also some recent interest in the examination of participants’ subjective appraisal of their cognitive performance. Subjective assessments of perceived competence are thought to play an important role in the process of intellectual aging. Some studies have linked personal expectations of performance on tests or in real-life situations to actual performance on cognitive tasks (see Lachman, 1983; Schaie, Willis, & O’Hanlon, 1994; Willis & Schaie, 1986a). Several studies examining concurrent relationships between intellectual self-efficacy and ability performance have reported that both young and elderly adults are fairly accurate in estimating their intellectual performance (Lachman & Jelalian, 1984; Lachman, Lachman, & Thronesbery, 1979; Perlmutter, 1978). Both age groups, moreover, have been found to make more accurate predictions for tests on which they exhibit higher levels of performance (Lachman & Jelalian, 1984).
The relationship between perceived and actual performance may also be complicated by age and gender differences. Researchers have differed on the question of whether older adults over- or underestimate their performance on abilities on which they perform poorly. There has been some speculation (e.g., Bandura, 1981, 1982) that the elderly underestimate their performance. However, findings from other studies (Lachman & Jelalian, 1984) indicate that the elderly consistently overestimate their performance on measures of fluid abilities. Furthermore, researchers examining concurrent relationships between self-efficacy and ability performance often interpret their findings to suggest that age differences in self-efficacy are ability specific. Hence, these studies imply that the elderly do not subscribe to global negative perceptions of their intellectual competence.
Most previous studies have focused on the concurrent relationships between perceived competence and its objective measurement (Cornelius & Caspi, 1986; Lachman & Jelalian, 1984; Lachman, Steinberg, & Trotter, 1987). By contrast, in the Seattle Longitudinal Study (SLS) we asked our study participants to compare their 1984 performance on five mental abilities with their performance 7 years earlier (Schaie et al., 1994). Parts of this study were replicated in a master’s thesis by Roth (2001), who studied congruence types for those of our 1991 study participants who rated their performance 7 years earlier. For those who had been in the study on three occasions, Roth also investigated the stability of congruence types over 14 years. More recently we have expanded these analyses to include individuals who rated perceived change in their performance from 1998 to 2005.
In a separate study, we have also assessed participants’ perception of short-term improvement as a function of participating in cognitive training activities.
Participants were asked to rate whether they thought that their current performance was better, the same, or worse; their responses are referred to as perceiver types. Participants were then categorized in a typology based on the congruence between their perceived and actual performance change over time. Three congruence types were identified: realists, optimists, and pessimists.
The questions to be asked were as follows:
1. Are there age and gender differences in perceiver types (better, the same, worse)?
2. Do participants’ current levels of ability performance differ by perceiver type?
3. How accurately can participants evaluate change in their performance on the five cognitive abilities (congruence between reported perception and actual performance)?
4. Do participants predict with the same accuracy for all abilities?
5. Are there age and gender differences in congruence types (realists, optimists, pessimists)?
6. Does current level of ability performance differ by congruence type?
7. Does the magnitude of the actual ability change (1977 to 1984) differ by congruence type?
The first subsample selected for this particular study was those individuals who were tested in 1977 and who returned for the next assessment in 1984. This criterion resulted in a sample of 837 participants (383 men and 454 women) with a mean age in 1984 of 68.36 years (SD = 13.34, range 29–96). To examine possible age differences among perceivers and congruence types, the sample was divided into three subsets by age in 1984: younger (29 to 49 years: M = 41.76, SD = 5.20), middle-aged (50 to 70 years, M = 60.63, SD = 5.73), and older adults (71 to 95 years, M = 77.24, SD = 5.74).
The second subsample includes those individuals who were tested in 1998 and who returned for their next assessment in 2005. This criterion resulted in a sample of 1,207 participants (542 men and 664 women with a mean age in 2005 of 65.86 years (SD = 14.68, range 32–102). Again, to examine possible age differences among perceivers and congruence types, the sample was divided into three subsets by age in 2005: younger (29 to 49 years: M = 46.00, SD = 4.77), middle-aged (50 to 70 years, M = 60.13, SD = 5.73), and older adults (71 to 102 years; M = 80.36, SD = 6.22.).
After completing the five Primary Mental Abilities (PMA) tests (Verbal Meaning [V], Spatial Orientation [S], Inductive Reasoning [R], Number [N], Word Fluency [W]), study participants answered the PMA Retrospective Questionnaire. This questionnaire reminded the participants that they had taken the same five ability tests several years earlier and asked them to reflect on how their performance on the tests just completed (in 1984) compared with their earlier performance (in 1977). In the second sample, the comparison was between the performances in 2005 compared with the earlier performance in 1998. Participants evaluated their relative performance for each of the five abilities using a 5-point scale with the categories (1) much better today, (2) better today, (3) about the same, (4) worse today, (5) much worse today. Because of the small number of persons who chose the extreme categories (1 or 5), these categories were collapsed into a 3-point scale, resulting in three perceiver types: better, same, and worse.
Study participants were classified according to how their actual PMA performance had changed between the two test occasions on each of the five abilities. Difference scores between the 1977 and 1984 (or the 1998 and 2005) performance were computed, and participants were classified into groups showing reliably higher, similar, or lower performance for every ability. The classification criteria for a positive or negative change were that the participant in 1984 performed at least 1 SEM below or above his or her 1977 performance (see Dudek, 1979; Schaie, 1989c).
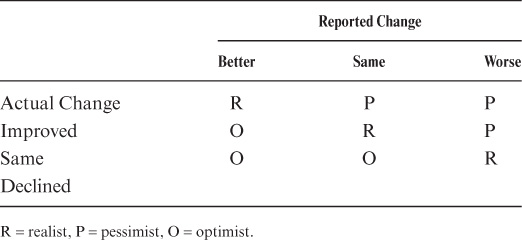
Cross-tabulations between actual performance change and perceived performance change were next examined. Based on the patterns in these tables, the sample was then categorized into three congruence types for each ability: pessimists, individuals who perceived greater negative change or less improvement in performance relative to their actual change (1977 to 1984); realists, those individuals who accurately predicted change or stability; and optimists, those who perceived greater positive change or stability than indicated by their actual performance (see table 16.1).
The proportion of participants who reported that their performance had improved over time (from 1977 to 1984) ranged from 13.3% for Spatial Orientation to 22.3% for Inductive Reasoning. Those who reported that their performance had remained the same ranged from 47.3% for Spatial Orientation to 71.5% for Verbal Meaning. Those who reported that they had performed worse than on the previous test occasion ranged from 8.4% for Verbal Meaning to 39.4% for Spatial Orientation.
TABLE 16.1. Schema for Classification Into Congruence Types

Similar data for comparing performance over the time range from 1998 to 2005 indicated that reported performance had improved, ranging from 8.8% for Verbal Meaning and Spatial Orientation to 22.1% for Word Fluency. Those who reported that their performance had remained the same ranged from 48.9% for Number to 55.3% for Word Fluency. And those who reported that they had performed worse ranged from 12.1% for Inductive Reasoning to 41.4% for Verbal Meaning and Spatial Orientation.
For the total sample, in 1984 there was a significant relationship between age and perceiver type for four of the five abilities. On both Verbal Meaning and Inductive Reasoning, more young participants than old reported that they had become better, whereas more old participants than young reported having become worse; the middle-aged were in between [χ2(V)(4, N = 818) = 58.35, p < .001; χ2(R)(4, N = 818) = 45.18, p < .001]. On Spatial Orientation, young participants reported more improvement than did both the old and the middle-aged, and the old reported more decline than did either the young or middle-aged [χ2(4, N = 818) = 13.61, p < .01]. However, on Number, the age relationship was reversed, with more older individuals reporting that they remained stable or improved and more younger persons reporting that they got worse, with the middle-aged in between [χ2(4, N = 819) = 27.51, p < .001]. The relationship between age and perceiver type was similar across genders except for a Gender by Perceiver Type interaction for Spatial Orientation [χ2(2, N = 818) = 21.05, p < .001]. On that ability, the proportion of men and women who reported having become better did not differ, but more men than women reported having remained the same, and more women than men reported having gotten worse.
Similar results were found in 2005.There again was a significant relationship between age and perceiver type for four of the five abilities. On both Verbal Meaning and Inductive Reasoning, more young participants than old reported that they had become better, while more old participants than young reported having become worse; the middle-aged were in between [χ2(V)(4, N = 1195) = 69.10, p < .001; χ2(R)(4, N = 1191) = 50.28, p < .001]. On Spatial Orientation, young participants reported more improvement than did both the old and the middle-aged, and the old reported more decline than did either the young or middle-aged [χ2(4, N = 1185) = 29.82, p < .001]. On Number, the age relationship was reversed, with more older individuals reporting that they remained stable or improved and more younger persons reporting that they got worse, with the middle-aged in between [χ2(4, N = 1191) = 41.63, p < .001]. The relationship between age and perceiver type remained similar across genders except that the Gender by Perceiver Type interaction for Spatial Orientation found in the earlier analysis was not replicated.
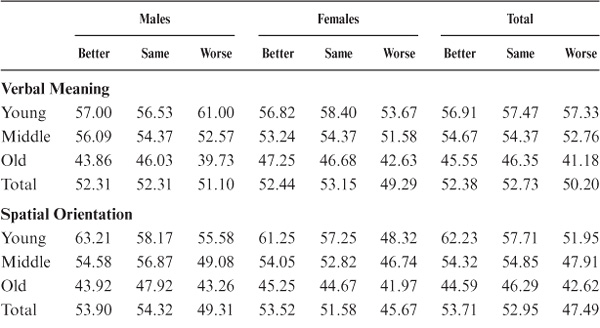
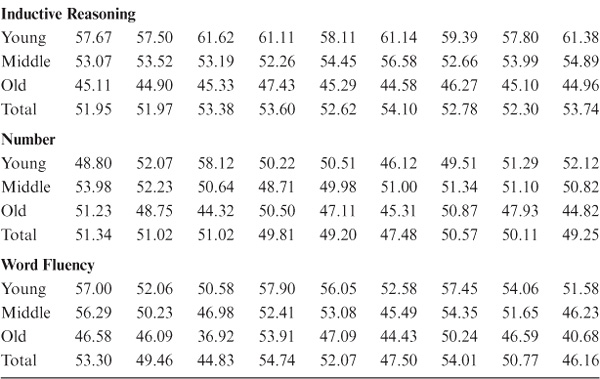
Differences were examined for participants who had reported that they remained stable, improved, or declined regardless of the accuracy of their report. A 3 (perceiver type) × 2 (age group) × 2 (gender) analysis of variance (ANOVA) was run separately for each ability (see table 16.2 for the associated means). Significant type differences were found for Spatial Orientation [F (df = 2, 813) = 37.33, p < .001] and for Word Fluency [F (df = 2, 811) = 31.49, p < .001]. In both instances, PMA scores were highest for individuals who had reported positive change, in between for those reporting no change, and lowest for those reporting negative change.
Significant Perceiver Type × Age interactions were also found for Spatial Orientation [F (df = 2, 813) = 3.53, p < .01] and Number [F (df = 2, 811) = 2.23, p < .05]. The Type × Age interaction for Spatial Orientation indicated that, although there was virtually no performance difference among the three types for the old group, in the young group those who perceived themselves to have improved indeed performed much better than those who perceived themselves to have declined. The Type × Age interaction for Number conversely indicated that, whereas there was little difference in performance among the types for either the young or the middle-aged, older adults who perceived themselves to have declined performed at a lower level than did those who perceived themselves to have improved. Significant triple interactions, moreover, were found for Number [F (df = 4, 811) = 2.75, p < .05] and Word Fluency [F (df = 4, 811) = 3.98, p < .01]. The triple interaction on Number reflects the fact that, whereas both older adult males and females who perceived themselves to have declined performed at lower levels than those who perceived themselves to have improved, young males showed the opposite pattern; young males who perceived themselves to have declined actually had higher mean scores than those who perceived themselves to have improved or remained stable. The triple interaction on Word Fluency reflects the finding that men who perceived themselves to have improved or declined showed greater age differences in performance than women; however, the Age × Gender difference in performance was not found for those who perceived themselves as remaining stable.
For the 2005 sample, the main effects for type were replicated for Spatial Orientation, Inductive Reasoning, Number, and Word Fluency. However, none of the interactions with age or gender could be replicated.
TABLE 16.2. Mean T-Scores for Current Performance Levels in 1984 by Perceiver Type by Ability, Age Group, and Gender
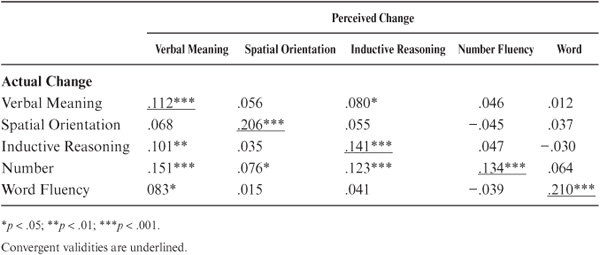
Although the correlations between perceived and actual change for the same ability (convergent validity) were statistically significant (p < .001) and for the most part were larger than cross-ability correlations (divergent validity), they were quite small (see table 16.3). Indeed, significantly larger correlations were found among ratings of perceived change across abilities, suggesting that the ratings of perceived change are associated with global perceptions of change in intellectual functioning in addition to the actual observed change on the target ability. Similar findings occurred for the 2005 sample.
Given the categorical nature of the judgment of perceived change, the correlations do not necessarily give a good picture of the accuracy of the respondents’ perceptions. We therefore proceeded next with analyses of the congruence types.
TABLE 16.3. Correlations Between Perceived and Actual Change
Proportions of each congruence type by ability are shown in figure 16.1a. (1984) and figure 16.1b (2005). Assuming that the expected chance probability of assignment to one of the three response congruence types was .33, chi-square analyses determined that assignment to type differed significantly from chance at or above the 5% level of confidence. Approximately half the participants were realistic in their perception of change or stability over the 7-year period. Participants were most accurate (realistic) in estimating stability or change on the Verbal Meaning test. The highest proportion of pessimists (overestimation of decline) occurred for Spatial Orientation (34%), and pessimists were the fewest for Verbal Meaning (10.3%). Approximately 30% of the sample was optimistic (underestimation of decline) about their performance change for all abilities except Spatial Orientation.
In the 2005 sample, the highest proportion of pessimists again occurred for Spatial Orientation (40.4%) and the lowest proportion for Verbal Meaning (14.3%). Optimists ranged from 14.3% for Spatial Orientation to 36.3% for Verbal Meaning.
Consistency in congruence types across the five PMA tests was examined, but no consistent pattern was evident. Some study participants who were categorized as being pessimistic for one ability were quite likely to be realistic on another and possibly optimistic on a third. There are 120 possible permutations of congruence types across all five abilities, and virtually every possible permutation occurred. The most frequent permutation (N = 30) was the pattern of realism across all five abilities.
Gender differences in the distribution of congruence types were found for only one ability, Spatial Orientation. Here, a greater proportion of women were pessimistic about change in their spatial ability than men [χ2(2, N = 818) = 6.4, p < .05].
Regarding age, a greater proportion of the oldest group of participants were more pessimistic than the young and middle-aged about change in their Verbal ability [χ2(2, N = 818) = 19.1, p < .01] and Inductive Reasoning ability [χ2(2, N = 818) = 13.8, p < .05]. However, a greater proportion of the oldest group were realistic in the assessment of performance change on the Number test [χ2(2, N = 753) = 26.02, p < .001].
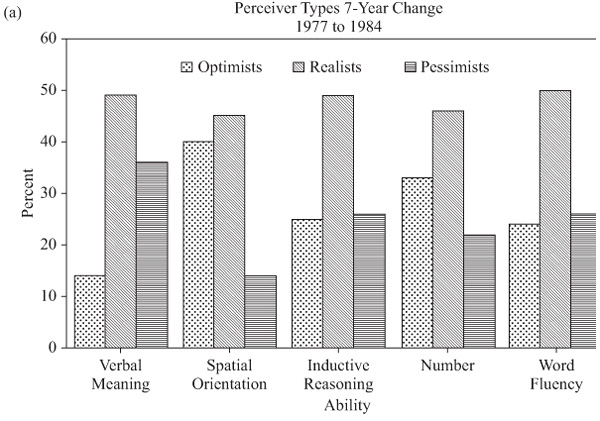
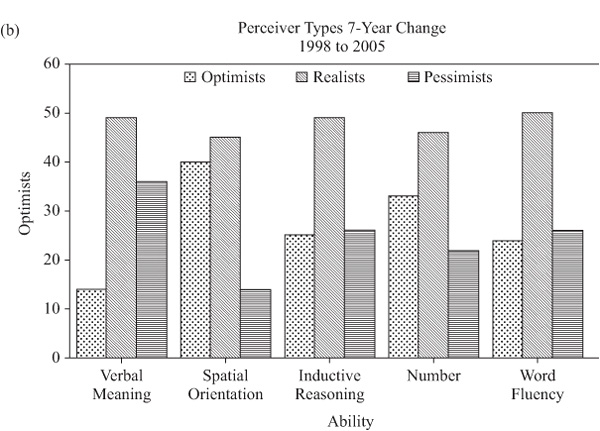
FIGURE 16.1. Proportions of congruence types by ability.
Differences among congruence types in the 1984 PMA scores were also examined by means of 3 (congruence type) × 3 (age group) × 2 (gender) ANOVAs conducted separately for each of the five abilities (see table 16.4 for associated means). Significant differences by type were found for Verbal Meaning [F (df = 2, 798) = 11.36, p < .001] and for Inductive Reasoning [F (2, 795) = 3.76, p < .02]. Both realists and pessimists had significantly higher 1984 Verbal Meaning scores than optimists. Realists’ 1984 Inductive Reasoning scores were significantly higher than those of pessimists.
TABLE 16.4. Mean T-Scores for Current Performance Levels by Congruence Type, Age Group, and Gender
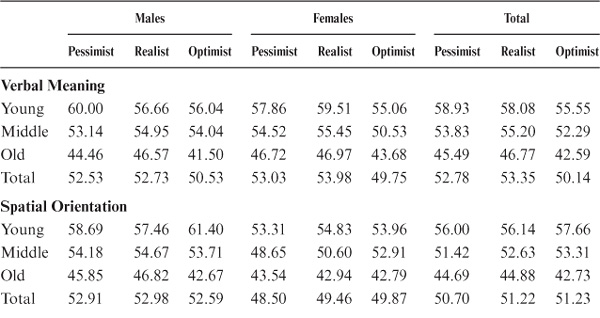
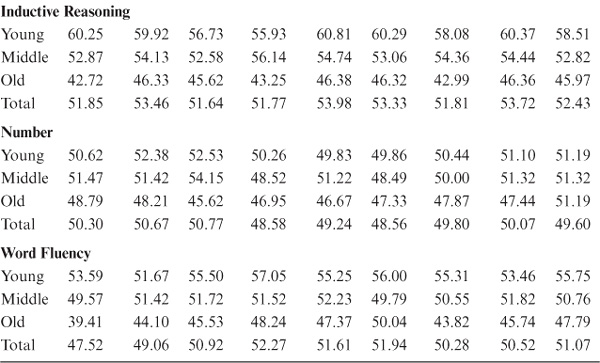
Significant age main effects occurred for all variables. Gender main effects favored men for Spatial Orientation and Number but favored women for Word Fluency. The only significant Age × Gender interaction occurred for Word Fluency, reflecting greater age differences for women between the younger and middle-aged groups and for men between the middle-aged and old groups.
Differences among congruence types in magnitude of ability change (1977 to 1984) were examined via 3 (congruence type) × 3 (age group) × 2 (gender) ANOVAs conducted separately for each ability (see table 16.5 for the associated mean changes). Significant type differences were found for all abilities: Verbal Meaning [F (df = 2, 798) = 105.59, p < .001], Spatial Orientation [F (df = 2, 798) = 53.47, p < .001], Inductive Reasoning [F (df = 2, 795) = 60.83, p < .001], Number [F (df = 2, 801) = 53.28, p < .001], and Word Fluency [F (df = 2, 796) = 47.40, p < .001]. For all abilities, each type differed significantly from the others in magnitude of change. As would be expected from the type definitions, the optimists experienced greater average decline (respectively less gain) than either realists or pessimists, and the pessimists experienced objectively the least decline. The difference between pessimists and optimists exceeded 1 SD for all abilities and was greatest for Verbal Meaning.
TABLE 16.5. Mean T-Scores for Magnitude of Change from 1977 to 1984 by Congruence Type, Ability, Age Group, and Gender
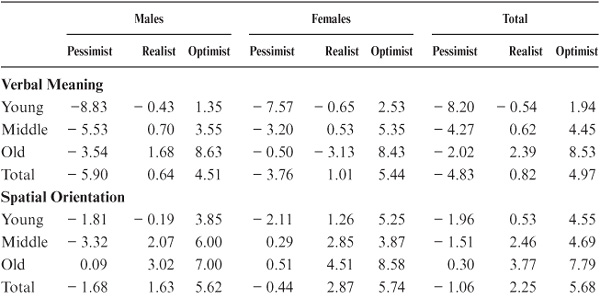
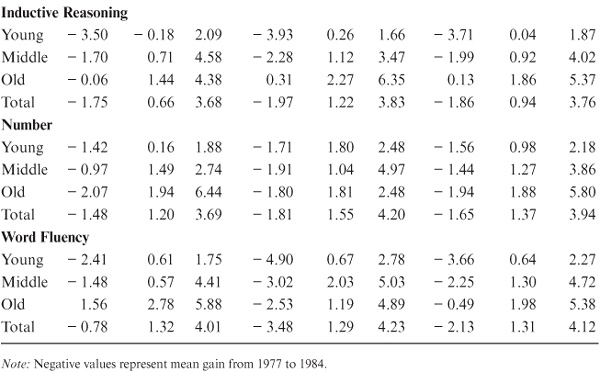
A Congruence Type × Age interaction was found for Verbal Meaning [F (df = 2, 798) = 3.18, p < .001]. The young pessimists gained significantly more over time than did the middle-aged or old pessimists. Likewise, the old optimists declined significantly more than did their young and middle-aged counterparts. Also, the young realists gained significantly more over time than did the middle-aged and old realists. A significant Congruence Type × Gender interaction occurred for Word Fluency [F (df = 2, 796) = 3.01, p < .05]. This interaction reflected significantly greater gain over time for the female than the male pessimists. Finally, a significant triple interaction was obtained for Spatial Orientation [F (df = 4, 798) = 2.62, p < .05]. This interaction reflects significant gain over time for the male pessimists, but stability for the female pessimists.
We assumed in this study that community-dwelling adults are capable of making appropriate judgments of change in performance on cognitive tests taken 7 years apart. It could be argued that what the participants actually do is more likely to be a projection of their feelings about change in their cognitive competence, with the current test providing no more than a projective stimulus for the expression of such feelings. However, the data suggest that much more systematic judgments are made.
Perceptions of age-related change in ability functioning were examined for three age groups (young, middle-aged, and older adults). Furthermore, a typology was proposed for examining the congruence between perceptions of change and actual age-related change in intellectual functioning. The typology categorized three congruence types: realists, those who correctly estimated change or stability; pessimists, those who thought they had declined more than they actually had; and optimists, those who thought they did better than the objective data reflected. We were able to verify this typology by showing that the three groups differed significantly in absolute magnitude of change in the expected direction on all five abilities; that is, pessimists declined the least or gained, optimists declined the most, and realists were in between.
With respect to participants’ perception of change in ability functioning (regardless of the accuracy of perceptions), we found that a greater proportion of older adults than young or middle-aged adults perceived themselves to have declined on three of the abilities studied (Verbal Meaning, Reasoning, Spatial Orientation). For Number ability, by contrast, a significantly smaller proportion (18%) of older adults perceived themselves to have declined than young adults (38%). No Age × Perceiver Type interaction was found for Word Fluency.
There are two possible implications of these findings. Prior research findings (Lachman & Jelalian, 1984) were supported in that age differences in perceptions turned out to be ability specific; the old did not hold global perceptions of universal decline across all abilities. Second, the findings suggest a possible cohort effect in ability perceptions. Given our finding on the multidirectionality of cohort differences in Number ability (see chapter 6), it is interesting to note that the older group in the perceptions study represents those cohorts whose Number ability was particularly high compared with more recent cohorts, which may contribute to the age differences in perception of decline on Number ability found in the study.
When perceptions of cognitive change over 7 years were compared with objectively measured change (congruence typology), we found that approximately half our sample could accurately categorize their performance change over time, albeit that the correct attribution in most instances turned out to be their judgment that no change had occurred. Participants were not only aware of their concurrent levels of performance, but they could make reasonably accurate estimates of change in performance over a 7-year period. However, study participants did not predict change in their performance with equal accuracy across all the abilities measured.
The variables of age and gender were found to moderate accuracy of perceptions of ability change (i.e., congruence typology). Women were more pessimistic than men regarding their decline on Spatial Orientation. In our society, women, particularly older women, frequently report themselves to be less competent at tasks involving Spatial Orientation, such as map reading and giving directions. Our findings suggest that women’s overly pessimistic views of decline in Spatial Orientation ability (compared with those of men) may be fostered by negative gender stereotypes because their individual performance profiles do not warrant such pessimism. Finally, the old (compared with the young) were more pessimistic regarding age-related decline in their verbal and Inductive Reasoning abilities than the performance data would support. Of particular concern is the pessimism of the elderly regarding decline in their verbal ability. Because verbal ability remains relatively stable into old age (see chapter 5), it seems reasonable that most older adults should feel fairly confident of their verbal skills.
The stability of the congruence types over a 14-year period was examined in a master’s thesis by Roth (2001). This study replicated congruence types for a second 7-year period (1984–1991) and examined the consistency of membership in the same congruence type over the 14-year period. It also examined the relation of performance level and change over time to both congruence type and consistency of congruence type.
The subsample for the following analyses included those individuals who had complete data on the five basic primary mental abilities in 1977, 1984, and 1991 and who had completed the retrospective PMA performance questionnaire. This sample consisted of 588 participants (264 males, 324 females). The participants’ mean age in 1977 was 51.1 years (SD = 12.09; range 22–79). The sample was divided into three age/cohort groups by their base age in 1977. The age categories were young adult (n = 121, mean age = 33.23 years; SD = 4.66; range 20–39); middle-aged (n = 308, mean age = 50.61 years; SD = 5.34; range 40–59); and older adults (n = 159, mean age = 65.49 years; SD = 4.20; range 60–79).
The following analyses included the five basic PMA measures of Verbal Meaning, Spatial Orientation, Inductive Reasoning, Number, and Word Fluency; the PMA Retrospective Questionnaire; and the three factor scores from the Test of Behavioral Rigidity: Motor-Cognitive Flexibility, Attitudinal Flexibility, and Psychomotor Speed (see chapter 3).
As in the earlier studies, participants were classified as having remained stable, having gained, or having lost by using the criterion of 1 SEM to determine change from 1977 to 1984 and from 1984 to 1991. Cross-tabulations were then made between actual change and perceived change, and participants were classified as pessimists, who underestimate positive change or overestimate negative change; optimists, who overestimate positive change or underestimate negative change; and realists, who accurately estimate their observed change.
For the determination of consistency of congruency type across time, participants were classified into a five-category typology:
1. Participants who were pessimists over both time periods
2. Participants who were realists over both time periods
3. Participants who were optimists over both time periods
4. Participants who changed toward pessimism
5. Participants who moved toward optimism
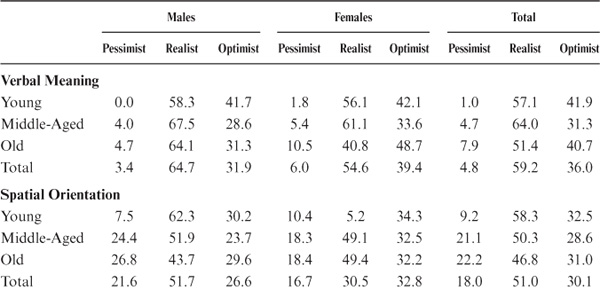
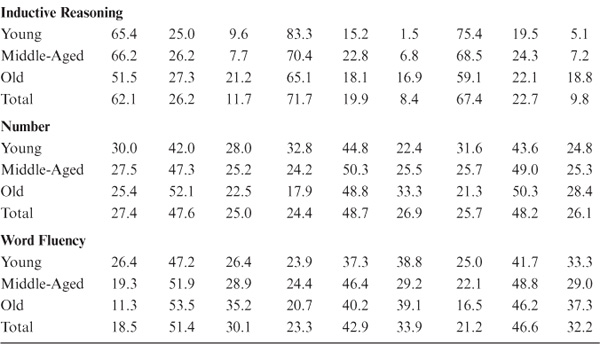
The first step in the consistency analysis was to replicate the 1984 findings with respect to congruence type for the 1984–1991 time interval. Assignment to congruence types differed significantly from chance for all five abilities [χ2(V)(df = 1588) = 232.64, p < .001;χ2(S)(df = 1588) = 92.92, p < .001;χ2(R)(df = 1588) = 306.56, p < .001;χ2(N)(df = 1588) = 56.80, p < .001;χ2(W)(df = 1588) = 56.90, p < .001]. Almost half of all participants were realistic in their estimation of change, except for Inductive Reasoning, for which the majority of participants were pessimistic. Proportions of congruence types for each ability and broken down by age and gender are shown in table 16.6.
Significant gender differences in congruency types were found for Verbal Meaning, with a greater proportion of women than men optimistic about their change on Verbal Meaning. Significant age differences were observed for Inductive Reasoning, with more young adults pessimistic than older adults, more older adults optimistic than younger adults, and more middle-aged participants realistic than either younger or older adults.
Age differences were significant also for Spatial Orientation, with young adults more realistic or optimistic than middle-aged adults. Finally, older adults were more pessimistic than young adults, both young and old adults were more optimistic than the middle-aged, and more middle-aged were realistic than were older adults.
TABLE 16.6. Proportions of 1991 Congruence Types by Ability, Age, and Gender
Patterns of change across the two time periods were next cross-tabulated. Again, chi-square analyses indicated that assignment to consistency patterns differed significantly from chance for all five abilities [χ2(V)(df = 4588) = 270.84, p < .001;χ2(S)(df = 4588) = 223.95, p < .001;χ2(R)(df = 4588) = 466.96, p < .001;χ2(N)(df = 4588) = 102.630, p < .001;χ2(W)(df = 1588) = 123.33, p < .001]. Table 16.7 gives the proportion of each of the five consistency patterns in congruence patterns for every ability.
Overall, for Verbal Meaning, about 37% of the sample remained realistic; about 36% became more pessimistic. For Spatial Orientation, more than 40% became more pessimistic, and 25% remained realistic. For Inductive Reasoning, more than 55% became more optimistic. For Number, about 30% became more pessimistic, and about 25% became more optimistic. For Word Fluency, 30% became more pessimistic, 25% became more optimistic, and 25% remained realistic.
TABLE 16.7 Proportions of Consistency in Congruence Patterns by Ability, Age, and Gender
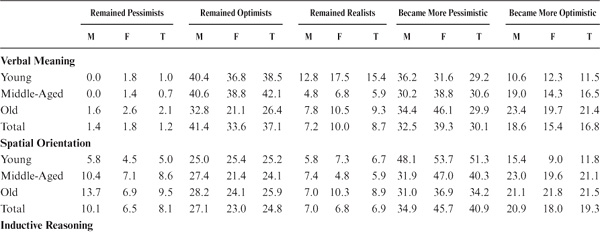
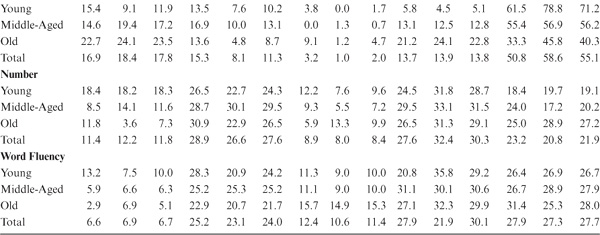
Significant gender differences in the distribution of consistency patterns were found only for Inductive Reasoning, with more women becoming more optimistic over time than men.
Significant age differences were observed for Inductive Reasoning, for which more middle-aged and older adults either remained pessimistic or became more pessimistic than did younger adults. Also, young adults became more optimistic than middle-aged adults, and both the young and middle-aged became more optimistic than the old adults.
For Verbal Meaning, more young adults remained realistic than did either the middle-aged or old. Older adults became more pessimistic than did the younger and middle-aged adults, and more middle-aged and older adults became more optimistic than did the young adults.
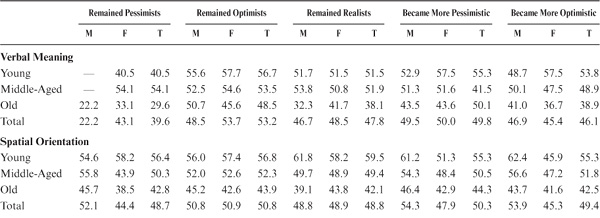
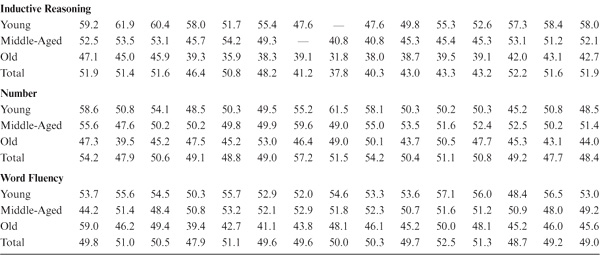
Performance levels on the primary mental abilities in 1991 were next related to congruence type in 1977 by means of a 3 (1977/1984 congruence type) × 3 (age group) × 2 (gender) ANOVA, separately for each ability. This analysis examined the impact of congruence type on performance level after a 7-year interval. Significant congruence type differences in performance level were observed for Verbal Meaning [F (2,588) = 8.79, p < .001], Inductive Reasoning [F (2,588) = 15.35, p < .001], Number [F (2,588) = 3.73, p < .05], and Word Fluency [F (2,588) = 3.44, p < .05]. Pessimists performed better than realists or optimists on Inductive Reasoning. However, realists and optimists performed better than pessimists on Verbal Meaning. In addition, optimists performed better than realists on Number and Word Fluency.
No Congruence Type × Gender interaction was found. However, there were significant Congruence Type × Age interactions for Verbal Meaning and Word Fluency. For Verbal Meaning, both the young and old pessimists performed significantly below the optimists and realists; there were no differences in congruence types for the middle-aged. On Word Fluency, old pessimists performed better than old realists or optimists, and middle-aged pessimists did less well than the other types. Table 16.8 provides standardized means for the 1991 cognitive ability performance by 1984/1991 congruence type, age, and gender.
Differences in 1991 cognitive ability levels were further examined in terms of the congruence consistency patterns by means of a 5 (consistency in congruence type) × 3 (age group) × 2 (gender) ANOVA separately for each ability. Significant performance differences by consistency patterns were found for Verbal Meaning [F (4,588) = 906, p < .001]; Inductive Reasoning [F (4,588) = 9.27, p < .001]; and Number [F (4,588) = 3.96, p < .01]. On Verbal Meaning, those who remained realistic performed better than all other groups. Those who remained pessimists or who became more optimistic performed significantly better than all other groups on Inductive Reasoning, and participants who remained optimists did better on the Number ability.
TABLE 16.8. Standardized Means for 1991 Cognitive Ability Performance by Congruence Type, Age, and Gender
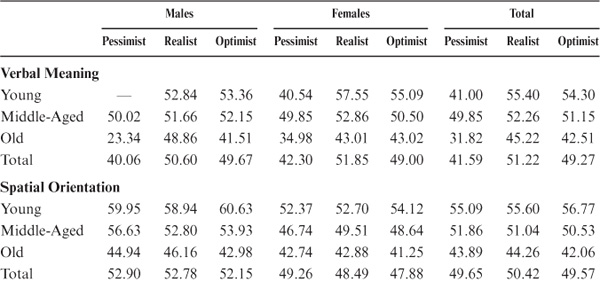
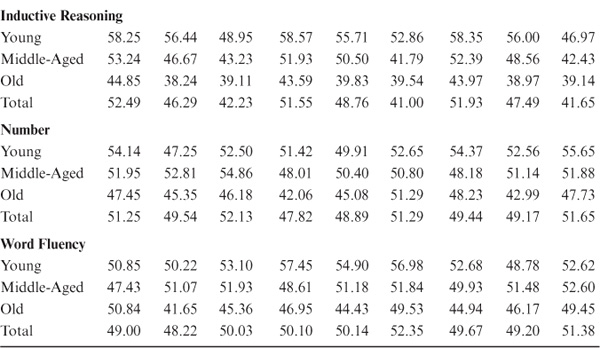
The Gender × Congruence pattern interaction was significant only for Spatial Orientation. Although gender differences in favor of men are usually found for this ability, the gender differences were not significant for those individuals who consistently remained either realists or optimists. Again, we provide standardized means for the 1991 performance level by congruence consistency pattern, age, and gender (see table 16.9).
Of concern also is the effect of congruence type on cognitive change over 7 years. This effect was analyzed by means of a 3 (congruence type) × 3 (age group) × 2 (gender) ANOVA separately for each of the five abilities. Statistically significant effects of congruence type on magnitude of change over 7 years were found for Verbal Meaning [F (2,588) = 14.77, p < .001], Inductive Reasoning [F (2,588) = 11.24, p < .001], and Word Fluency [F (2,588) = 3.84, p < .05]. Optimists improved; pessimists and realists declined on Verbal Meaning and Inductive Reasoning. Also, there were no significant congruence type by age or gender interactions. Magnitudes of change were fairly similar to those reported in table 16.5.
TABLE 16.9. Standardized Means for 1991 Ability Scores by Consistency in Congruency Types
Possible effects of the different consistency patterns in congruence type on cognitive change over 7 years were investigated by a 5 (consistency pattern) × 3 (age group) × 2 (gender) ANOVA for each ability. Significant effects of congruence type on magnitude of change over 7 years were found for all abilities: Verbal Meaning [F (4,588) = 27.03, p < .001], Spatial Orientation [F (4,588) = 22.11, p < .001], Inductive Reasoning [F (4,588) = 27.03, p < .001], Number [F (4,588) = 19.67, p < .010], and Word Fluency [F (4,588) = 24.52, p < .001]. For all abilities, participants who remained pessimists or became more pessimistic had significantly greater positive change than did realists, in contrast to optimists or those becoming more optimistic who experienced negative changes. There were no significant congruence type by age or gender interactions. Table 16.10 therefore reports mean changes by consistency pattern only for the total sample.
In the analyses in this section, study participants were classified by congruence types for two 7-year periods, as well as for consistency in congruency over the two periods. Performance levels for the three types (pessimists, realists, optimists) differed by ability. Thus, pessimists did better in Inductive Reasoning, and Optimists excelled in Verbal Meaning. However, optimists tended to show greater positive change over time than did pessimists and realists. On the other hand, when consistency of congruency was examined, it was the pessimists or those becoming more pessimistic who showed greater improvement over time; those who were optimists or became more optimistic actually experienced negative cognitive changes.
Perceptions of change in cognitive functioning over a brief period of time were examined for the five basic primary mental abilities as part of the intervention studies described in chapter 7. Here, the question of interest was whether participants could accurately perceive short-term shifts in cognitive performance occurring between repetitions of the same test over a period of 2 to 4 weeks; another question was whether participants who were given cognitive training in a specific ability were more likely to perceive change accurately than those not so trained.
TABLE 16.10. Mean T-Score Change from 1984 to 1991 in Ability Scores by Consistency in Congruence Types

Three subsamples selected for this study included those individuals who had taken the PMA battery twice as part of the intervention study. There were 399 participants (177 men and 222 women) with a mean age in 1984 of 72.55 years (SD = 6.87; range 64–95), 310 participants (136 men and 174 women) with a mean age in 1991 of 75.2 years (SD = 6.31; range 64–93), and 346 participants (143 men and 203 women) with a mean age in 1998 of 76.19 years (SD 6.95; range 64–95).
After completing the five PMA tests (Verbal Meaning, Spatial Orientation, Inductive Reasoning, Number, and Word Fluency) during the posttest, study participants again answered the PMA Retrospective Questionnaire. Participants were reminded that they had taken the same five ability tests several weeks earlier and were asked to indicate how their performance on the tests just completed (at posttest) compared with their earlier performance (at pretest). Participants evaluated their relative performance for each of the five abilities using a 5-point scale with the categories (1) much better today, (2) better today, (3) about the same, (4) worse today, (5) much worse today. Again, only a few persons chose the extreme categories (1 or 5), and these categories were collapsed into a 3-point scale, resulting in three perceiver types: better, same, and worse.
Study participants were classified according to how their actual PMA performance had changed from pretest to posttest on each of the five abilities. Difference scores between the two test occasions were computed, and participants were classified into groups showing reliably higher, similar, or lower performance for each ability. The classification criterion for a positive or negative change was that the participant at posttest performed at least 1 SEM below or above his or her pretest performance (see Dudek, 1979; Schaie, 1989c). Based on the cross-tabulations between actual performance change and perceived performance change, the samples were again categorized into the three congruence types (pessimists, realists, and optimists) for each ability, as described in table 16.1.
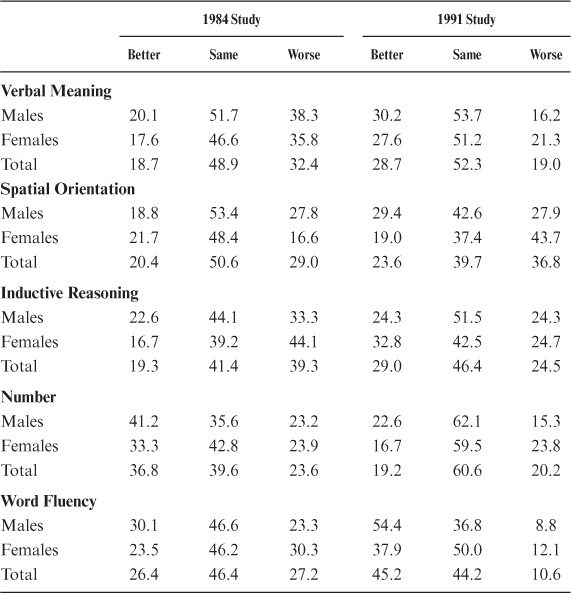
The proportions of study participants indicating that they had improved, remained stable, or become worse from pre- to posttest are shown in table 16.11. No significant gender effects were observed in the 1984 study. However, in 1991 there was a significant gender effect for Spatial Orientation [χ2(2, N = 310) = 9.22, p < .01] that reflected more men than women perceiving positive change and more women than men perceiving negative change. Likewise, a significant gender effect for Word Fluency [χ2(2, N = 310) = 8.37, p < .01] indicated that men perceived positive change more frequently than women, whereas women perceived lack of change more frequently than males. In 1998, we also found a significant gender effect for Spatial Orientation [χ2(2, N = 346) = 9.10, p < .01], reflecting more women perceiving negative change than did men.
There were also some interesting secular differences in perceived change. These differences involved an increase of positive perceptions from 1984 to 1991, as well as decline in negative perceptions for Verbal Meaning from 1984 through 1998. Inductive Reasoning and Word Fluency also showed an increase in positive perceptions and a decrease in negative perceptions over the three occasions. From 1984 to 1991, perceptions of Spatial Orientation and Number were less negative than those reported in 1984.
TABLE 16.11. Proportion of Study Participants Reporting Perceived Change in Performance from Pre- to Posttest by Ability and Gender
The correlations between perceived and actual change for the same ability (convergent validity) were statistically significant on all three occasions only for Inductive Reasoning and Word Fluency. In addition, there was a significant correlation for Spatial Orientation in 1984 and 1998 and for Number in 1991 and 1998. These correlations, however, were small even though, for the most part, they were larger than cross-ability correlations (divergent validity; see table 16.12). As for the ratings over the 7-year period, significantly larger correlations were again found among ratings of perceived change across abilities, giving further credence to the conclusion that ratings of perceived change are associated with global perceptions of change in intellectual functioning in addition to the actually observed change on the target ability.
Figure 16.2 shows proportions of each congruence type from pre- to posttest by ability and occasion. Again, assuming that the expected chance probability of assignment to one of the three response congruence types was .33, chi-square analyses determined that assignment to type differed significantly from chance at the 1% level of confidence. In 1984, approximately 40% to 50% of the participants were realistic in their perception of change or stability from pre- to posttest. Participants were most accurate (realistic) in estimating stability or change on the Verbal Meaning and Spatial Orientation tests and least realistic on Inductive Reasoning and Number. The highest proportion of optimists was found for Number (36.6%) and the lowest for Verbal Meaning (18.7%). A pessimistic assessment of performance change was highest for Inductive Reasoning (39.3%) and lowest for Number (23.6%).
TABLE 16.12. Correlations Between Perceived and Actual Change from Pretest to Posttest
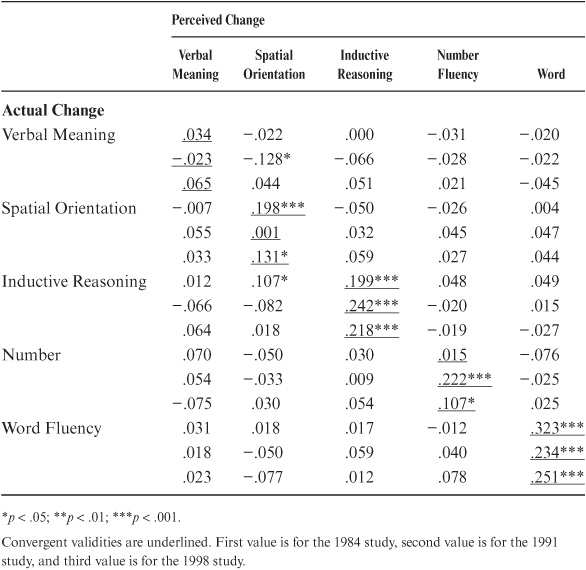
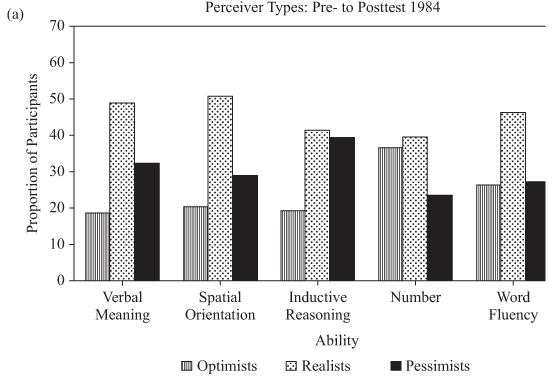
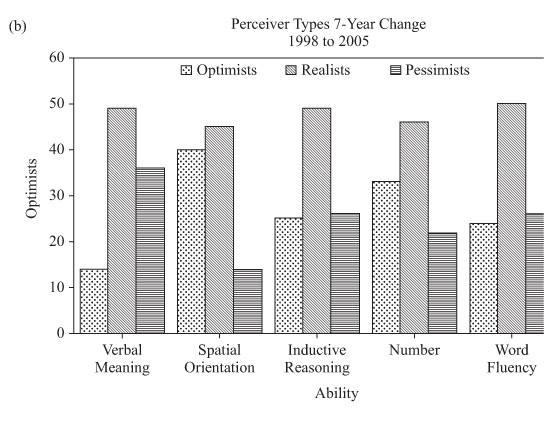
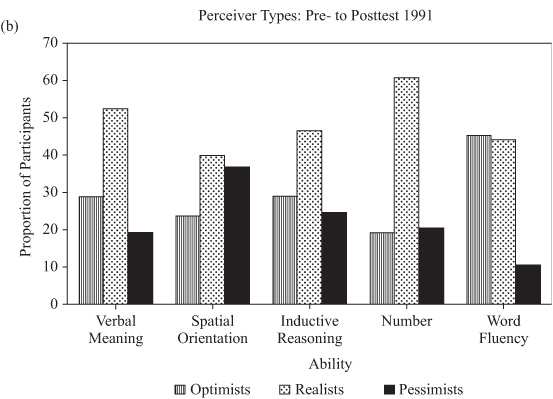
FIGURE 16.2. Proportions of perceiver types from pretest to posttest for the (a) 1984, (b) 1991, and (c) 1998 training studies.
Secular shifts were also found in the perceiver types. In 1991, proportions of realistic perceivers had increased, with a low of 39.7% for Spatial Orientation and a high of 60.6% for Number. The highest proportion of optimists now occurred for Word Fluency (45.26%), and the lowest proportion remained for Number (19.2%). Likewise, the highest proportion of pessimists now occurred for Spatial Orientation and the lowest for Word Fluency.
By 1998, the lowest proportion of realists continued to occur for Spatial Orientation (41.3%); the highest proportion of realists shifted to Verbal Meaning (59.2%). The highest proportion of optimists continued for Word Fluency (36.8%), with the lowest for Verbal Meaning (21.1%) and Spatial Orientation (22.3%). Most pessimists were found for Spatial Orientation and least for Word Fluency (14.8%).
A final question is whether study participants who are trained on a particular ability are likely to perceive greater positive change on that ability than a control group, as well as whether their perception of change (given the fact that they receive feedback during training) is more accurate than that of the controls. Indeed, on all three occasions the trained group reported significantly greater positive change than did the control group. The effect was more robust for the Inductive Reasoning training [χ2 1984(2, N = 228) = 15.45, p < .001;χ2 1991(2, N = 310) = 34.89, p < .001;χ2 1998(2, N = 346) = 19.88, p < .001] than for the Spatial Orientation training [χ2 1984(2, N = 228) = 5.88, p < .05;χ2 1991(2, N = 310) = 5.54, p < .06;χ2 1998(2, N = 346) = 7.96, p < .05]. However, there were no significant differences between those trained and their controls with respect to perceiver type.
In this chapter, I examined the accuracy of adults’ perceptions regarding an issue of increasing concern as we get older—whether our intellectual abilities are actually declining. These concerns were investigated by evaluating the accuracy of participants’ assessment of intellectual change over 7 years. The findings suggest that perceptions of ability decline are not limited to old age, but that there are also young and middle-aged individuals who perceive that their cognitive abilities have declined. These perceptions vary across abilities, age, and gender.
Subjective report of performance change was compared with actual observed change over 7 years. If participants thought that they had changed less than they actually did, they were designated as optimists; if they perceived change status correctly, they were called realists; and if they declined less than they reported, they were designated as pessimists. Frequency of assignment to these three congruence types varied by age and gender. For some abilities, women tended to be more likely to underestimate their performance, as did older study participants. However, accuracy of prediction was not strongly related to ability level. Thus, it appears that stereotypes of universal intellectual decline with increasing age do not seem to be supported either by adults’ perceptions or by the accuracy of their estimates.
We replicated the 7-year retrospective data for two 7-year periods in 1991 and 2005, and we also investigated the stability of the congruence types identified in this study over a 14-year period. Performance levels for the three congruence types (pessimists, realists, optimists) differed by ability. Pessimists performed better in Inductive Reasoning, and optimists excelled in Verbal Meaning. However, optimists tended to show greater positive change over time than did pessimists or realists. However, when consistency of congruency over time was examined, it was the pessimists or those becoming more pessimistic who showed greater improvement over time; those who were optimists or became more optimistic experienced negative cognitive changes.
We also evaluated judgments of short-term change after repeated testing and training interventions spanning a 4-week period for three different training occasions (see chapter 7). Accuracy of prediction was modest, and it varied by ability, but was greatest on the ability on which the participants had actually been trained. Frequencies of congruence types showed secular changes, with an increase in the proportion of realists and decrease in the proportion of pessimists.