One of the pervasive puzzles in the psychology of aging has been the question why some individuals retain their behavioral competence well into advanced old age, while others show early decline (cf. Schaie, 2005a; Willis, 1985). In this chapter I propose that we can move further in the prediction of the individual course of adult development by applying the methods of event history analysis (Allison, 1984), a technique pioneered by sociologists, to data involving changes of states in individual behavior related to human aging. This technique has also been introduced into epidemiology under the name of “survival analysis” and in industrial engineering under the name of “accelerated failure time analysis.” Within the context of the study of adult development, I have previously argued that the dependent variable of interest for psychologists and other developmentalists is not the historical time at which a given event occurs but rather the age (calendar or functional) at which the event is observed (cf. Schaie, 1989a; Wohlwill, 1973).
This chapter is divided into three parts: First, I describe briefly those aspects of event history analysis that are most germane to our proposed enterprise. Second, I consider the occurrence of significant decline in cognitive abilities as an exemplar, and finally I present life tables and hazard functions that allow the assessment of risk for future decline, as well as the prediction of the calendar age at which individuals can expect cognitive decline to occur given certain demographic and other characteristics.
Event history analysis is concerned with the prediction of change that represents a relatively disjunctive shift between what precedes and what follows. Allison (1984) suggests that because “events are defined in terms of change over time … the best way to study events and their causes is to collect event history data.” The needed data are a longitudinal record of when events happen, as well as information on possible causal data that are to be used to explain the events. It should be noted that some of these causal variables may be constant indicators, such as sex, while other variables, such as marital status, income, or health status, may themselves vary over time.
The study of events occurring over time has been of interest since the 18th century, ever since actuaries began to construct life tables to determine the odds of survival for the purpose of computing insurance premiums (cf. Pollard, Yussuf, & Pollard, 1981). Indeed, one of the most influential methods for the analysis of event data, the partial likelihood method (Cox, 1972), was influenced by the basic ideas of the life table. More recently, however, there have been substantive needs in the biomedical sciences that have called for the analysis of survival data. While the dependent event of interest, say in a drug study, may be the death of the organism, one important aspect of such studies is that the occurrence of the event may be “censored” because the experiment is discontinued before all participants have experienced the final event (cf. Kalbfleisch & Prentice, 1980). Similar substantive problems have also been experienced by engineers interested in testing machinery and their components for breakdown across the useful life of the machinery. The methods used are known under such labels as “accelerated failure time” analyses (Nelson, 1982). In the social sciences, these issues began to be addressed with the introduction of explanatory variables into continuous time Markov models (Tuma, 1976, 1982). We are most interested in applications to discrete-time data by Allison (1982). It is the latter approach that is of particular interest for our purposes.
I have previously argued that in the study of individual lives, while recognizing the importance of the historical time when an event occurs (cf. Schaie, 1977, 1986, 2006a), it is more important from a developmental point of view to index the event in terms of the age (whether calendar or functional) at which the event has occurred. In other words, the unit of analysis is the number of years lived. For purposes of my analyses, therefore, I will routinely substitute the age of the individual for the event time, while the historical time at which the event occurred will take on the role of a possible explanatory variable. The event that is considered here is whether or not a participant in the SLS has experienced a significant decline on one of the five mental abilities monitored from one test occasion to the next. The determination of a significant decline of necessity uses a statistical criterion. In this case we conclude that the event has occurred whenever an individual’s score at Ti + 1 falls below the confidence interval of 1 standard error of measurement (SEM) of the difference from that individual’s base score at Ti.
One simple way of dealing with the prediction of events would be to regress a set of explanatory variables upon a dummy variable indicating whether an event had or had not occurred during a particular time interval. Such an approach, however, not only wastes information but is also subject to the well-known problems in using ordinary least squares with a dummy dependent variable (cf. Hanushek & Jackson, 1977). A more desirable approach is to use length of time until the occurrence of the event, in our case chronological age, as the dependent variable. I have already noted, however, the problem of “censoring.” There are actually two different types of censoring. First, we do not know at what age the decline will occur for those individuals who do not experience decline during the observation period. This is what sociologists call “right censoring.” Second, there is “left censoring;” that is, we do not know whether individuals might already have shown decline prior to their entry into our study (cf. Tuma & Hannan, 1978). Event history estimation methods explicitly deal with right censoring by including an appropriate dummy variable for censoring as part of the dependent variable. Left censoring is a somewhat more difficult issue. If only one time interval is monitored, it may be necessary to assume that decline has not previously occurred. If multiple observation intervals are available, it is then possible to build the prior occurrence of decline into our model as one or more explanatory variables.
Another issue dealt with by event history analysis methods is the problem that explanatory variables may themselves be time varying. For example, marital state may change; income level, or other relevant lifestyle and personality variables, may also change over time. Ordinary regression methods cannot deal with this issue, but several event history analysis algorithms do allow the modeling of time-varying independent variables (e.g., Harrell, 1980; Preston & Clarkson, 1983).
Different types of approaches to the analysis of event history according to Allison (1984) may be distinguished along five dimensions: distributional versus regression methods, repeated versus nonrepeated events, single versus multiple kind of events, parametric versus nonparametric methods, and the study of discrete versus continuous time. All of these methods might be appropriately applied to some parts of our data set, but choices must obviously be made. Along the first dimension, we are interested in the construction of morbidity tables with discrete time intervals. Discrete time methods also allow the most convenient model of decline as a nonrepeated event, if only because that represents the simplest testable model. Although it may be important to consider data with respect to the multiple occurrence of decrement, for simplicity’s sake, I will here confine myself to the assessment of models with respect to decline on single abilities, but it would clearly be possible also to consider the co-occurrence of decline on multiple abilities. Although continuous time methods have dominated the event history literature, it seems fairly clear that, except for P-technique types of studies, behavioral data such as ours are typically collected in discrete time intervals. Discrete time methods also allow the most convenient modeling of time-varying explanatory variables. Maximum likelihood logit analysis can be applied to the estimation of models for such data (e.g., SAS; SAS Institute, Inc., 1983). However, when we wish to treat calendar age as the dependent variable, in order to predict the age of most likely occurrence of the decline event given the differential characteristics of individuals, we must then obviously turn to methods suitable for the prediction of a continuous variable. Survival regression analyses like the SURVREG procedures developed by Preston and Clarkson (1983) or the LIFEREG procedure in SAS (SAS Institute, Inc. 1983) can be used for this purpose. In the remainder of this chapter, I provide three examples of the application of these methods to the issue of individual cognitive decline: a life table approach showing rates of decline for the primary mental abilities, the application of discrete methods of event history analysis to the prediction of the occurrence of decline events, and the application of continuous methods to the prediction of the age at which ability decline is likely to occur. I would like to caution the reader that each of these examples makes a set of somewhat restrictive assumptions, stated below, violation of which could lead the results reported here to be serious under- or overestimates of the actual hazard rates. The reader’s attention should therefore focus on the methodological approach rather than the numerical findings.
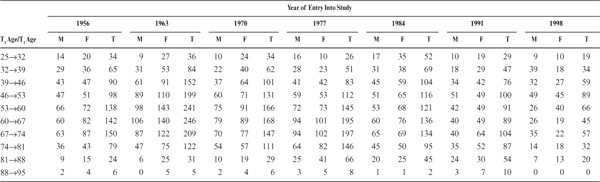
I shall now report some results of applying the methods I have just described to the SLS data set. I shall include in these analyses only those study participants on whom we have two or more data points. Table 19.1 provides a breakdown of this sample by age, gender, and data set (i.e., at which historical point in time when individuals entered the study.
The database considered in this chapter includes the data acquired during our seven major testing cycles (1956, 1963, 1970, 1977, 1984, 1991, 1998). Beginning with the second (1963) cycle, all previous subjects that could be accessed were retested, and new subject panels were randomly selected from the parent population. Because of the 7-year intervals used in this study, our data have been structured into 7-year age-cohort groupings. See chapter 3 for a detailed description of the database.
The principal variables included during all seven cycles of the SLS were measures of the primary mental abilities of Verbal Meaning, Space, Reasoning, Number, and Word Fluency. These variables were identified by Thurstone (1938) as accounting for the major proportion of individual differences variance in the abilities domain for children and adolescents and are contained in the 1948 version of the Thurstone’s SRA Primary Mental Abilities Test (Form AM 11–17; Schaie, 1985; Thurstone & Thurstone, 1949). A second set of variables collected consistently is the rigidity-flexibility measures from the Test of Behavioral Rigidity (Schaie, 1955, 2005a; Schaie & Parham, 1975).
Is it now possible to identify a series of independent variables that may account for part but not all of the observed change. Moreover, our longitudinal database allows us to examine how noncognitive individual difference variables may affect the hazards of decremental cognitive change over time. While average data seem to suggest that age changes occur in a continuous, sometimes linear, but often more complex form, it has become clear that individual change, by contrast, is likely to occur in a much more abrupt form (cf. Schaie, 1987). I would argue that such change most often is a shift from one level of functioning to another in response to the occurrence of abrupt or cumulative insults that reach a threshold value. I consequently wish to address two questions that logically emerge: First, I would like to construct morbidity estimates in the form of life tables, which permit probability statements with respect to the occurrence of significant decline for specific cognitive abilities. Second, I want to investigate how some of the identified individual differences variables modify these hazards, such that we can predict for a given individual the most likely age at which significant cognitive decline will occur for that individual. The implications of such an approach will also be considered. Before doing that, however, it is necessary to indicate how event history analysis may be germane to our quest.
TABLE 19.1. Numbers of Participants in the Age at First Decrement Study by Age, Gender, and Year of Entry Into the Study
The first question to be considered is how to determine the risk of the (first) occurrence of a significant decline in specific abilities at particular ages. As indicated earlier, my initial assumption for this purpose is that no significant decline has occurred prior to entry into the study (an assumption that cannot be tested here but could eventually be examined with the help of those of our data sets that cover multiple periods of observation). For the present analysis, I use the entire set of 6,143 individuals on whom event data are available over a 7-year period. In Figure 19.1, I present separately, for each of the five mental abilities that have been monitored throughout the SLS, the hazard rate of encountering significant decrement in every 7-year period ending from age 32 to age 95. The figure indicates the probability of experiencing a decrement event during the 7-year period preceding each of the ages given. The age-specific hazard rate generally increases with age for all abilities. However, the rise in age-specific hazard rate is gradual and at no age exceeds 40% for any ability.
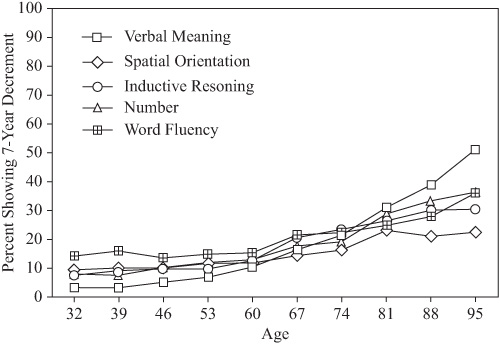
FIGURE 19.1. Hazard rate of encountering significant decrement in different abilities in every 7-year period ending from age 32 to age 95.
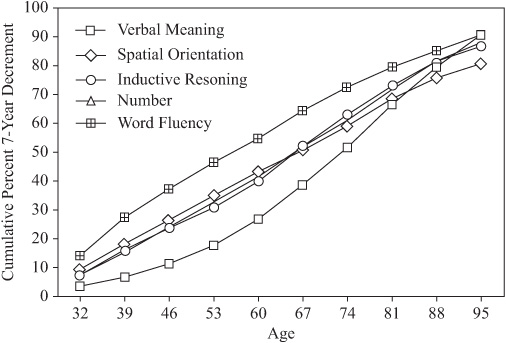
FIGURE 19.2. Cumulative hazard rate of significant decrement in different abilities occurring by successive ages from 32 to 95.
I also estimate the cumulative hazard rate for each of these age levels. For this purpose the population at risk is considered to be only those individuals who are observed at specific ages during the event interval. For each successive age, it is assumed that the population at risk for decline by that age is reduced by that proportion of participants who have already experienced the decline event at an earlier age. The respective cumulative hazard rates are presented in Figure 19.2. These rates are likely to be inflated, since they are not adjusted for the fact that some individuals “recover” serendipitously or through planned intervention to their predecline level at subsequent periods of observation. Although increases in cumulative hazards are not uniform across abilities, the overall hazard functions show the steepest increase for Spatial Orientation, and least increase for Inductive Reasoning and Verbal Meaning.
Figure 19.3 provides the cumulative hazard rates for the risk of declining on any one, two, three, four, or all of the five abilities that we have monitored. Again we must remember that these rates are probably inflated because they do not adjust for the recoupments that are quite common during middle age and young-old age. Nevertheless, it is interesting to note that the risk of a decline event exceeds .50 for at least one ability by age 46, and for two abilities at age 67. On the other hand, the cumulative hazard for the occurrence of decline events on three or more abilities does not reach a value of .50 until age 95.
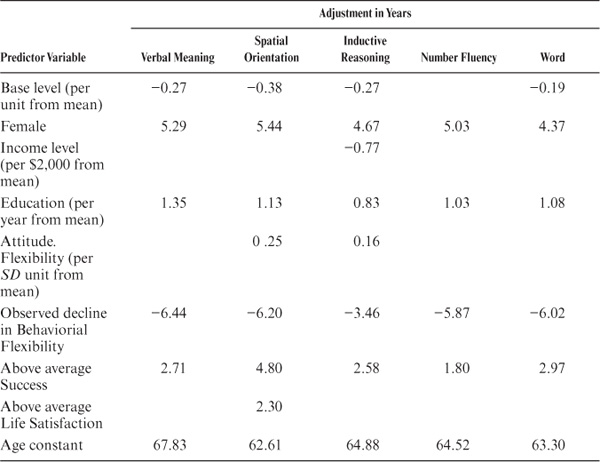
The final example to be given involves the application of continuous methods of event history analysis to the prediction of the age at which individuals are most likely to experience the initial decline event. In this analysis log age is treated as the dependent variable. Whether or not a decline event occurred by the age ending our period of observation provides once again the operational definition for right censoring. Log age was then regressed upon the same independent variables that were included in the discrete interval analyses described earlier. The LIFEREG procedure in SAS is used for this purpose. I first examined a number of the alternative distributions of decline events over chronological age that can be modeled with this procedure. The best fitting model (comparing resultant gamma values) that would yield comparable data across the five event categories was determined to have a Weibull distribution. The regression weights obtained by this analysis provide the values needed to adjust the average predicted year of occurrence for a particular decline event. The results of applying this model (again listing only moderator variables significant at the .05 level of confidence) are presented in Table 19.3. The bottom row in this table provides the age constant, that is, the average expected age of the decline events regardless of the status of individuals on the moderator variables. The specific age of decline for a given individual, conditional on his or her level on the significant moderator variables, can then be obtained by adding the appropriate values given in the table. Positive values are added to increase the age at which the decline is expected for a given individual, while negative values are subtracted to decrease the age of expected decline.
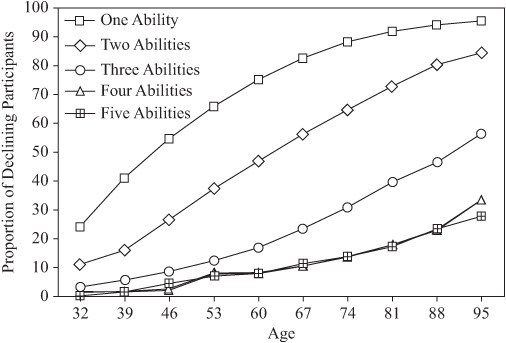
FIGURE 19.3. Cumulative hazard rates of declining on one to five mental abilities at ages from 32 to 95.
My next concern was to investigate the effect of a number of predictors on rates of decline, such that we might forecast the probability of decline at a particular age as moderated by other variables, such as demographic characteristics, health status, base level of performance prior to the occurrence of the decline event, or standing on relevant attitudinal or cognitive style variables. It is again assumed that no decline has occurred prior to entry into the study (left censoring), and that we control for the specific age at which the decline has occurred. We do so by first entering the age at which the decline is either observed or censored into the regression equation. Right censoring is defined by that age that ends our observation period.
TABLE 19.2. Risk Factors for the Occurrence of Cognitive Decline Events
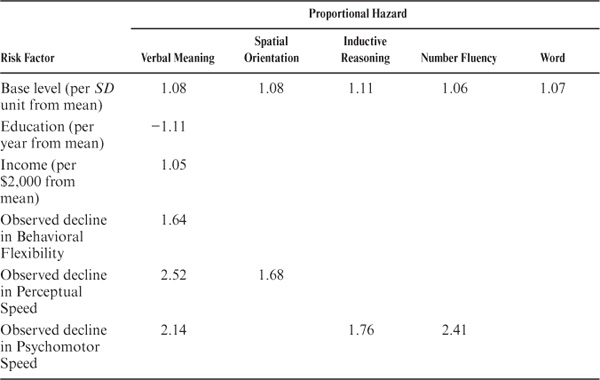
TABLE 19.3. Parameters for Predicting Age at Which First Decline Event Is Most Likely to Occur
The moderator variables entering the logistic regression model are listed in Table 19.3. These variables include fixed variables describing the status of our study participants at entry into the study, as well as changes in status occurring across the observation period. The model presents us with information on the probability of a decline event occurring at a particular age conditional on the occurrence or level of the moderator variable. Table 19.3 consequently provides the proportionate hazard of the moderator variables by which the age-specific or cumulative risk must be adjusted depending upon the individual’s standing on the relevant moderator variables (values are given only for those moderators that are statistically reliable at or beyond the .05 level of confidence). These values are obtained by exponentiation of the logistic regression weights. Obviously the precision of these estimates could be increased markedly if we modeled the age by moderator interactions. Even larger sample sizes than available to us would, however, be needed for this purpose.
The hazard rates in Table 19.2 should be understood to mean the proportionate increase in hazard for each standard deviation unit from the mean of the predictor for the positive values and proportionate decrease in hazard for negative values in the case of continuous predictor variables. For dichotomous predictors, a positive hazard rate implies the increase in the likelihood of decline given the presence of the stated predictive event, while a negative hazard rate indicates the decrease in likelihood of the event. For example, the hazard of a decline event for Verbal Meaning increases by 8% for each SD of educational attainment that an individual is above the population mean. Likewise, the hazard for experiencing a decline event for Inductive Reasoning increases by 64%, if an individual has experienced a significant decline in Behavioral Flexibility during the observation period.
In this chapter, I described the next steps that we have taken to develop algorithms that allow us to estimate individual’s risks and their modifiers for the occurrence of significant declines over the preceding 7-year period on five primary abilities for periods ending from age 32 to age 70. We first presented morbidity tables for the occurrence of cognitive decline and charted morbidity functions representing such tables. It is hoped that these morbidity functions may be more useful than presently available forms of data presentation in projecting cognitive risk factors. The morbidity functions call attention to the fact that cognitive decline is highly specific, and that even among the very old, it is unlikely to find community-dwelling individuals who have declined across the board. The morbidity functions may be useful for a number of rather practical purposes. For example, they might help us determine the ages at which cognitive intervention would be most appropriate, or to determine whether there are indeed ages at which most of the population declines for a specific variable for which performance at a high level is required in certain occupations. Because of the restrictive assumptions imposed on the specific database examples given in this chapter, it is necessary to limit the substantive inferences that could be made from them; they were provided primarily as illustrative examples.
We next applied Cox regression methods to predict the age of first 7-year decline. Included in these analyses were the identification of significant moderators of decline and their respective magnitude. The latter are the adjustments needed for those individual characteristics that moderate the risk of decline. These moderators were found to include Gender, Education, Motor-Cognitive Flexibility, and Psychomotor Speed as well as Life Satisfaction.
The methods described here could obviously be extended to other variables than those included in the SLS by application to other longitudinal databases such as the Duke Study (Siegler, 1983), the Bonn Longitudinal Study (Schmitz-Scherzer & Thomae, 1983), or the Baltimore Longitudinal Study (Shock et al., 1984). They can also be applied to the analysis of decline events with respect to measures of practical intelligence (cf. Schaie, 1987; Willis & Schaie, 1986a) or to the analysis of experimental mortality in multiwave studies (cf. Cooney, Schaie, & Willis, 1988; Schaie 1988b).
The application of event history analysis, moreover, allows us to proceed from the definition of population hazards of decline to the specification of differential risks of individual decline, a prediction that would increase in precision as we continue to refine our knowledge of the sources of individual differences in cognitive aging. For example, while we have the requisite data, we have not yet applied event history analysis to determine the differential effects of selected diseases upon the occurrence of cognitive decline events. Such work, hopefully, will permit us not only to chart risk factors for individuals that may be subject to intervention, but will allow us to also make further progress toward a psychology of differential aging, moving from projections about individuals as members of a class, to judge the hazards of cognitive aging on a truly individual basis.
Perhaps even more important may be the possible impact of new methodologies in leading to a paradigm shift in theorizing for the behavioral study of aging (cf. Schaie, 1988a). My introduction of the concepts of cohort and time-of-measurement into behavioral aging research, and the resulting development of sequential methods of data collection and analysis (Schaie, 1965), led to a far greater concern with the effects of contextual variables on psychological changes with age (cf. Abeles & Riley, 1987; Baltes & Nesselroade, 1979). It is my hope that the introduction of the methods of event history analysis to the study of behavioral change across age will similarly lead to a greater preoccupation with the analysis and prediction of the risk factors for developmental events in populations and individuals as they age.