Chapter One
Step I: Idea Generation
How do you find investment ideas?
There are tens of thousands of publicly-traded companies on various stock exchanges around the world. So, where do you begin? The search for investment ideas takes many forms. At a basic level, it starts with reading … a lot. Stay on top of industry standards, such as Barron's, Bloomberg, Grant's, The Financial Times, and The Wall Street Journal, and broaden from there. Successful investors pay attention to what is going on in the world.
Your search also extends to everyday life and the products and services around you. There are countless stories of people who found great stock ideas inspired by observations from their daily lives. What are people buying? Where are they shopping? What are they talking about? What websites are they visiting?
Many investors take a bottom-up approach, which focuses on the fundamentals of individual companies. Within bottom-up, several common sources of investment ideas are prevalent. These include undervalued companies, “earnings compounders,” operational improvement and turnaround stories, M&A, spin-offs, restructurings, and capital return. Evaluating these opportunities requires a basic understanding of business drivers, financial analysis, and valuation. You didn't go to business school? Don't worry—bottom-up investing is the primary focus of our book and we've got you covered in the chapters ahead.
Others employ a top-down approach, whereby they search for opportunities based on macro or secular themes. These themes are expected to drive accelerated earnings growth and ideally the revaluation of a particular sector. Key macro top-down strategies center on global market trends and business cycles, as well as movements in interest rates, currencies, and commodities. Secular themes include changing consumption patterns, product penetration rates, and demographics, as well as emerging technologies, structural competitive shifts, and regulatory developments.
Experienced investors tend to incorporate elements of both bottom-up and top-down in their approach. Even the most ardent fundamentals-based investors are highly attuned to the macro environment. It is imperative to understand the impact that certain scenarios can have on individual stocks. As the saying goes: “If you don't do macro, macro will do you.”
The process of generating ideas requires great patience and discipline. You may need to review hundreds of companies before a high-quality opportunity stands out. Therefore, it is critical to know where to look and what to look for.
While certain techniques are prevalent, each investor develops a distinct style with its own nuances and variations. The experience-based nature of investing means that professional investors tend to fine-tune their idea generation techniques over time. Even the most seasoned pros must evolve and adapt to dynamic market conditions, adding various bells and whistles along the way.
Screens
Screening tools are helpful for efficiently sourcing investment ideas. Screens allow you to use customized criteria to sift through large databases of companies to identify stock opportunities. Pros run screens on a regular basis in their continuous search for ideas.
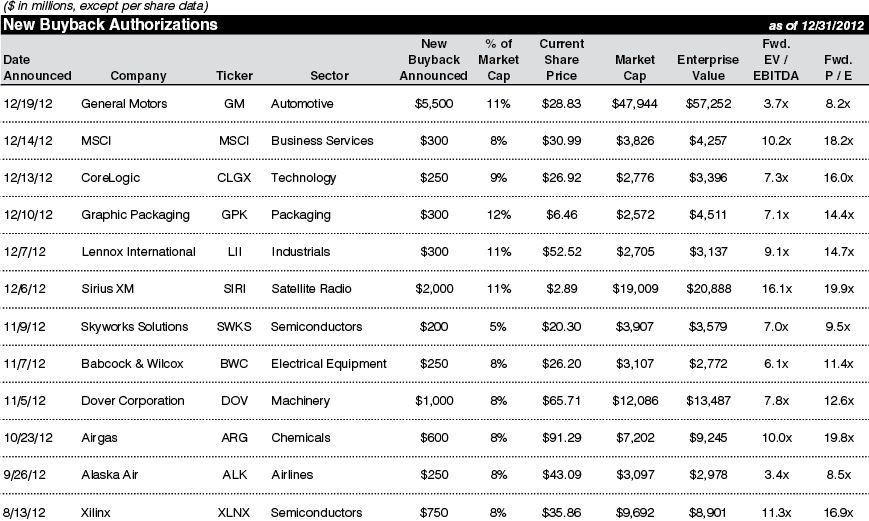
A bottom-up screen might target stocks trading below a specified valuation level or growing above a certain rate. Another might focus on recent M&A transactions, upcoming IPOs, or companies with new share repurchase authorizations (see Exhibit 1.1).
A top-down investor with a thesis on increasing oil prices would screen for energy sector opportunities in combination with financial criteria. Alternatively, a thesis might center on the secular trends of increasing broadband usage or mobile device proliferation. Here, the screen would focus on sub-sectors within Tech, Media & Telecom (TMT) with additional filters for selected financial metrics.
A multitude of stock screening tools are widely available online for free or at relatively low cost (e.g., Yahoo! Finance). At a minimum, you should set up alerts from financial news sources (e.g., Google Alerts, WSJ) that automatically pick up newly announced corporate events. More advanced tools that are highly customizable can be accessed from subscription services, such as Bloomberg.
EXHIBIT 1.1 Screening Output—Buyback Authorizations >5% of Market Cap & Market Cap >$1 billion
Bottom-Up Approach
Bottom-up investing is a company-first approach to identifying attractive stocks. You start with the individual company and perform in-depth analysis on its business drivers, financial performance, valuation, and future prospects. This type of work forms the basis of traditional stock picking.
Common bottom-up investment strategies include long-only, long/short, and event-driven/special situations. Others focus on specific sectors or geographies. The long-only strategy is centered on buying and holding a portfolio of quality stocks, often with a long-term perspective. Long/short layers in a shorting strategy to protect against specific stock or sector risks, overall market risk, or to produce returns in its own right (see Chapter 5). An event-driven/special situations strategy focuses on corporate actions such as M&A, spin-offs, and buybacks.
As shown in Exhibit 1.2, certain areas have proven to be fruitful for sourcing quality investment ideas. For example, “value investors” tend to focus on undervalued stocks that are misunderstood by the market. Stock pickers also look for companies undertaking shareholder-friendly activities, such as buybacks, M&A, and management upgrades.
EXHIBIT 1.2 Bottom-Up Approach
Bottom-Up Approach
- Valuation
- Financial Performance
- Mergers & Acquisitions
- Spin-offs & Divestitures
- Restructurings & Turnarounds
- Buybacks & Dividends
- Initial Public Offerings
- Insider Buying & Ownership
- Tracking Successful Investors & Activists
- Valuation – traditional valuation screens seek to identify stocks that are “cheap,” usually on the basis of a valuation multiple. It is, however, important to distinguish between companies that are cheap because they are misunderstood vs. those that deserve to be.
- Financial Performance – financial metrics and trends are critical for identifying potential winners and losers. Improving fundamentals may signal a compelling investment opportunity, e.g., accelerating growth rates, expanding profit margins, deleveraging, and improving returns. Companies with inferior margins vs. peers merit analysis on whether they can close the gap.
- Mergers & Acquisitions – M&A can create substantial long-term value for shareholders. This is especially true when acquirers undertake transformational acquisitions or “bolt-ons” that are accretive and portfolio enhancing. Identifying sectors “in play” can lead to opportunities among both acquirers and targets.
- Spin-offs & Divestitures – transactions where a company “spins” (distributes to existing shareholders), IPOs, or sells one or more of its businesses/divisions. Spin-offs and divestitures aim to unlock or highlight the full value of distinct businesses currently under one corporate umbrella.
- Restructurings & Turnarounds – restructurings are situations where a company emerges from bankruptcy/reorganization with a public equity listing, typically accompanied by a stronger balance sheet. Turnaround situations exist outside of formal bankruptcies and restructurings. Any troubled company represents an opportunity to explore the potential for dramatic improvement.
- Buybacks & Dividends – two main methods for returning cash to shareholders. For buybacks, companies engaging in first-time, systematic, or substantial share repurchases (e.g., >5% of the public float annually) are particularly interesting. For dividends, new initiations, sizable yields, or increasing payout ratios1 merit exploration.
- Initial Public Offerings – first-time public offerings by companies, including those owned by private equity (PE) 2 and venture capital (VC) firms. Often, these companies are offered at a discount to peers and may not be well-understood by the market due to lack of a public track record or comps.
- Insider Buying & Ownership – senior executive(s) purchasing substantial stock in their company may signal that the shares are undervalued or there is significant value creation ahead. Correspondingly, proven CEOs that have large financial incentives to improve performance deserve attention.
- Tracking Successful Investors & Activists – reviewing public filings for a select group of investors with strong track records can uncover buying opportunities. The SEC3 requires investment funds with $100 million or greater in assets under management (AUM) to disclose their equity holdings on a quarterly basis in a Schedule 13-F filing.4
Valuation
When performing valuation screens, you need to go beyond just finding “cheap” stocks. A simple screen for companies trading at under 15x price-to-earnings (P/E) will invariably produce a large output. And you likely won't be much closer to finding an undervalued stock. Most of these companies are cheap for good reason.
The key is to find stocks that are cheap because they are misunderstood and you believe their earnings will accelerate and/or the market will “re-rate” them higher—that is, afford them a higher multiple. You must do this while avoiding so-called “value traps,” i.e., stocks that appear cheap but are discounted for a reason. They may even be overpriced due to fundamental or structural challenges that threaten future earnings.
Alternatively, you may find stocks that do not appear cheap on a multiples basis or vs. peers, but have a clear path to outperformance. For example, a high-growth company trading at 20x P/E may prove more interesting than a slower-growth peer trading at 17.5x. Assuming the 20x company is growing earnings at 25% per year, its implied P/E off Year 3 earnings is only 10x. Meanwhile, assuming the 17.5x peer is growing earnings at 10% per year, its Year 3 P/E is 13x and therefore more expensive.
Often, the bottom-up approach is combined with top-down to design an effective valuation screen. For example, you may look for cheap stocks in a sector undergoing a major secular shift or cyclical rebound.
Common valuation screens include:
- Trading at a low absolute or relative value – a company whose valuation looks compelling given the business fundamentals and outlook. This may be on a relative basis vs. peers or its own historical levels (e.g., a significant discount to its 52-week or all-time high). Valuation is typically measured and compared on the basis of trading multiples. Key multiples include any combination of P/E, price-to-free cash flow (P/FCF),5 price-to-book (P/B), and enterprise value-to-EBITDA6 (EV/EBITDA), among others.
- Compelling valuation relative to growth – the P/E-to-growth ratio (PEG) is key here. Defined as P/E ratio divided by earnings growth rate, it is designed to measure a stock's value proposition relative to its growth prospects. A lower PEG ratio may indicate that a stock is undervalued. As discussed above, a stock with a 20x P/E ratio and 25% earnings per share (EPS) growth (PEG of 0.8x) should be more compelling than one at 17.5x and 10% growth (PEG of 1.75x).
- High returns with low valuation – return on capital metrics, most notably return on invested capital (ROIC),7 are a key indicator of quality. The ideal opportunity combines high and improving returns with a low current valuation. High returns can be put to work by investing in growth projects and/or returning capital to shareholders.
Financial Performance
A company's financial performance should be reflected in its share price, for better or worse. Accelerating top and bottom-line growth rates should be rewarded with strong share price performance. The opposite should hold true for decelerating trends.
The same rules apply to other key financial metrics, such as profit margins, FCF generation, and return on capital. Sometimes, however, the market fails to adequately recognize improving financial performance. Similarly, underperformance on a relative basis—e.g., lower margins or returns vs. peers—should be explored as a potential turnaround opportunity.
Capital structure typically goes hand in hand with financial performance. Here, you want to focus on the amount and cost of a company's debt, when the debt comes due, and the ability to service interest payments. As with operating performance, strengthening credit statistics can help drive the stock price.
The above-mentioned metrics need to be viewed on both an absolute and relative basis vs. peers. Screening services provide countless variations for identifying financial performance trends.
Common financial performance screens include:
- Growth – arguably the most important driver of valuation. Consistent growth in sales and earnings is a classic indicator of quality. These so-called earnings compounders that deliver year-in and year-out are the traditional stock picker's bread and butter, and tend to receive a premium valuation. While all growth is celebrated, organic is preferred over M&A-driven.
- Margins – expanding or declining profit margins are telltale signs of company performance. Margin expansion tends to indicate pricing power, cost control, and power over suppliers. Margin erosion can be a warning sign of key business challenges. Investors focus on gross profit, EBITDA, operating profit (EBIT),8 and net income margins.
- FCF Generation – professional investors focus on a company's ability to generate cash, which can be used to fund organic growth projects, M&A, capital return to shareholders, or repay debt. Companies that convert a meaningful percentage of net income into FCF are held in high regard. Key metrics include FCF conversion (FCF-to-net income or EBITDA) and FCF margin (FCF-to-sales).
- Return Metrics – measure a company's ability to provide earnings (or returns) to capital providers. These ratios employ a metric of profitability (e.g., EBIAT, NOPAT, or net income) in the numerator and capital (e.g., invested capital, total assets, or shareholders' equity) in the denominator. Return metrics measure how efficiently management deploys capital. Ideally, companies should have an ROIC that exceeds its cost of capital (see Chapter 4), which indicates an ability to deliver excess returns to shareholders.
- Capital Structure – helps drive stock price performance in many ways. Balance sheet capacity can be tapped to fund growth projects, M&A, or return capital. It also provides support and liquidity during difficult times as equity investors learned during the 2008/09 financial crisis (a.k.a., the “Great Recession”). Key metrics include debt-to-EBITDA (“leverage”) and EBITDA-to-interest expense (“coverage”). Improving credit metrics may be due to strengthening financial performance and/or debt repayment.
Mergers & Acquisitions
M&A refers broadly to the purchase and sale of businesses. The decision to buy all or part of another company is driven by numerous factors. Paramount among these is the desire to grow or improve an existing platform through new products, customers, end markets, or geographies. M&A may also take the form of expansion into entirely new business lines. Growth through M&A often represents a cheaper, faster, and safer option than building a business from scratch.
An M&A-centric approach to identifying investment opportunities can be compelling. Screening for sizable new deals is a good place to start. This often leads you to identify sectors “in play,” where both potential targets and acquirers may be interesting opportunities. For potential targets, investors focus on natural take-out candidates, especially those trading at 52-week lows or cheap multiples vs. peers. For acquirers, proven management teams with strong M&A track records stand out, especially those with an abundance of cash or low leverage.
Before we dive deeper, a quick disclaimer: M&A has a decidedly mixed track record over the years. Typical traps include over-paying, misguided strategic bets, incompatible cultures, over-leveraging the balance sheet, and poor integration. Each of these individually can be value-destroying, and together they are devastating. So, proceed with caution.
Specific strategies centered on M&A activity include:
- Transformational Deals – acquirers undertaking transactions that are sizable, strategic, and synergistic. Typical Screens: recently announced or closed deals representing at least 10% of the acquirer's pre-deal value
- Sector Consolidation – sectors in play where both potential target and acquirer share prices can benefit. Typical Screens: sector deal volumes, both number and size of deals
- Natural Targets – companies with logical strategic or PE buyers. Typical Screens: pure plays in combination with low valuation multiples or trading near a 52-week low
- Proven Acquirers – management teams with successful track records of consummating accretive transactions. Typical Screens: active acquirers in terms of volume and dollar amount of deals, often in combination with key balance sheet metrics such as large cash balances or low leverage
Transformational Deals
Transformational deals may be defined by size or strategy, often both. These deals materially move the needle for the acquirer in terms of sales and earnings, as well as strategic direction. They also tend to be highly synergistic due to cost savings and growth opportunities. In some cases, they may result in a valuation re-rating where the acquirer is rewarded with a higher multiple.
You should screen for newly announced or closed deals above a certain threshold. Then review each acquirer's press release and investor presentation. These resources typically provide a deal description, synergy amounts, earnings accretion (or assumptions to perform the calculation), and strategic benefits of the transaction.
Regardless of the level of disclosure, you ultimately must make your own assumptions and judgments on the deal's financial and strategic merits. These will be reflected in your earnings accretion / (dilution) model that analyzes the quantitative effects of the transaction (see Chapter 4). Investors applaud deals that are materially accretive to EPS or FCF/S, ideally by 10% or more on a pro forma (PF) basis.
In August 2016, ski resorts operator Vail Resorts (MTN) purchased competitor Whistler Blackcomb (WB CN) for $1.2 billion (13x EV/EBITDA, or 9x on a synergies-adjusted basis). This was a sizable transaction against MTN's then $5.8 billion enterprise value. Reflective of synergies, the deal was comfortably accretive to EPS.
Whistler was considered one of the most iconic resorts in North America and had a long history of healthy financial performance. The deal expanded Vail's already strong network of mountains into the Canadian market, which buffered some of the seasonality of the overall business given Whistler operates year-round.
A combination of immediate revenue and cost synergies, increasing adoption of season passes, and sharing of best practices was applauded by the market. MTN increased 8% upon deal announcement. Two years later, Vail shareholders had doubled their money. Clearly, this transformational deal delivered transformational returns.
Sector Consolidation
A sector in the midst of consolidation provides fertile ground for M&A-themed ideas. Share prices for both potential targets and acquirers may creep up in anticipation of value-enhancing transactions. This creates a potential win/win situation. Ideally, you want to start investing during the early stages of the consolidation phase to maximize returns.
We recommend screening for newly announced or closed deals and then sorting them by sector. A sector with heavy activity would suggest a bona fide consolidation play. The next level of analysis is to find those sector players most likely to transact. This requires a deep understanding of natural targets and acquirers.
A typical narrative might involve a proven acquirer with a stated M&A agenda and a large cash balance. It may also have just lost out on buying someone else and is keen to find a new target. You can then perform high level analysis on fit and synergies with a variety of potential targets.
Clear targets would have an attractive valuation and strategic fit for potential suitors. Social and governance issues are also important. Does the target company have an activist shareholder? Is its Board and management team likely to support a sale of the company?
The global brewing sector presents an interesting case study. In the early 2000s, the industry was highly fragmented with the top five players holding 25% market share. A decade later, after over a dozen sizable deals, their combined market share was well over 50%. Along the way, shareholders for both targets and acquirers made outsized returns. Notable deals included InBev's $61 billion acquisition of Anheuser-Busch in 2008 and SABMiller's acquisition of Foster's for $12 billion in 2011. These two global brewing giants then combined in 2016 to form a $200 billion market cap company.
Natural Targets
A classic M&A investment strategy centers on finding natural takeover candidates. Companies with large competitors looking to expand are at the top of the list. Ditto for companies with unique assets or technologies that would provide a clean plug-and-play for an industry peer.
A clear target might be a small pure play with a modest multiple or trading near a 52-week low. A CEO near retirement with a generous exit package would lend further credibility.9 Or, perhaps the company is cheap enough or generates enough FCF to attract interest from a PE firm.
It takes two to tango, however. So, you also need to understand the potential buyers. Are the logical buyers in acquisition mode? Are their balance sheets strong enough for sizable M&A? Is a PE buyer likely to be interested?
While backing proven acquirers can be an effective strategy, the target is typically the safer bet upfront. Historically, the takeover premium for public companies has averaged 30% to 40%. In some cases, including bidding wars or hostile takeovers, the premium is much higher. Correctly picking a takeover candidate can provide an outsized return in a short period of time.
Former investment bankers have a key advantage in this regard as they understand M&A mechanics, dynamics, and motivations.
In March 2016, Valspar (VAL) was acquired by Sherwin-Williams (SHW) for $113 per share in an all-cash deal to create the largest global player in paints and coatings. This represented a 41% premium to VAL's share price, and a 28% premium to its all-time high. Including the assumption of debt, the total purchase price was $11.3 billion (15x EV/EBITDA, or 11x on a synergies-adjusted basis).
As the #5 global coatings producer in an industry where scale matters, there were multiple logical acquirers for Valspar. Its brand portfolio, strong Asia-Pacific exposure, and history of innovation and technological expertise further enhanced its attractiveness. In short, the clues were all there for investors looking to back a natural takeover candidate.
For Sherwin-Williams, the deal diversified its customer base and geographic exposure, while adding complementary products and capabilities. From a financial perspective, the transaction was highly synergistic and 20% accretive to EPS. SHW shareholders were handsomely rewarded with a 115% return from announcement date through the end of 2019, more than double that of the S&P 500 over the same period.
Proven Acquirers
Proven acquirers refer to companies with demonstrated track records of consummating accretive, value-enhancing deals. In good times, M&A augments underlying solid performance. In difficult times, M&A helps offset sales and earnings headwinds.
Proven acquirer stocks often trade up when they announce a deal. These companies feature highly competent CEOs and in-house M&A professionals, often former investment bankers. A typical playbook would be to acquire peers with lagging margins that can be improved under new management. Proven acquirers have a time-tested integration playbook that is part of the corporate DNA. This enables them to successfully execute and integrate, delivering additional value above and beyond the purchase price.
Orbia Advance Corporation SAB (ORBIA), formerly Mexichem SAB, a global chemical company based in Mexico City, Mexico began a series of strategic acquisitions in early 2007. As part of its initiative to grow its downstream business and diversify geographically, the company acquired Grupo Amanco, AlphaGary, Wavin, and Dura-Line over the next several years. This M&A-driven strategy proved highly profitable for shareholders. By fall of 2014, Mexichem's share price had increased from approximately P$7 to P$56, an eight-fold return in eight years.
So, what's the catch? Is investing in successful serial acquirers too good to be true? Well, there are several risks. To start, this strategy requires a large pipeline of actionable targets. It is also dependent upon the availability of attractive debt financing markets. Furthermore, reliable analysis of serial acquirers' underlying financial performance may prove challenging given the various moving pieces.
Lastly, a proven acquirer's stock may already be priced for perfection. Investor expectations for continued successful deals may be sky high, setting the stage for disappointment.
Spin-offs & Divestitures
A spin-off occurs when a parent company (ParentCo) IPOs or distributes shares of one of its business segments (SpinCo) to existing shareholders. Post-spin, the new SpinCo is independent from ParentCo with its own management team, Board of Directors, and shareholders. Spin-offs are headline news items in the financial press and, hence, easy to screen for.
Spin-offs can be fruitful for stock pickers. After all, the premise for separating the businesses is to unlock shareholder value. The implied values of the individual businesses should be greater than the existing consolidated ParentCo. Otherwise, why go through the expense and hassle of the spin-off? The same holds true for the sale or divestiture of non-core or underperforming businesses.
Post-separation, both ParentCo and SpinCo may present meaningful upside potential and need to be assessed independently. For ParentCo, shedding a non-core, neglected business may re-rate the stock. For SpinCo, which is often a lower-quality or capital-starved business, there is perhaps even greater opportunity. Typically, SpinCo's stock comes under immediate selling pressure as the shareholder base turns over. Larger asset managers tend to shy away from smaller illiquid stocks, so they punt them.
Furthermore, the valuation of the newly independent SpinCo tends to suffer from a general lack of information and interest. Newly public entities often trade at a discount due to being unproven with no independent track record. They also tend to have limited research coverage at the onset, particularly if SpinCo is a small-cap stock. These attributes—unwarranted selling pressure, valuation discount, and information asymmetry—can create a compelling scenario.
For divestitures, the opportunity lies with ParentCo. After all, the chief motivation for the sale of a non-core or underperforming business is to unlock value. This is classic “addition by subtraction.” Divesting a lesser business should lend to a multiple re-rating through an improved product mix. The allocation of sale proceeds towards higher value initiatives or debt paydown should also be a positive for the share price.
In July 2010, Northrop Grumman (NOC) announced it was exploring the sale or spin of its naval shipbuilding business, now trading as Huntington Ingalls (HII). At the time, the industry backdrop was unfavorable given expectations for defense spending cuts. NOC was also trading at a large discount to peers.
Fortunately, both NOC and HII had strong positions on “mission critical” platforms that were difficult for the government to cut. At spin announcement, NOC's share price was $50. By the end of 2019, it had reached $344. Plus, those NOC shareholders who held onto their HII stock distribution realized over $40 of additional value. This equated to a total implied value of nearly $400 per share, representing a nearly 600% return, or 20%+ on an annualized basis.10
Restructurings & Turnarounds
Restructuring situations refer to companies that have emerged from bankruptcy or a similar reorganization event. The owners of these companies are typically former debt and equity holders, as well as new investors from credit and distressed funds. Many of them likely purchased the company's debt during financial distress and gained ownership once that debt was converted to equity. As such, they have a low cost basis and are natural sellers seeking to monetize their holdings via a sale or IPO/relisting.11
Upon relisting, these companies tend to be neglected or misunderstood by the market given their former troubles. In this sense, they are like spin-offs except with a checkered past. And, like spin-offs, they are easy to screen for and often present intriguing investment opportunities.
Many of these companies have a solid underlying business. The restructuring event may have been triggered by an imprudent debt load, a one-time shock/event, or mismanagement. The solution to the problem typically depends on the cause. An overly aggressive capital structure can be cured by a cleaned-up balance sheet. An uncompetitive cost structure may be fixed with a comprehensive cost-cutting program. Poor execution can be rectified by new management. A fundamentally flawed business model, however, should be treated with extreme caution.
Turnaround situations also exist outside of formal bankruptcies and restructurings. In a broader sense, any troubled company represents an opportunity to dig in and explore the potential for dramatic improvement. Many turnarounds are led by a new CEO or active shareholder. An outsider can often provide fresh perspective and bold leadership to implement change.
Tropicana Entertainment (TPCA), the casino operator, is a prototypical restructuring and turnaround story. Columbia Sussex purchased the company in January 2007 for $2.8 billion, loading it up with debt heading into the Great Recession. Less than a year later, Tropicana was stripped of its license in Atlantic City by NJ state regulators due to proposed major cost-cuts and layoffs that were deemed excessive. By May 2008, Tropicana filed for bankruptcy, forced to fold its bad hand of deteriorating market conditions, high leverage, and operational missteps.
And yet, the iconic Tropicana brand and its casino properties never died. In many ways, this was a classic case of “good company, bad balance sheet.” During Chapter 11, the company shed nearly $2.5 billion of debt and successfully renewed its gaming licenses. In March 2010, Tropicana emerged from bankruptcy in a $200 million deal backed by Carl Icahn. By November 2010, Tropicana relisted on the OTC Markets (over-the-counter) at $14 per share.
Over the next several years, Tropicana made major investments in new and existing assets, including renovations and upgrades, hotel room improvements, and additional resort amenities. Tropicana also consummated a major M&A transaction in 2014, buying Lumière in St. Louis, MO for $260 million. By 2018, EBITDA had improved from roughly $45 million upon bankruptcy emergence to nearly $200 million.
The story concluded in April 2018 when Tropicana agreed to sell its real estate assets to Gaming and Leisure Properties (GLPI) and merge its gaming and hotel operations into Eldorado Resorts (ERI) for a total of $1.85 billion. This implied a $73.50 share price, equating to a 425% return since the relisting, or 23% on an annualized basis.
Another notable turnaround story centered on Charter Communications (CHTR). In December 2011, Tom Rutledge was announced as the new CEO, inheriting a recently-bankrupt, capital-starved cable company facing competitive pressures. Rutledge came from industry peer Cablevision (CVC) where he drove sector-leading operating metrics, took FCF from approximately −$375 million to +$685 million, and delivered annualized returns in the high teens. CHTR's share price reacted favorably to the news of his hiring, increasing 5% that day.
Under Rutledge, Charter immediately embarked on a capital investment program to improve its network. The company also simplified its pricing plans and focused on improving customer service. Within a year, CHTR announced a highly accretive bolt-on acquisition, followed by the simultaneous acquisitions of Time Warner Cable and Bright House Networks roughly two years later. Investors who identified the opportunity in Charter on Day 1 were rewarded with a nearly 675% return, or approximately 30% annualized through 2019.
Like restructurings and bankruptcies, potential turnarounds must be handled with extreme care. The Tropicana and Charter success stories are the exception, not the norm. Many troubled companies never turn around. In fact, their troubles often intensify and result in chronic under-performance and even bankruptcy.
Buybacks & Dividends
Efficient capital allocators tend to outperform peers over time and create catalysts when they announce substantial buyback authorizations or large dividends. Lesser companies might hoard cash or embark on undisciplined M&A in the absence of attractive internal growth projects.
For interesting potential buyback situations, screen for companies that authorize large share repurchase programs (e.g., >5% of market cap). This may signal that management believes their stock is undervalued. At the very least, it conveys confidence in the company's prospects. Of course, the mere announcement of such a program does not signal an “all clear” to pile in.
You need to review management's buyback track record. Has the company historically repurchased stock at attractive prices? Has it been a meaningful value creation lever? Or, was it simply a mechanism to meet earnings expectations/guidance12 or offset dilution from employee stock compensation?
First-time buyback announcements require particular scrutiny. Will the company actually follow through on the authorization? Does management believe the stock is undervalued or is it a signal that they are unable to find attractive growth projects? Beware the latter as it may portend slowing earnings or future multiple compression.
Another buyback screen centers on identifying companies with sizable share count reductions over set periods of time (e.g., prior three or five years). Companies with a successful share repurchase track record tend to be rewarded.
Sirius XM (SIRI), the satellite radio company, has created substantial shareholder value over time through systematic buybacks. From 2013 through 2018, SIRI repurchased $10.8 billion of stock, or $1.8 billion per year on average. To put this in perspective, SIRI's market cap was only $15 billion when its buyback program was originally announced in December 2012. This aggressive return of capital helped Sirius XM grow FCF/S at a 20%+ CAGR.13 Correspondingly, SIRI's share price surpassed $7 by mid-2018 from a starting point of $2.79 in late 2012.
For dividends, common screens center on stocks with yields greater than a target threshold, e.g., 2.5%. Dividend yield is defined as a company's annual dividend per share divided by its share price. A company with a $50 stock price and $1.25 in dividends per share has a 2.5% yield. A low dividend yield (e.g., 1% or lower) and no clear path to a substantial increase is not exciting. Consistent and growing dividend stocks, on the other hand, are revered. Companies that have raised dividends for at least 25 consecutive years are known as “dividend aristocrats.”
While targeting proven dividend champions is a common strategy, there is opportunity on the other end of the spectrum. Namely, cash rich or underleveraged companies that have refrained from such activity in the past. These companies merit attention upon new dividend initiations or sizable increases in payout ratios. Beware, however, companies whose annual dividend payment consistently exceeds FCF, especially those who fund the gap with incremental debt.
Initial Public Offerings
IPOs represent a company's introduction to public equity investors. As such, IPO candidates tend to be relatively unknown in terms of the strength of their business model and financial performance. Furthermore, new IPOs do not receive equity research coverage until after an initial 10-day “quiet period.”14 This information and time gap provides an opportunity for potential investors to find true differentiation.
Moreover, IPOs often price at a significant discount to the company's implied market value vs. peers (typically 15% or more). The discount affords additional cushion for investors to “get the story right.”
The information mismatch inherent in IPOs is greatest for candidates without an obvious public comparable. In these cases, a little extra work can pay off as others avoid an unknown entity lacking a clear public valuation marker. Of course, this risk is real as the market has not yet “spoken” on how such companies should be valued.
Returning to Delphi from the Intro Chapter, the company's November 2011 IPO price of $22 implied a 2013E15 EV/EBITDA of 3.5x, P/E of 5x, and FCF yield of nearly 15%. This represented a substantial discount to other secular grower auto parts suppliers, who were trading at roughly 6x EV/EBITDA, 11x P/E, and a 7.5% FCF yield, respectively (see Chapter 4, Exhibit 4.3). Rather, the market was pricing Delphi in line with so-called production-linked suppliers, whose fortunes were tied largely to auto unit volumes.
As Delphi performed, the market began to recognize its powerful secular growth dynamics tied to new product adoption, increasing content per vehicle, and accelerating profitability. Accordingly, its bankruptcy stigma began to fade and new investors entered the stock. Prior to the spin transaction in late 2017, Delphi's share price surpassed $100. Its EV/EBITDA, P/E, and FCF yield had improved to approximately 12x, 18x, and 4%, respectively. We give more color on how this transpired in the chapters to follow.
Insider Buying & Ownership
A company's senior management should have better insight into their business and its prospects than anyone else. That is their job, quite literally what they are paid to focus on all day, every day. Therefore, management purchases and sales of company stock may signal possible entry and exit points for investors. As Peter Lynch pointed out: “Insiders might sell their shares for any number of reasons, but they buy them for only one—they think the price will rise.”
Changes in ownership by a U.S. public company's officers and directors require the filing of a Form 4 with the SEC. Your stock alerts should inform you when these hit the wire. Sizable purchases and sales also get picked up by major financial news and business publications. Insider purchases are traditionally a bullish signal, while large sales may portend trouble ahead.
J.P. Morgan's (JPM) CEO Jamie Dimon has been particularly adept at buying his company's stock. In January 2009, he purchased 500,000 shares of JPM at an average price of $23, equating to $11.5 million. His purchase in the midst of the global financial crisis was front-page business news, signaling confidence in JPM shares after they fell more than 50% over the prior two years. In the twelve months following Dimon's purchase, the stock increased 90%. Those who were paying attention and followed his lead would have nearly doubled their money in a year.
Likewise, in July 2012, amidst Eurozone sovereign concerns, Dimon again injected personal capital into JPM, buying an additional 500,000 shares at $34 for $17 million. A year later, JPM was up 63%. Then, in February 2016, with the market retreating on China concerns and plunging oil prices, Dimon again stepped in. He bought another 500,000 shares at $53 for $26.5 million, reassuring JPM shareholders and the broader market along the way. Twelve months later, the stock was up 64%. By the end of 2019, JPM's share price was nearly $140. Investing behind Dimon's insider buying would have proven highly profitable.
A related strategy centers on backing companies whose CEOs have significant stock ownership and stand to benefit materially from share price appreciation. This includes CEOs who have options with exercise prices at substantial premiums to the current share price.
The notion that CEO compensation and shareholder rewards should be closely aligned is intuitive. First popularized by economist Michael Jensen in the mid-1970s, a higher percentage of executive compensation in the form of stock has become commonplace. This has replaced the old model where CEOs were positioned to receive a large cash salary and bonus with relatively little “skin in the game.”
Tracking Successful Investors & Activists
The 13-Fs for a select group of investors can be insightful for sourcing ideas. Closely-watched portfolios include those of Warren Buffett of Berkshire Hathaway, David Abrams of Abrams Capital, Stan Druckenmiller of Duquesne, Andreas Halvorsen of Viking Global, Seth Klarman of The Baupost Group, Nelson Peltz of Trian Fund Management, and Paul Singer of Elliott Management, to name a few. These investors have outstanding long-term track records and are known for performing deep due diligence on their stock positions.
Keep in mind, however, that 13-Fs are filed with a 45-day lag after quarter end. For some of these holdings, the optimal entry point may have passed by the time of disclosure. Or, the positions may have even turned over by the filing date. Therefore, you may want to focus on recent investments where the share price has not yet appreciated.
When a person or group accumulates an ownership stake of greater than 5% in a company, they are required to file a Schedule 13-D within ten days, or 13-G within 45 days. A 13-D represents an active position whereby the holders plan to engage in strategic discussions with management. A 13-G represents a passive stake. Both filings indicate high conviction in a stock's upside potential.
Activist investors are change agents and target situations accordingly. In some cases, they accelerate transformational events that may have been identified long ago by existing investors. Therefore, these same shareholders typically cheer a credible activist's entrance. Activists also tend to attract new investors, which provides an immediate share price pop. Long-term upside is determined by the activist's success in initiating change as well as the results of the strategic moves themselves.
In April 2013, Microsoft (MSFT) was trading below $30 per share when activist investor ValueAct Capital confirmed it had taken a $2 billion stake. While this represented less than 1% of the shares outstanding, it was clear that ValueAct was intent on driving change. On the day the stake was announced, MSFT rose over 3%, and then climbed to nearly $35 by the end of May.
Prior to ValueAct's entry, Microsoft's share price had been largely stagnant since 1998. Concerns were percolating over CEO Steve Ballmer and the company's strategy, most notably a misguided foray into devices and falling behind Apple and Google in mobile computing. By August 2013, Ballmer announced that he would retire and ValueAct secured a Board seat. This was the beginning of more dramatic changes on the horizon …
In September 2013, Microsoft authorized a new $40 billion share repurchase program vs. a then $450 billion market cap, and raised its dividend by over 20%. By February 2014, Ballmer was replaced by 20-year Microsoft veteran Satya Nadella. In the coming years, Nadella would impart sizable cultural and strategic changes, including less emphasis on traditional desktop software and more focus on cloud, enterprise, and mobile.
Nadella's strategy reinvigorated Microsoft's financial performance. A combination of strong commercial cloud growth, improved product mix, and transitioning the enterprise business towards a subscription model was applauded by investors. By the time ValueAct exited their position in the first quarter of 2018, MSFT's share price was above $90, or 200% higher.
Of course, tracking other investors requires adhering to the usual cautions. Beware the groupthink that may result in ill-fated “hedge fund hotels.” Some investors shy away entirely from following others, seeking to avoid “crowded” trades. For those being followed, their positions may benefit from copycat demand.
Top-Down Approach
The top-down approach to investing targets stocks expected to benefit from macro or secular tailwinds. These trends are meant to drive sustained earnings growth and valuation multiple expansion. Ideally, they also protect the core business against adverse economic conditions and market shocks. Even during stormy times, you want the wind blowing at your back, not in your face.
The power of macro themes is evident every day where statements and actions by central banks move markets. Investors focus particularly on the U.S. Federal Reserve (“Fed”), European Central Bank (ECB), Bank of Japan (BOJ), and People's Bank of China (PBOC). Macro factors underscored the long bull-run following the Great Recession. Low interest rates and easy monetary policy helped drive stocks to record levels.
Secular themes are abundant in an age of fast-moving change. This applies to old-world and new-world sectors alike. A top-down investor might mine the auto sector for ideas related to electrification and autonomy of vehicles. Similarly, 21st century secular themes around e-commerce, the cloud, the sharing economy, and social media have proven highly rewarding.
Much of top-down idea generation stems from old-fashioned research. Read and watch traditional news sources, including financial, economic, and sector-specific media. Professional top-down investors may spend weeks or months researching themes including field trips, interviews, and discussions with specialists.
Acquiring the proper top-down skill set tilts toward the experiential and qualitative. Masters of macro investing have honed their skills through direct experience and familiarity with prior cycles and market movements. The same holds true for investors who focus on secular shifts. That does not mean, however, that key top-down pillars cannot be taught.
To start, you can research and study a great deal about the categories in Exhibit 1.3:
EXHIBIT 1.3 Top-Down Approach
Top-Down Approach
- Cycles, Booms & Busts
- Economics & Geopolitics
- Secular Shifts
- Industry Inflections
- Cycles, Booms & Busts – the ability to identify clear cyclical winners and losers, as well as out-of-favor sectors that may be on the verge of a rebound. Historical perspective and familiarity is particularly helpful here.
- Economics & Geopolitics – understanding the effect on stocks from Fed policy, interest rates, consumer data, unemployment levels, manufacturing data, currency exchange rates, domestic politics, and global geopolitical events
- Secular Shifts – companies or sectors that may be the beneficiaries or victims of anticipated changes in technology, consumer preferences, demographics, industry dynamics, or regulatory regimes
- Industry Inflections – sector metrics and how they move through various cycles. This also relates to commodity prices such as oil, copper, and iron ore that affect certain industries more than others.
Cycles, Booms & Busts
A keen understanding of business cycles is critical for uncovering opportunities. The recognition of familiar patterns and interrelationships helps you identify optimal entry and exit points. At a minimum, this means recognizing whether the market is early-, mid-, or late-cycle. You then invest accordingly.
Cyclical plays tend to share common qualities that you can use to your advantage. Multiples are often higher early-stage, gradually reverting to the mean, and contracting later-stage as earnings mature. This is tied to future earnings growth expectations—the higher the expected earnings growth, the higher the multiple.
In some cases, “getting the cycle right” supersedes all your bottom-up work. A stock with great financials and a strong management team might seem exciting, but it won't work if you're fighting the cycle. Even blue chips got hammered during the dot-com bubble burst in the late 1990s and the Great Recession of 2008/09.
Ideally, you want to move early in the cycle. This also applies to cyclical patterns within sectors or regions/countries. For example, coming out of the Great Recession, North American auto production was well below prior peak levels. Auto production levels had even dipped well below vehicle scrappage (see Exhibit 1.4), a clear indicator of pent-up demand. Cyclical tailwinds were blowing in support of the auto sector, which was a major contributor to the Delphi investment thesis in 2011. Of course, this same favorable cyclical breeze could also shift in the opposite direction—see Post-Mortem.
As with sectors, you can find interesting cyclical plays related to countries or regions. While the global economy has become increasingly correlated, there are clear outperformers and underperformers at any given time. Emerging markets have their own cadence vs. traditional developed markets. There may also be dramatic differences in growth and outlook between developed markets such as the U.S., Europe, and Japan.
EXHIBIT 1.4 N. American Auto Production vs. Vehicles Scrapped
(vehicles in millions)
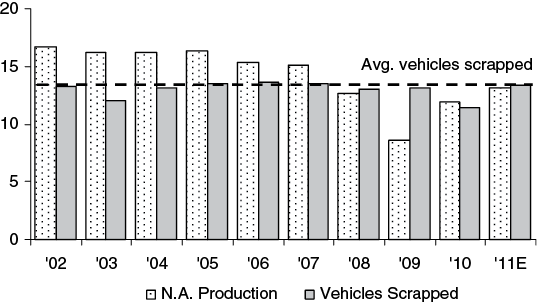
Source: IHS Automotive and Barclays Capital
Economics & Geopolitics
Reading the tea leaves on key economic and geopolitical data is yet another tool for finding ideas. This data may paint a broad brush and overshadow company-specific information. The bullish trade of the century centered on interpreting dovish monetary policy from global central banks post-Great Recession as a green light. The Fed mandate to promote full employment and control inflation led to low interest rates, creating a highly favorable environment for stocks.
Beyond interest rates, you need to understand employment data, wage statistics, inflation, GDP growth, consumer confidence, and tax policy. To some extent, they are interrelated. For example, weak wage data or underemployment would suggest continued dovish monetary policy. Accelerated inflation or wage growth, on the other hand, might signal Fed tightening ahead. Similarly, GDP growth, consumer confidence, and manufacturing output data are informative in their own right, while also providing insight on Fed (in)action. Tying all these macro data points together enables you to invest accordingly.
Domestic and global geopolitical events, such as major elections, regime changes, and military conflict, also need to be monitored closely. Global interconnectivity is a reality as are cross-border ramifications, such as trade/tariff policies, population flows, and economic alliances. The U.S. stock market is not immune to events in China, Europe, and key emerging markets, and vice versa.
In February 2016, many high-quality companies traded off materially due to deep concerns about the slowing Chinese economy. Later that year, they rebounded dramatically. Global dislocations often create compelling entry points. This is especially true for quality stocks whose fundamental thesis remains intact. The so-called Brexit vote in June 2016 also created a temporary market dislocation. Stocks traded off meaningfully across the board, only to snap back shortly thereafter.
Secular Shifts
Secular shifts create sustainable tailwinds for those stocks on the right side of the breeze. Investors are constantly on the lookout for seismic changes in technology, consumer preferences, and demographics. This extends across all industries and geographies. So, how do you identify these shifts?
A large part of the secret sauce involves keeping to the basics. As noted earlier, successful investors pay attention to what is going on in the world. They consume news voraciously, and are observant in everyday life. For example, your online shopping has increased exponentially. You now book your travel online. When purchasing a car, you are offered a whole slew of new electronic options. Who benefits and who suffers? Simple observations like these can guide new stock ideas.
On the other hand, beware the secular buzzsaw. Look no further than Amazon and the e-commerce phenomenon, which has upended brick-and-mortar retail. It's largely a zero-sum game with big winners taking share from eventual losers.
Timing is also key. Some secular shifts may take years to play out. So while your thesis may be right, your timing may be off. What seems like a tidal wave may prove to be a mere ripple. In the interim, your stock picks may stagnate or even falter.
Even worse, the secular play may be a false positive. A company's great idea and accompanying product may attract a strong competitive response. There are countless examples of upstarts being squashed by well-capitalized fast followers.
So, back to secular winners. Early investors in digital advertising, smart phones, and social media earned outsized returns on companies such as Alphabet, Apple, and Facebook. Similarly, those who recognized the sea change in video consumption and backed Netflix reaped the benefits. Over the next decade, investors will seek to figure out the best way to play various structural shifts, among them the “sharing economy,” autonomous driving, and artificial intelligence.
Industry Inflections
Some investors specialize in specific sectors. Consumer, energy, healthcare, industrials, and technology come to mind. These specialists draw upon considerable expertise, networks, and databases to identify trends and assess prospects. As with any specialization, this type of insight provides advantages vs. generalists.
For any given sector, certain data moves the corresponding stocks disproportionately to the overall market. Auto sales dictate how auto stocks perform, retail sales affect selected consumer names, and housing starts drive homebuilders. They also tend to have their own cycles, which correlate to the broader economy in varying degrees.
Ideally, you want to find sector plays with both macro/cyclical and secular tailwinds. Let's look at the U.S. cable industry for the 2010 to 2017 period. Cable typically thrives in an expansionary economy given its ties to discretionary spending and housing. It is also relatively recession-resistant given its subscription-based model and critical-needs products.
Early 2010 represented an inflection point for the cable industry as secular trends aligned with the broader macro recovery (see Exhibit 1.5). Previously, companies like Charter Communications (CHTR) and Comcast Corporation (CMCSA) were engaged in bitter hand-to-hand combat with traditional telecom companies such as AT&T (T) over new internet subscribers. Cable started to emerge as the clear winner, however, due to superior network reliability and faster download speeds at a better price. Early investors in cable rode favorable trends for several years while telecom investors underperformed.
More broadly, your industry analysis helps allocate opportunities on a portfolio basis. You can identify sectors with cyclical, macro, secular, or structural tailwinds, while avoiding those with headwinds. For example, you may see dynamic growth in certain new media or tech segments and overweight accordingly, while avoiding or even shorting the donor sectors.
EXHIBIT 1.5 Cable vs. Telco Share of Broadband Subscriber Adds
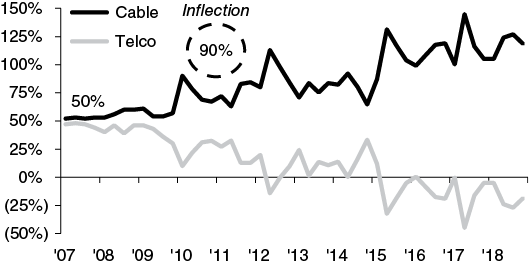
Source: Company filings
Key Takeaways
- Idea generation takes many forms, from reading industry standards to everyday life observations to more sophisticated screening tools
- Bottom-up focuses on the fundamentals of individual companies, while top-down seeks opportunities based on macro or secular themes
- Top-down focuses on economic and geopolitical drivers, as well as cycles and secular shifts
- Look for stock ideas among undervalued companies, M&A situations, spin-offs, IPOs, restructurings & turnarounds, and buybacks & dividends, among others
- Most “cheap” stocks are cheap for a reason—the key is to find stocks that are cheap because they are misunderstood by the market
- An M&A-centric approach can take many forms—transformational deals, sector consolidation, natural targets, and proven acquirers
- Ideally, you want to find sector plays with both macro/cyclical and secular tailwinds