
Top texture: © Laguna Design / Science Source;
CHAPTER 17: Prokaryotic Transcription

Chapter Opener: © Phantatomix/Science Source
17.1 Introduction
Transcription produces an RNA chain identical in sequence with one strand of the DNA, sometimes called the coding strand. This strand is made 5′ → 3′ and is complementary to (i.e., it base pairs with) the template, which is 3′ → 5′. The RNA-like strand therefore is called the nontemplate strand, and the one that serves as the template for synthesis of the RNA is called the template strand, as shown in FIGURE 17.1.

FIGURE 17.1 The function of RNA polymerase is to copy one strand of duplex DNA into RNA.
RNA synthesis is catalyzed by the enzyme RNA polymerase. Transcription starts when RNA polymerase binds to a special region, called the promoter, at the start of the gene. The promoter includes the first base pair that is transcribed into RNA (the start point), as well as surrounding bases. From this position, RNA polymerase moves along the template, synthesizing RNA until it reaches a terminator sequence, where the transcript ends. Thus, a transcription unit extends from the promoter to the terminator. The critical feature of the transcription unit, depicted in FIGURE 17.2, is that it constitutes a stretch of DNA used as a template for the production of a single RNA molecule. A transcription unit may encode more than one gene or cistron.

FIGURE 17.2 A transcription unit is a sequence of DNA transcribed into a single RNA, starting at the promoter and ending at the terminator.
Sequences prior to the start point are described as upstream of it; those after the start point (within the transcribed sequence) are downstream of it. Sequences are usually written so that transcription proceeds from left (upstream) to right (downstream). This corresponds to writing the mRNA in the usual 5′ → 3′ direction.
The DNA sequence often is written to show only the nontemplate strand, which (as mentioned earlier) has the same sequence as the RNA. Base positions are numbered in both directions away from the start point, which is called +1; numbers increase as they go downstream. The base before the start point is numbered −1, and the negative numbers increase going upstream. (No base is assigned the number 0.)
The initial transcription product, containing the original 5′ end, is called the primary transcript. rRNA and tRNA primary transcripts go through a maturation process in which sequences at the ends are cleaved off (“processed”) by endonucleases. The mature products from rRNA and tRNA operons are stable, approaching the generation time of the bacterium. In contrast, mRNA primary transcripts are subject to almost immediate attack by endonucleases and exonucleases. Thus, bacterial mRNA lifetimes average only 1 to 3 minutes. In eukaryotes, rRNA and tRNA transcripts are processed, and the resulting products are stable, as in bacteria. However, eukaryote mRNA is much more stable than bacterial mRNA. (Modification and decay of mRNAs are discussed in the chapter titled Translation.)
Transcription is the first stage in gene expression and is the step at which it is regulated most often. Regulatory factors often determine whether a particular gene is transcribed by RNA polymerase, and subsequent stages in transcription and other steps in gene expression are also regulated frequently.
Two important questions in transcription are:
How does RNA polymerase find promoters on DNA? This is a particular example of a more general question: How do proteins distinguish their specific binding sites in DNA from other sequences?
How do regulatory proteins interact with RNA polymerase (and with one another) to activate or to inhibit specific steps during initiation, elongation, or termination of transcription?
In this chapter, we describe the interactions of bacterial RNA polymerase with DNA from its initial contact with the promoter, through the act of transcription, to its release from the DNA when the transcript has been completed.
17.2 Transcription Occurs by Base Pairing in a “Bubble” of Unpaired DNA
Transcription utilizes complementary base pairing, in common with the other polymerization reactions: replication and translation. FIGURE 17.3 illustrates the general principle of transcription. RNA synthesis takes place within a “transcription bubble,” in which DNA is transiently separated into its single strands and the template strand is used to direct synthesis of the RNA strand.

FIGURE 17.3 DNA strands separate to form a transcription bubble. RNA is synthesized by complementary base pairing with one of the DNA strands.
The RNA chain is synthesized from the 5′ end toward the 3′ end by adding new nucleotides to the 3′ end of the growing chain. The 3′–OH group of the last nucleotide added to the chain reacts with an incoming nucleoside 5′–triphosphate. The incoming nucleotide loses its terminal two phosphate groups (γ and β); its α group is used in the phosphodiester bond linking it to the chain. The overall reaction rate for the bacterial RNA polymerase can be as fast—about 40 to 50 nucleotides per second at 37°C for most transcripts; this is about the same as the rate of translation (15 amino acids per second), but much slower than the rate of DNA replication (approximately 800 bp per second).
RNA polymerase creates the transcription bubble when it binds to a promoter. FIGURE 17.4 illustrates the RNA polymerase moving along the DNA, with the bubble moving with it and the RNA chain growing in length. The process of base pairing and base addition within the bubble is catalyzed and scrutinized by the RNA polymerase itself.

FIGURE 17.4 Transcription takes place in a bubble, in which RNA is synthesized by base pairing with one strand of DNA in the transiently unwound region. As the bubble progresses, the DNA duplex reforms behind it, displacing the RNA in the form of a single polynucleotide chain.
The structure of the bubble within the transcription complex is shown in the expanded view of FIGURE 17.5. As RNA polymerase moves along the DNA template, it unwinds the duplex at the front of the bubble (the unwinding point), and the DNA automatically reforms the double helix at the back (the rewinding point). The length of the transcription bubble is about 12 to 14 bp, but the length of the RNA–DNA hybrid within the bubble is only 8 to 9 bp. As the enzyme moves along the template, the DNA duplex reforms, and the RNA is displaced as a free polynucleotide chain. The last 14 ribonucleotides in the growing RNA are complexed with the DNA and/or the enzyme at any given moment.
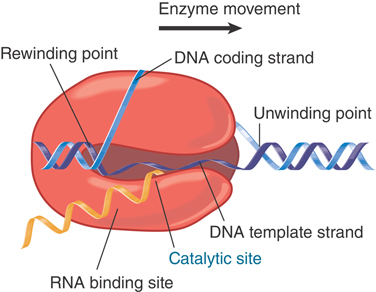
FIGURE 17.5 During transcription, the bubble is maintained within bacterial RNA polymerase, which unwinds and rewinds DNA and synthesizes RNA.
17.3 The Transcription Reaction Has Three Stages
The transcription reaction can be divided into the three stages illustrated in FIGURE 17.6: initiation, in which the promoter is recognized, a bubble is created, and RNA synthesis begins; elongation, in which the bubble moves along the DNA as the RNA transcript is synthesized; and termination, in which the RNA transcript is released and the bubble closes.

FIGURE 17.6 Transcription has three stages: The enzyme binds to the promoter and melts DNA and remains stationary during initiation; moves along the template during elongation; and dissociates at termination.
Initiation itself can be divided into multiple steps. Template recognition begins with the binding of RNA polymerase to the double-stranded DNA at a DNA sequence called the promoter. The enzyme first forms a closed complex in which the DNA remains double stranded. Next the enzyme locally unwinds the section of promoter DNA that includes the transcription start site to form the open complex. Separation of the DNA double strands makes the template strand available for base pairing with incoming ribonucleotides and synthesis of the first nucleotide bonds in RNA. The initiation phase can be protracted by the occurrence of abortive events, in which the enzyme makes short transcripts, typically shorter than about 10 nucleotides, while still bound at the promoter. The enzyme often makes successive rounds of abortive transcripts by releasing them and starting RNA synthesis again. The initiation phase ends when the enzyme finally succeeds in extending the chain and clearing the promoter.
Elongation involves processive movement of the enzyme by disruption of base pairing in double-stranded DNA, exposing the template strand for nucleotide addition and translocation of the transcription bubble downstream. As the enzyme moves, the template strand of the transiently unwound region is paired with the nascent RNA at the point of growth. Nucleotides are added covalently to the 3′ end of the growing RNA chain, forming an RNA–DNA hybrid within the unwound region. Behind the unwound region, the DNA template strand pairs with its original partner to reform the double helix, and the growing strand of RNA emerges from the enzyme.
The traditional view of elongation as a monotonic process, in which the enzyme moves forward along the DNA at a steady pace corresponding to nucleotide addition, has been revised in recent years. RNA polymerase pauses or even arrests at certain sequences. Displacement of the 3′ end of the RNA from the active site can cause the polymerase to “backtrack” and remove a few nucleotides from the growing RNA chain before restarting. Pausing can also be programmed to occur by the use of an RNA hairpin structure encoded in the template or sequence context–caused misalignment of the incoming nucleotide with its complementary base.
Termination involves recognition of sequences that signal the enzyme to halt further nucleotide addition to the RNA chain. In addition, long pauses can lead to termination. The transcription bubble collapses as the RNA–DNA hybrid is disrupted and the DNA reforms a duplex; phosphodiester bond formation ceases, and the transcription complex dissociates into its component parts: RNA polymerase, DNA, and RNA transcript. The sequence of DNA that directs termination at the end of transcription is called the terminator.
17.4 Bacterial RNA Polymerase Consists of Multiple Subunits
The best genetically and biochemically characterized RNA polymerases are from bacteria, especially Escherichia coli. High-resolution crystal structures have been solved from two thermophilic bacterial species, Thermus aquaticus and Thermus thermophilus. Nevertheless, in all bacteria a single type of RNA polymerase is responsible for the synthesis of rRNA, mRNA, and tRNA, unlike the situation in eukaryotes where 18/28S rRNAs, mRNAs, and tRNAs typically are transcribed by different RNA polymerases (i.e., Pol I, II, and III). About 13,000 RNA polymerase molecules are present in an E. coli cell, although the precise number varies with the growth conditions. Although not all the RNA polymerases are actually engaged in transcription at any one time, almost all are bound either specifically or nonspecifically to DNA.
The complete enzyme, or holoenzyme, in E. coli has a molecular weight of about 460 kD. The holoenzyme (α2ββ′ωσ) can be separated into two components: the core enzyme (α2ββ′ω) and the sigma factor (the σ polypeptide), which is concerned specifically with promoter recognition. Its subunit composition is summarized in FIGURE 17.7. The β and β′ subunits together account for RNA catalysis and make up most of the enzyme by mass. Their amino acid sequences and their three-dimensional structures are conserved with those of the largest subunits of the RNA polymerases from all three domains of life—bacteria, archaea, and eukaryotes (see the chapter titled Eukaryotic Transcription)—indicating that the basic features of transcription are shared among the multisubunit RNA polymerases of all organisms. β and β′ together form the enzyme’s active center, the main channel through which the DNA passes during the transcription cycle, the secondary channel through which the substrate ribonucleotides enter the enzyme on their path to the active site, and the exit channel through which the nascent RNA leaves the enzyme. Consistent with the role of these subunits in all these functions, mutations in rpoB and rpoC, the genes coding for β and β′, affect all stages of transcription.

FIGURE 17.7 Eubacterial RNA polymerases have five types of subunits: α, β, β′, and ω have rather constant sizes in different bacterial species, but σ varies more widely.
The dimer formed by the two α subunits serves as a scaffold for assembly of the core enzyme. The C-terminal domain (CTD) of the α subunits also contacts promoter DNA directly and thereby contributes to promoter recognition (see the following discussion). Furthermore, the α and σ subunits are the major surfaces on RNA polymerase for interactions of the enzyme with factors that regulate transcription initiation. The ω subunit also plays a role in enzyme assembly and participates in certain regulatory functions.
The σ subunit is primarily responsible for promoter recognition. The crystal structure of the bacterial core enzyme shows that it has a crab claw–like shape, with one claw formed primarily by the β subunit and the other primarily by the β′ subunit, as illustrated in FIGURE 17.8. The main channel for DNA lies at the interface of the β and β′ subunits, which stabilize the separated single strands in the transcription bubble, as shown in FIGURE 17.9.

FIGURE 17.8 The upstream face of the core RNA polymerase, illustrating the “crab claw” shape of the enzyme. The β (cyan) and β′ (pink) subunits of RNA polymerase have a channel for the DNA template. αI is shown in green and αII in yellow; ω is red.
Data from K. M. Geszvain and R. Landick (ed. N. P. Higgins). The Bacterial Chromosome. American Society for Microbiology, 2004.

FIGURE 17.9 The structure of RNA polymerase core enzyme for the bacterium Thermus aquaticus, with the β subunit in blue and the β′ subunit in green.
Structure from Protein Data Bank 1HQM. L. Minakhin, et al., Proc. Natl. Acad. Sci. USA 98 (2001): 892–897.
The catalytic site is at the base of the cleft formed by the β and β′ “jaws.” One of the two catalytic Mg2+ ions needed for the mechanism of catalysis is tightly bound to the enzyme in the active site (see the section in this chapter titled Phage T7 RNA Polymerase Is a Useful Model System). The other Mg2+ arrives at the active site in a complex with the incoming nucleoside triphosphate (NTP). As indicated earlier, the eukaryotic core enzyme has the same basic structure as the bacterial enzyme, although it contains some additional subunits and sequence features not found in the bacterial enzyme. The major differences between the bacterial and eukaryotic enzymes are almost exclusively at the periphery of the enzyme, far from the active site.
17.5 RNA Polymerase Holoenzyme Consists of the Core Enzyme and Sigma Factor
The core enzyme has general affinity for DNA, primarily because of electrostatic interactions between the protein, which is basic, and the DNA, which is acidic. When bound to DNA in this fashion, the DNA remains in duplex form. Core enzyme has the ability to synthesize RNA on a DNA template, but it cannot recognize promoters.
The form of the enzyme responsible for initiating transcription from promoters is called the holoenzyme (α2ββ′ωσ) (see FIGURE 17.10). It differs from the core enzyme by containing a sigma factor. Sigma factor not only ensures that bacterial RNA polymerase initiates transcription from specific sites, but it also reduces binding to nonspecific sequences. The association constant for binding of core to DNA is reduced by a factor of ~104, and the half-life of the complex is less than 1 second, whereas holoenzyme binds to promoters much more tightly, with an association constant ~1,000 times higher on average and a half-life that can be as long as several hours. Thus, sigma factor substantially destabilizes promoter-nonspecific binding.

FIGURE 17.10 Core enzyme binds indiscriminately to any DNA. Sigma factor reduces the affinity for sequence-independent binding and confers specificity for promoters.
The rate at which the holoenzyme binds to different promoter sequences varies widely, and thus this is an important parameter in determining promoter strength; that is, the efficiency of an individual promoter in initiating transcription. The frequency of initiation varies from about once per second for rRNA genes under optimal conditions to less than one every 30 minutes for some other promoters. Sigma factor is usually released when the RNA chain reaches less than about 10 nucleotides in length, leaving the core enzyme responsible for elongation.
17.6 How Does RNA Polymerase Find Promoter Sequences?
RNA polymerase must find promoters within the context of the genome. How are promoters distinguished from the 4 × 10⁶ bp that comprise the rest of the E. coli genome? FIGURE 17.11 illustrates simple models for how RNA polymerase might find promoter sequences from among all the sequences it can access. RNA polymerase holoenzyme locates the chromosome by random diffusion and binds sequence nonspecifically to the negatively charged DNA. In this mode, holoenzyme dissociates very rapidly. Diffusion sets an upper limit for the rate constant for associating with a 75-bp target of less than 108 M−1 sec−1. The actual forward rate constant for some promoters in vitro, however, appears to be approximately 108 M−1 sec−1, at or above the diffusion limit. Making and breaking a series of complexes until (by chance) RNA polymerase encounters a promoter and progresses to an open complex capable of making RNA would be a relatively slow process. Thus, the time required for random cycles of successive association and dissociation at loose binding sites is too great to account for the way RNA polymerase finds its promoter. RNA polymerase must therefore use some other means to seek its binding sites.

FIGURE 17.11 Proposed mechanisms for how RNA polymerase finds a promoter: (a) sliding, (b) intersegment transfer, (c) intradomain association and dissociation or hopping.
Data from C. Bustamante, et al., J. Biol. Chem. 274 (1999): 16665–16668.
Figure 17.11 shows that the process is likely to be sped up because the initial target for RNA polymerase is the whole genome, not just a specific promoter sequence. By increasing the target size, the rate constant for diffusion to DNA is correspondingly increased and is no longer limiting. How does the enzyme move from a random binding site on DNA to a promoter? Considerable evidence suggests that at least three different processes contribute to the rate of promoter search by RNA polymerase. First, the enzyme may move in a one-dimensional random walk along the DNA (“sliding”). Second, given the intricately folded nature of the chromosome in the bacterial nucleoid, having bound to one sequence on the chromosome, the enzyme is now closer to other sites, reducing the time needed for dissociation and rebinding to another site (“intersegment transfer” or “hopping”). Third, while bound nonspecifically to one site, the enzyme may exchange DNA sites until a promoter is found (“direct transfer”).
17.7 The Holoenzyme Goes Through Transitions in the Process of Recognizing and Escaping from Promoters
We can now describe the stages of transcription in terms of the interactions between different forms of RNA polymerase and the DNA template. The initiation reaction can be described by the parameters that are summarized in FIGURE 17.12:
The holoenzyme–promoter reaction starts by forming a closed binary complex, as shown in Figure 17.12a. “Closed” means that the DNA remains duplex. The formation of the closed binary complex is reversible; thus, it is usually described by an equilibrium constant (KB). The values of the equilibrium constant range widely for forming the closed sequence-dependent complex.
The closed complex is converted into an open complex of 1.3 turns of the double helix in a series of steps by first “melting” a short region of DNA around the −10 region, giving an unstable intermediate open complex within the sequence bound by the enzyme, as shown in Figure 17.12b. For most promoters, conversion from the closed to the open complex is irreversible, and this reaction can be described by the forward rate constant (kf). Some promoters (e.g., rRNA promoters), though, do not form stable open complexes, and this is a key to their regulation. Sigma factor plays an essential role in the melting reaction (see the sections later in this chapter on sigma factors). The transitions that occur from initiation to elongation are also accompanied by major changes in the structure and composition of the complex.
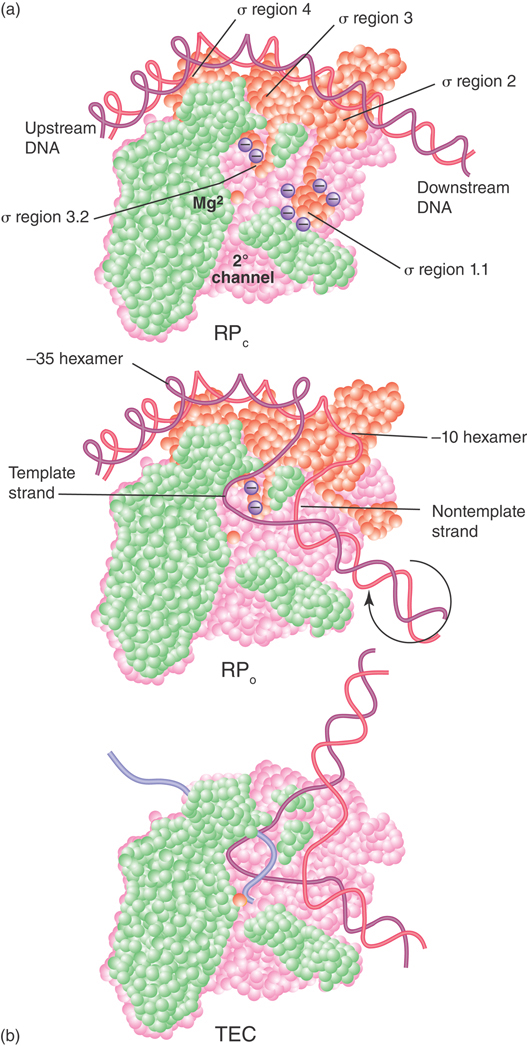
FIGURE 17.12 RNA polymerase passes through several steps prior to elongation. A closed binary complex is converted to an open form and then into a ternary complex.
Data from S. P. Haugen, W. Ross, and R. L. Gourse, Nat. Rev. Microbiol. 6 (2008): 507–519.
Changes in the shape of RNA polymerase accompany the kinetic transitions described earlier, as well as the transition to the elongation complex (as illustrated in FIGURE 17.13). In the closed complex, RNA polymerase holoenzyme covers about 55 bp of DNA, extending from about −55 to about +1. The double-stranded DNA binds primarily along one face of the holoenzyme, contacting the C-terminal domains of the α subunits as well as regions 2 and 4 of the σ subunit (see Figure 17.13). During the transition to the open complex, the conformation of both the RNA polymerase and the DNA change. The most dramatic changes in the structure of the complex are depicted in Figure 17.12: (1) an approximately 90° bend in the DNA, which allows the template strand to approach the active site of the enzyme; (2) strand opening of the promoter DNA between about −11 and +3 with respect to the transcription start site; (3) scrunching of the promoter DNA into the active channel, forming the transcription bubble; and (4) closing of the jaws of the enzyme to encircle the section of the promoter downstream of the transcription start site. Thus, promoter contacts in the open complex extend from about −55 to about +20.

FIGURE 17.13 RNA polymerase initially contacts the region from −55 to +20. When sigma dissociates, the core enzyme contracts to −30; when the enzyme moves a few base pairs, it becomes more compactly organized into the general elongation complex.
The next step is to incorporate the first two nucleotides and to form a phosphodiester bond between them. This generates a ternary complex containing RNA as well as DNA and the enzyme. At most promoters, an RNA chain forms that is several bases long without movement of the enzyme down the template. After each base is added, there is a certain probability that the enzyme will release the RNA chain, resulting in abortive initiation products. After release of the abortive product, the enzyme again begins synthesizing RNA at position +1. Repeated cycles of abortive initiation generate oligonucleotides that usually are only a few bases long, but that can be almost 20 nucleotides in length, before the enzyme actually succeeds in escaping from the promoter.
Interactions with RNA polymerase ultimately dissolve during the process of promoter escape. By the time the RNA chain has been extended to 15 to 20 nucleotides, the enzyme generally has gone through all the transitions that typify an elongation complex. The two most obvious of these transitions are the release of the sigma factor, shown in Figure 17.13, and the formation of a complex covering only about 35 bp of DNA, rather than the approximately 70 bp characteristic of promoter complexes. Although release of sigma factor usually occurs during the process of promoter escape, this is not obligatory for the transition to elongation. In some cases sigma factor has been identified in elongation complexes, but its association with the enzyme may reflect rebinding to the core enzyme during the elongation phase.
17.8 Sigma Factor Controls Binding to DNA by Recognizing Specific Sequences in Promoters
As a sequence of DNA whose function is to be recognized by proteins, a promoter differs from sequences whose role is to be transcribed. The information for promoter function is provided directly by the DNA sequence: Its structure is the signal. This is a classic example of a cis-acting site, as defined in the chapter titled Genes Are DNA and Encode RNAs and Polypeptides. By contrast, expressed regions gain their meaning only after the information is transferred into the form of some other nucleic acid or protein.
One way to design a promoter would be for a particular sequence of DNA to be recognized by RNA polymerase. Every promoter would consist of, or at least include, this sequence. In the bacterial genome, the minimum length that could provide an adequate signal is 12 bp. (Any shorter sequence is likely to occur—just by chance—a sufficient number of additional times to provide false signals. The minimum length required for unique recognition increases with the size of genome, a problem in eukaryotic genomes.) The 12-bp sequence need not be contiguous. If a specific number of base pairs separates two constant shorter sequences, their combined length could be less than 12 bp, because the distance of separation itself provides a part of the signal (even if the intermediate sequence is itself irrelevant). In fact, RNA polymerase recognizes promoter DNA sequences in large part from “direct readout” of specific bases in the DNA by specific amino acids in the holoenzyme. The dramatic differences in the strengths of different bacterial promoters derives in large part from variation in how well the different promoter sequences are able to be read out by the amino acid sequences present in the σ and α subunits.
Attempts to identify the features in DNA that are necessary for RNA polymerase binding started by comparing the sequences of different promoters. Any essential nucleotide sequence should be present in all the promoters. Such a sequence is said to be conserved. A conserved sequence need not necessarily be conserved at every single position, though; some variation is permitted. How do we analyze a sequence of DNA to determine whether it is sufficiently conserved to constitute a recognizable signal?
Putative DNA recognition sites can be defined in terms of an idealized sequence that represents the base most often present at each position. A consensus sequence is defined by aligning all known examples to maximize their homology. For a sequence to be accepted as a consensus, each particular base must be reasonably predominant at its position, and most of the actual examples must be related to the consensus by only one or two substitutions.
A striking feature in the sequence of promoters in E. coli is the lack of extensive conservation of sequence over the entire 75 bp associated with RNA polymerase. Some short stretches within the promoter are conserved, however, and they are critical for its function. Conservation of only very short consensus sequences is a typical feature of regulatory sites (such as promoters) in both prokaryotic and eukaryotic genomes.
Several elements in bacterial promoters contribute to their recognition by RNA polymerase holoenzyme. Two 6-bp elements, referred to as the −10 element and −35 element (as well as the length of the “spacer” sequence between them), are usually the most important of these recognition sequences. The promoter sequence at and directly adjacent to the transcription start point, the sequences on either side of the −10 element (referred to as the extended −10 element on the upstream side and the discriminator on the downstream side), and the 10 to 20 bp directly upstream of the −35 element (referred to as the UP element), however, also interact sequence specifically with RNA polymerase and contribute to promoter efficiency:
A 6-bp region is recognizable centered approximately 10 bp upstream of the start point in most promoters (the actual distance from the start site varies slightly from promoter to promoter). This hexameric sequence is usually called the −10 element, the Pribnow box, or sometimes the TATA box (though the latter name is preferentially applied to a similar consensus sequence in eukaryotic promoters). Its consensus, TATAAT, can be summarized in the form:
T80 A95 T45 A60 A50 T96
where the subscript denotes the percent occurrence of the most frequently found base, which varies from 45% to 96%. (A position at which there is no discernible preference for any base would be indicated by N.) The frequency of occurrence corresponds to the importance of these base pairs in binding RNA polymerase. Thus, the initial highly conserved TA and the final, almost completely conserved T in the −10 sequence are crucial for promoter recognition. It is now known that the −10 element makes sequence-specific contacts to sigma factor regions 2.3 and 2.4 (see the discussion that follows). This region of the promoter is double stranded in the closed complex and single stranded in the open complex, though, so interactions between the −10 element and RNA polymerase are complex and change at different stages in the process of transcription initiation.
The conserved hexamer, TTGACA, centered at approximately 35 bp upstream of the start point is called the −35 element. In more detailed form, it can be written:
T82 T84 G78 A65 C54 A45
Bases in this element interact directly with region 4.2 of the sigma factor (see the discussion that follows) similarly in both the closed and open complexes.
The distance separating the −35 and −10 sites is between 16 bp and 18 bp in about 90% of promoters; in the exceptions, it is as little as 15 bp or as great as 20 bp. Although the actual sequence in most of the intervening region is relatively unimportant, the distance is critical, because, given the helical nature of the DNA, it determines not only the appropriate separation of the two interacting regions in RNA polymerase but also the geometrical orientation of the two sites with respect to one another.
The start point is usually (more than 90% of the time) a purine, usually adenine. It is common for the start point to be the central base in the sequence CAT, but the conservation of this triplet is not great enough to regard it as an obligatory signal.
Certain base pairs in the region between the start point and the −10 element are contacted by region 1.2 of the sigma factor (see the discussion that follows). For example, a sequence-specific interaction between a guanine residue on the nontemplate strand two positions downstream of the −10 element is especially important in determining the stability of the open complex. Thus, differences in promoter sequence at positions that are not highly conserved can contribute to the variation in the strengths of different promoters.
Bases in the extended −10 element are contacted by region 3.0 of the sigma factor (see the discussion that follows). The sequence TGN at the upstream end of the −10 element results in interactions that are especially essential for transcription initiation when the promoter lacks a −35 element sequence that closely matches the consensus. This illustrates the modularity of promoter sequences: A weak match to the consensus in one module can be compensated for by a strong match to the consensus in another.
The approximately 20-bp region upstream of the −35 element may interact with the CTDs of the two α subunits. Effects of these interactions on promoter activity can be quite substantial, increasing transcription well over an order of magnitude for highly expressed promoters like those in rRNA genes. When these sequences closely match the consensus, this region is referred to as the UP element.
The structure of a promoter, showing the permitted range of variation from this optimum, is illustrated in FIGURE 17.14.

FIGURE 17.14 DNA elements and RNA polymerase modules that contribute to promoter recognition by sigma factor.
Data from S. P. Haugen, W. Ross, and R. L. Gourse, Nat. Rev. Microbiol. 6 (2008): 507–519.
17.9 Promoter Efficiencies Can Be Increased or Decreased by Mutation
Effects of mutations can provide information about promoter function. Mutations in promoters affect the level of expression of the gene(s) they control without altering the gene products themselves. Most are identified as bacterial mutants that have lost, or have very much reduced, transcription of the adjacent genes. They are known as down mutations. Mutants are also found with up mutations in which there is increased transcription from the promoter.
It is important to remember that “up” and “down” mutations are defined relative to the usual efficiency with which a particular promoter functions. This varies widely. Thus a change that is recognized as a down mutation in one promoter might never have been isolated in another (which in its wild-type state could be even less efficient than the mutant form of the first promoter). Information gained from studies in vivo simply identifies the overall direction of the change caused by mutation.
Mutations that increase the similarity of the −10 or −35 elements to the consensus sequences or bring the distance between them closer to 17 bp usually increase promoter activity. Likewise, mutations that decrease the resemblance of either site to the consensus or make the distance between them farther from 17 bp result in decreased promoter activity. Down mutations tend to be concentrated in the most highly conserved promoter positions, confirming the particular importance of these bases as determinants of promoter efficiency. However, exceptions to these rules occasionally occur.
For example, a promoter with consensus sequences in all the modules described earlier is illustrated in Figure 17.14. However, no such natural promoters exist in the E. coli genome, and artificial promoters with “perfect” matches to the consensus at all these positions are actually weaker than promoters with at least one mismatch in the −10 or −35 consensus hexamers. This is because they bind to RNA polymerase so tightly that this actually impedes promoter escape.
To determine the absolute effects of promoter mutations, the affinity of RNA polymerase for wild-type and mutant promoters has been measured in vitro. Variation in the rate at which RNA polymerase binds to different promoters in vitro correlates well with the frequencies of transcription when their genes are expressed in vivo. Taking this analysis further, the stage at which a mutation influences the efficiency of a promoter can be determined. Does it change the affinity of the promoter for binding RNA polymerase? Does it leave the enzyme able to bind but unable to initiate? Is the influence of an ancillary factor altered?
By measuring the kinetic constants for formation of a closed complex and its conversion to an open complex, we can dissect the two stages of the initiation reaction:
Down mutations in the −35 sequence usually reduce the rate of closed complex formation, but they do not inhibit the conversion to an open complex.
Down mutations in the −10 sequence can reduce either the initial formation of a closed complex or its conversion to the open form, or both.
The consensus sequence of the −10 site consists exclusively of A-T base pairs, a configuration that assists the initial melting of DNA into single strands. The lower energy needed to disrupt A-T pairs compared with G-C pairs means that a stretch of A-T pairs demands the minimum amount of energy for strand separation. The sequences immediately around and downstream from the start point also influence the initiation event. Furthermore, the initial transcribed region (from about +1 to about +120) influences the rate at which RNA polymerase clears the promoter, and therefore has an effect upon promoter strength. Thus, the overall strength of a promoter cannot always be predicted from its consensus sequences, even when taking into consideration the other RNA polymerase recognition elements in addition to the −10 and −35 elements.
It is important to emphasize that although similarity to consensus is a useful tool for identifying promoters by DNA sequence alone, and “typical” promoters contain easily recognized −35 and −10 sequences, many promoters lack recognizable −10 and/or −35 elements. In many of these cases, the promoter cannot be recognized by RNA polymerase alone and requires an ancillary protein “activator” (see the chapter titled The Operon) that overcomes the deficiency in intrinsic interaction between RNA polymerase and the promoter. It is also important to emphasize that “optimal activity” does not mean “maximal activity.” Many promoters have evolved with sequences far from consensus precisely because it is not optimal for the cell to make too much of the product encoded by the RNA transcript.
17.10 Multiple Regions in RNA Polymerase Directly Contact Promoter DNA
As mentioned briefly in the section titled Sigma Factor Controls Binding to DNA by Recognizing Specific Sequences in Promoters, several domains in the sigma factor subunit and the CTD in the α subunit of the RNA polymerase core contact promoter DNA. The identification of a series of different consensus sequences recognized by holoenzymes containing different sigma factors (as shown in TABLE 17.1) implies that the sigma factor subunit must itself contact DNA. This suggests further that the different sigma factors must bind similarly to core enzyme so that the DNA recognition surfaces on the different sigma factors would be positioned similarly to make critical contacts with the promoter sequences in the vicinity of the −35 and −10 sequences.
TABLE 17.1 E. coli sigma factors recognize promoters with different consensus sequences.
| Subunit (Gene) | Size (Number of Amino Acids) | Approximate Number of Promoters | Promoter Sequence Recognized |
|---|---|---|---|
| Sigma 70 (rpoD) | 613 | 1,000 | TTGACA–16 to 18 bp–TATAAT |
| Sigma 54 (rpoN) | 477 | 5 | CTGGNA–6 to 18 bp–TATAAT |
| Sigma S (rpoS) | 330 | 100 | TTGACA–16 to 18 bp–TATAAT |
| Sigma 32 (rpoH) | 284 | 30 | CCCTTGAA–13 to 15 bp–CCCGATNT |
| Sigma F (rpoF) | 239 | 40 | CTAAA–15 bp–GCCGATAA |
| Sigma E (rpoE) | 202 | 20 | GAA–16 bp–YCTGA |
| Sigma Fecl (fecl) | 173 | 1–2 | ? |
Further evidence that sigma factor contacts the promoter directly at both the −35 and −10 consensus sequences was provided by substitutions in the sigma factor that suppressed mutations in the consensus sequences. When a mutation at a particular position in the promoter prevents recognition by RNA polymerase, and a compensating mutation in sigma factor allows the polymerase to use the mutant promoter, the most likely explanation is that the relevant base pair in DNA is contacted by the amino acid that has been substituted.
Comparisons of the sequences of several bacterial sigma factors suggested conserved regions in E. coli σ70 (FIGURE 17.15) that interact directly with promoters, and these inferences were substantiated by the identification of a crystal structure of RNA polymerase holoenzyme in complex with a promoter fragment. The bacteria T. aquaticus and T. thermophilus illustrate how the DNA-binding regions of the sigma factor fold into independent domains in the protein regions 1.2, 2.3–2.4, 3.0, and 4.1–4.2.
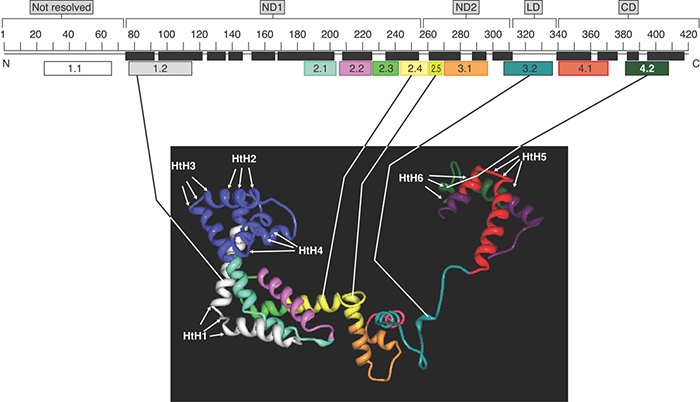
FIGURE 17.15 The structure of sigma factor in the context of the holoenzyme: −10 and −35 interactions. Sigma factor is extended and its domains are connected by flexible linkers.
Illustration adapted from D. G. Vassylyev, et al., Nature 417 (2002): 712–719. Structure from Protein Data Bank 1IW7.
Figure 17.15 illustrates the sections of sigma factor that play direct roles in promoter recognition. This figure shows the structure of the major sigma factor as it exists in the context of the holoenzyme. Two short parts of region 2 and one part of region 4 (2.3, 2.4, and 4.2) contact bases in the −10 and −35 elements, respectively; sigma factor region 1.2 contacts the promoter region just downstream from the −10 element, and region 3.0 contacts the promoter region just upstream from the −10 element. Each of these regions forms short stretches of α-helix in the protein. A crystal structure of the holoenzyme in complex with a promoter fragment, in conjunction with experiments with promoters in which the DNA strands were built to contain mismatches (heteroduplexes), showed that σ70 makes contacts with bases principally on the nontemplate strand of the −10 element, the extended −10 element, and the discriminator region, and it continues to hold these contacts after the DNA has been unwound in this region. This confirms that sigma factor is important in the melting reaction.
The use of α-helical motifs in proteins to recognize duplex DNA sequences is common (see the chapter titled Eukaryotic Transcription Regulation). Amino acids separated by three to four positions lie on the same face of an α-helix and are therefore in a position to contact adjacent base pairs. FIGURE 17.16 shows that amino acids lying along one face of the 2.4 region α-helix contact the bases at positions −12 to −10 of the −10 promoter sequence.

FIGURE 17.16 Amino acids in the 2.4 α-helix of β70 contact specific bases in the coding strand of the −10 promoter sequence.
Region 2.3 resembles proteins that bind single-stranded nucleic acids and is involved in the melting reaction. Regions 2.1 and 2.2 (which comprise the most highly conserved part of sigma factor) are involved in the interaction with the core enzyme. It is assumed that all sigma factors bind the same regions of the core polymerase, which ensures that the sigma factors compete for limiting core RNA polymerase.
Although sigma factor has domains that recognize specific bases in promoter DNA, the N-terminal region of free sigma factor (region 1.1), acting as an autoinhibitory domain, masks the DNA-binding region; only once the conformation of the sigma factor has been altered by its association with the core enzyme can it bind specifically to promoter sequences (FIGURE 17.17). The inability of free sigma factor to recognize promoter sequences is important: If sigma factor could bind to promoters as a free subunit, it might block holoenzyme from initiating transcription. Figure 17.17 schematizes the conformational change in sigma factor at open complex formation.
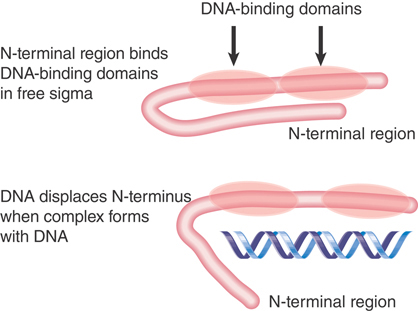
FIGURE 17.17 The N-terminus of sigma blocks the DNA-binding regions from binding to DNA. When an open complex forms, the N-terminus swings 20 Å away, and the two DNA-binding regions separate by 15 Å.
When sigma factor binds to the core polymerase, the N-terminal domain swings approximately 20 Å away from the DNA-binding domains, and the DNA-binding domains separate from one another by about 15 Å, presumably to acquire a more elongated conformation appropriate for contacting DNA. Mutations in either the −10 or −35 sequences prevent an N-terminal–deleted σ70 from binding to DNA, which suggests that σ70 contacts both sequences simultaneously. This fits with the information from the crystal structure of the holoenzyme (Figure 17.15), in which it is clear that the sigma factor has a rather elongated structure, extending over the approximately 68 Å of two turns of DNA.
Although sigma factor region 1.1 is not resolved in the crystal structure, biophysical measurements of its position in the holoenzyme versus the open complex suggest that in the free holoenzyme the N-terminal domain (region 1.1) is located in the main DNA channel of the enzyme, essentially mimicking the location that the promoter will occupy when a transcription complex is formed (FIGURE 17.18). When the holoenzyme forms an open complex on DNA, the N-terminal sigma factor domain is displaced from the main channel. Its position with respect to the rest of the protein is therefore very flexible; it changes when sigma factor binds to core enzyme and again when the holoenzyme binds to DNA. The DNA helix has to move some 16 Å from its initial position in order to enter the main DNA channel, and then it has to move again to allow DNA to enter the channel during open complex formation. FIGURE 17.19 illustrates this movement, looking in cross section down the helical axis of the DNA.
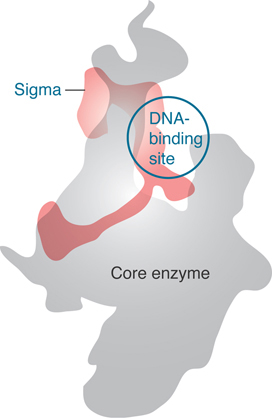
FIGURE 17.18 Sigma factor has an elongated structure that extends along the surface of the core subunits when the holoenzyme is formed.
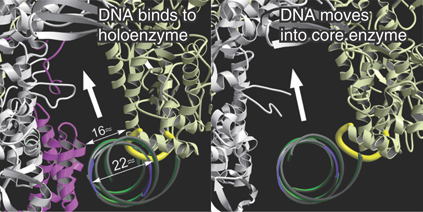
FIGURE 17.19 DNA initially contacts sigma factor (pink) and core enzyme (gray). It moves deeper into the core enzyme to make contacts at the −10 sequence. When sigma is released, the width of the passage containing DNA increases.
Reprinted by permission from Macmillan Publishers Ltd: Nature, D. G. Vassylyev, et al., vol. 417, pp. 712–719, copyright 2002. Photo courtesy of Shigeyuki Yokoyama, The University of Tokyo.
Although it was first thought that sigma factor is the only subunit of RNA polymerase that contributes to the promoter region, the CTD of the two α subunits also can play a major role in contacting promoter DNA by binding to the near promoter UP elements. Because the αCTDs are tethered flexibly to the rest of RNA polymerase (see Figure 17.14), the enzyme can reach regions quite far upstream while still bound to the −10 and −35 elements. The αCTDs thereby provide mobile domains for contacting transcription factors bound at different distances upstream from the transcription start site in different promoters.
17.11 RNA Polymerase–Promoter and DNA–Protein Interactions Are the Same for Promoter Recognition and DNA Melting
The ability of RNA polymerase (or indeed any protein) to recognize DNA can be characterized by footprinting. A sequence of DNA bound to the protein is partially digested with an endonuclease to attack individual phosphodiester bonds within the nucleic acid. Under appropriate conditions, any particular phosphodiester bond is broken in some, but not in all, DNA molecules. The positions that are cleaved can be identified by using DNA labeled on one strand at one end only. The principle is the same as that involved in DNA sequencing: Partial cleavage of an end-labeled molecule at a susceptible site creates a fragment of unique length.
FIGURE 17.20 shows that following the nuclease treatment the broken DNA fragments can be separated by electrophoresis on a gel that separates them according to length. Each fragment that retains a labeled end produces a radioactive band. The position of the band corresponds to the number of bases in the fragment. The shortest fragments move the fastest, so distance from the labeled end is counted up from the bottom of the gel.

FIGURE 17.20 Footprinting identifies DNA-binding sites for proteins by their protection against nicking.
In free DNA, virtually every susceptible bond position is broken in one or another molecule. Figure 17.20 illustrates that when the DNA is complexed with a protein, the positions covered by the DNA-binding protein are protected from cleavage. Thus, when two reactions are run in parallel—a control DNA in which no protein is present and an experimental mixture containing molecules of DNA bound to the protein—a characteristic pattern emerges. When a bound protein blocks access of the nuclease to DNA, the bonds in the bound sequence fail to be broken in the experimental mixture, and that part of the gel remains unrepresented by labeled DNA fragments.
In the control, virtually every bond is broken, generating a ladder of bands, with one band representing each base. Thirty-one bands are shown in Figure 17.20. In the protected fragment, bonds cannot be broken in the region bound by the protein, so bands representing fragments of the corresponding sizes are not generated. The absence of bands 9 through 18 in the figure identifies a protein-binding site covering the region located 9 to 18 bases from the labeled end of the DNA. By comparing the control and experimental lanes with a sequencing reaction that is run in parallel, it becomes possible to “read off” the corresponding sequence directly, thus identifying the nucleotide sequence of the binding site.
As described previously (see Figure 17.13), RNA polymerase binds to the promoter region from −55 to +20. The points at which RNA polymerase actually contacts the promoter can be identified by modifying the footprinting technique to treat RNA polymerase–promoter complexes with reagents that modify particular bases. We can then perform the experiment in two ways:
The DNA can be modified before it is bound to RNA polymerase. In this case, if the modification prevents RNA polymerase from binding, we have identified a base position where contact is essential.
The RNA polymerase–DNA complex can be modified. We then can compare the pattern of protected bands with that of free DNA and of the unmodified complex. Some bands disappear, thus identifying sites at which the enzyme has protected the promoter against modification. Other bands increase in intensity, thus identifying sites at which the DNA must be held in a conformation in which it is more exposed to the cleaving agent.
These changes in sensitivity revealed the geometry of the complex, as summarized in FIGURE 17.21, for a typical promoter. The regions at −35 and −10 contain most of the contact points for the enzyme. Within these regions, the same sets of positions tend both to prevent binding if previously modified, and to show increased or decreased susceptibility to modification after binding. The points of contact do not coincide completely with sites of mutation; however, they occur in the same limited region.
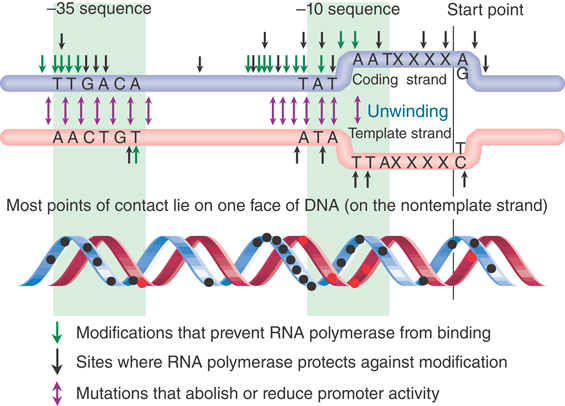
FIGURE 17.21 One face of the promoter contains the contact points for RNA.
It is noteworthy that the same positions in different promoters provide many of the contact points, even though a different base is present. This indicates that there is a common mechanism for RNA polymerase binding, although the reaction does not depend on the presence of particular bases at some of the points of contact. This model explains why some of the points of contact are not sites of mutation. In addition, not every mutation lies in a point of contact; the mutations may influence the neighborhood without actually being touched by the enzyme.
It is especially significant that the experiments using premodification identify sites in the same region that are protected by the enzyme against subsequent modification. These two experiments measure different things. Premodification identifies all those sites that the enzyme must recognize in order to bind to DNA. Protection experiments recognize all those sites that actually make contact in the binary complex. The protected sites include all the recognition sites and also some additional positions; this suggests that the enzyme first recognizes a set of bases necessary for it to “touch down” and then extends its points of contact to additional bases.
The region of DNA that is unwound in the binary complex can be identified directly by multiple methods. Sigma factor region 2 binds extensively throughout the promoter region to the phosphodiester backbone. Promoter sequence recognition and melting occur concurrently. Melting begins with base flipping, where the two bases A11 and T7 are each flipped out of their base-pairing position into pockets in the sigma factor, as shown in FIGURE 17.22. The pockets are specific for an A and a T. This initiates strand separation and recognizes proper promoter sequence at the same time. The region that subsequently becomes unwound starts at the right end of the −11 sequence and propagates down to just past the start point at +3.

FIGURE 17.22 Sequence-specific recognition of the −10 element by region 2 of σ. The DNA backbone is represented by green circles, bases of the nontemplate strand by dark blue polygons, and bases of the template strand by light blue polygons. The sequence of the nontemplate strand corresponds to the consensus of the −10 element. Region 2 of σ is shown as an orange polygon.
Data from X. Liu, et al., Cell 147 (2011): 1218–1219.
Viewed in three dimensions, the points of contact upstream of the −10 sequence all lie on one face of DNA. This can be seen in the lower drawing in Figure 17.21, in which the contact points are marked on a double helix viewed from one side. Most lie on the nontemplate strand. These bases are probably recognized in the initial formation of a closed binary complex. This would make it possible for RNA polymerase to approach DNA from one side and recognize that face of the DNA. As DNA unwinding commences, further sites that originally lay on the other face of DNA can be recognized and bound.
17.12 Interactions Between Sigma Factor and Core RNA Polymerase Change During Promoter Escape
RNA polymerase encounters a dilemma in reconciling its needs for initiation with those for elongation. First, the RNA exit channel is actually occupied by part of the sigma factor, the linker connecting domains 3 and 4. Therefore, promoter escape must involve rearrangement of the sigma factor, displacing it from the RNA exit channel so that RNA synthesis can proceed. Second, initiation requires tight binding only to particular sequences (promoters), whereas elongation requires association with all sequences that the enzyme encounters during transcription. FIGURE 17.23 illustrates how the dilemma is solved by the reversible association of sigma factor with core enzyme.

FIGURE 17.23 Sigma factor and core enzyme recycle at different points in transcription.
Initiation involves the binding of the first two nucleotides and the formation of a phosphodiester bond between them. This generates a ternary complex containing RNA as well as DNA. At most promoters, an RNA chain forms that is several bases long and could be up to 9 bases long without movement of the polymerase down the template. The initiation phase is protracted by the occurrence of abortive events in which the enzyme makes short transcripts, releases them, and then starts synthesis of RNA again. The initiation stage ends when the polymerase succeeds in extending the chain and clears the promoter.
As mentioned above, the enzyme usually undergoes cycles of abortive initiation in the process of escaping from the promoter. The enzyme does not move down the template while it undergoes these abortive cycles. Rather, it pulls the first few nucleotides of downstream DNA into itself, extruding these single strands onto the surface of the enzyme in a process called DNA scrunching. By a mechanism that is not completely understood, the enzyme then escapes from this abortive cycling mode and enters the elongation phase (discussed shortly).
Although the release of sigma factor from the complex is not essential for promoter escape, dissociation of sigma factor from core usually occurs concurrently with or soon after promoter escape. Sigma factor is in excess of core RNA polymerase, so release of sigma from holoenzyme is not simply to make it available for use in additional copies of holoenzyme. In fact, sigma factors compete for limiting copies of core RNA polymerase as a means of changing the transcription profile (see the discussion of multiple sigma factors later in this chapter in the section titled Competition for Sigma Factors Can Regulate Initiation).
The core enzyme in the ternary complex (which comprises DNA, nascent RNA, and RNA polymerase) is essentially “locked in” until elongation has been completed. As will be described shortly, this processivity results in part from the way the enzyme encircles the DNA and in part from the increase in the affinity of the enzyme for the complex afforded by interactions with the nascent RNA.
The drug rifampicin (a member of the rifamycin antibiotic family) blocks transcription by bacterial RNA polymerase. It is the major antibiotic used against tuberculosis. The crystal structure of RNA polymerase bound to rifampicin explains its action: It binds in a pocket of the β subunit, less than 12 Å away from the active site, but in a position where it blocks the path of the elongating RNA. By preventing the RNA chain from extending beyond two to three nucleotides, it blocks transcription.
17.13 A Model for Enzyme Movement Is Suggested by the Crystal Structure
As a result of the crystal structures of the bacterial and yeast enzymes in complex with NTPs and/or with DNA, we now have considerable information about the structure and function of RNA polymerase during elongation. Bacterial RNA polymerase has overall dimensions of approximately 90 × 95 × 160 Å, and the archaeal and eukaryotic RNA polymerases are only slightly larger, primarily from additional stretches of amino acids and/or extra subunits situated on the periphery of the enzyme. Nevertheless, the core enzymes share not only a common structure, in which there is a “channel” about 25 Å wide that accommodates the DNA, but a common mechanism for nucleotide addition.
A model of this channel in bacterial RNA polymerase is illustrated in FIGURE 17.24. The groove holds about 17 bp of DNA. In conjunction with the approximately 13 nucleotides of DNA accommodated by the enzyme’s active site region, this accounts for the approximately 30- to 35-nucleotide protected region observed in footprints of the elongation complex. The groove is lined with positive charges, enabling it to interact with the negatively charged phosphate groups of DNA. The catalytic site is formed by a cleft between the two large subunits that grasp DNA downstream in its “jaws” as it enters the RNA polymerase. RNA polymerase surrounds the DNA, and a catalytic Mg2+ ion is found at the active site. The DNA is held in position by the downstream clamp, another name for one of the jaws. FIGURE 17.25 illustrates the 90° turn that the DNA takes at the entrance to the active site because of an adjacent wall of protein. The length of the RNA hybrid is limited by another protein obstruction, called the lid. Nucleotides are thought to enter the active site from below, via the secondary channel (called the pore in yeast RNA polymerase). The transcription bubble includes 8 to 9 bp of DNA–RNA hybrid. The lid separates the DNA and RNA bases at one end of the hybrid (see Figure 17.24), and the DNA base on the template strand at the other end of the hybrid is flipped out to allow pairing with the incoming NTP.
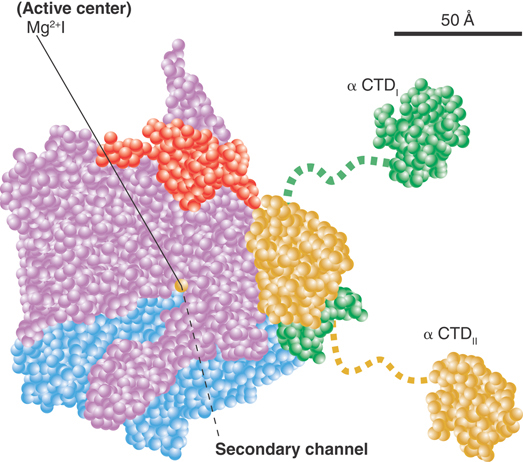
FIGURE 17.24 The A model showing the structure of RNA polymerase through the main channel. Subunits are color-coded as follows: β′, pink; β, cyan; αI, green; αII, yellow; ω, red.
Data from K. M. Geszvain and R. Landick (ed. N. P. Higgins). The Bacterial Chromosome. American Society for Microbiology, 2004.
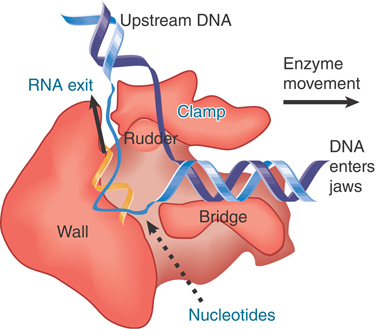
FIGURE 17.25 DNA is forced to make a turn at the active site by a wall of protein. Nucleotides may enter the active site through a pore in the protein.
Once DNA has been melted, the trajectory of the individual strands within the enzyme is no longer constrained by the rigidity of the double helix, allowing DNA to make its 90° turn at the active site. Furthermore, a large conformational change occurs in the enzyme itself involving the downstream clamp.
One of the dilemmas of any nucleic acid polymerase is that the enzyme must make tight contacts with the nucleic acid substrate and product, but then must break these contacts and remake them with each cycle of nucleotide addition. Consider the situation illustrated in FIGURE 17.26. A polymerase makes a series of specific contacts with the bases at particular positions. For example, contact “1” is made with the base at the end of the growing chain and contact “2” is made with the base in the template strand that is complementary to the next base to be added. Note, however, that the bases that occupy these locations in the nucleic acid chains change every time a nucleotide is added!

FIGURE 17.26 Movement of a nucleic acid polymerase requires breaking and remaking bonds to the nucleotides at fixed positions relative to the enzyme structure. The nucleotides in these positions change each time the enzyme moves a base along the template.
The top and bottom panels of the figure show the same situation: A base is about to be added to the growing chain. The difference is that the growing chain has been extended by one base in the bottom panel. The geometry of both complexes is exactly the same, but contacts “1” and “2” in the bottom panel are made to bases in the nucleic acid chains that are located one position farther along the chain. The middle panel shows that this must mean that, after the base is added, and before the enzyme moves relative to the nucleic acid, the contacts made to specific positions must be broken so that they can be remade to bases that occupy those positions after the movement.
RNA polymerase crystal structures provide considerable insight into how the enzyme retains contact with its substrate while breaking and remaking bonds in the process of the nucleotide addition cycle and undergoing translocation by a Brownian ratchet mechanism. Random fluctuations occur and are locked into the correct position by the binding of a nucleoside triphosphate. The energy from binding the correct substrate stabilizes the active conformation and suppresses backtracking. A flexible module called the trigger loop appears to be unfolded before nucleotide addition, but becomes folded once the NTP enters the active site. Once bond formation and translocation of the enzyme to the next position are complete, the trigger loop unfolds again, ready for the next cycle. Thus, a structural change in the trigger loop coordinates the sequence of events in catalysis.
17.14 A Stalled RNA Polymerase Can Restart
RNA polymerase must be able to handle situations when transcription elongation is blocked or sequences cause the polymerase to pause. Blockage can happen, for example, when DNA is damaged. A model system for such situations is provided by arresting elongation in vitro by omitting one of the necessary precursor nucleotides, allowing fraying of the end of the RNA. Any event that causes misalignment of the 3′ terminus of the RNA with the active site results in the same problem, though: Something is needed to reposition the 3′–OH of the nascent RNA with the active site so that it can undergo attack from the next NTP and phosphodiester bond formation. Realignment is accomplished by cleavage of the RNA to place the terminus in the right location for addition of further bases.
Although the cleavage activity is intrinsic to RNA polymerase itself, it is stimulated greatly by accessory factors that are ubiquitous in the three biological kingdoms. Two such factors are present in E. coli, GreA and GreB, and eukaryotic RNA polymerase II uses TFIIS for the same purpose. TFIIS displays little similarity in sequence or structure to the Gre factors, but it binds to the same part of the enzyme, the RNA polymerase secondary channel (pore).
The Gre factors/TFIIS enable the polymerase to cleave a few ribonucleotides from the 3′ terminus of the RNA product, thereby allowing the catalytic site of RNA polymerase to be realigned with the 3′–OH. Each of the factors inserts a narrow protein domain (in TFIIS this is a zinc ribbon, in the bacterial enzyme it is a coiled coil) deep into RNA polymerase, approaching very close to the catalytic center. Two acidic amino acids at the tip of the factor approach the primary catalytic magnesium ion in the active site, allowing a second magnesium ion to enter and convert the catalytic site to turn into a ribonuclease.
In addition to damaged DNA, certain sequences have the intrinsic ability to cause the polymerase to pause. Prolonged pausing may lead to termination, discussed below. An example of an E. coli pause-inducing sequence is GxxxxxxxxCG (where x is any base). Pausing may be regulatory in that transcription and translation of the mRNA can be coordinated.
In summary, the elongating RNA polymerase has the ability to unwind and rewind DNA, to keep hold of the separated strands of DNA as well as the RNA product, to catalyze the addition of ribonucleotides to the growing RNA chain, to monitor the progress of this reaction, and—with the assistance of an accessory factor or two—to fix problems that occur by cleaving off a few nucleotides of the RNA product and restarting RNA synthesis.
17.15 Bacterial RNA Polymerase Terminates at Discrete Sites
Once RNA polymerase has started transcription, the enzyme moves along the template, synthesizing RNA. As described earlier in this chapter in the section titled The Transcription Reaction Has Three Stages, movement is not at a steady pace; the rate varies and is determined by the sequence context. The RNA polymerase can pause or arrest and even backtrack, either of which can lead to termination. The enzyme stops adding nucleotides to the growing RNA chain, releases the completed product, and dissociates from the DNA template at the point of a genuine terminator sequence or during a prolonged pause. Termination requires that all hydrogen bonds holding the RNA–DNA hybrid together must be broken, after which the DNA duplex reforms.
It is sometimes difficult to define the termination site for an RNA that has been synthesized in the living cell, because the 3′ end of the molecule can be degraded by a 3′ exonuclease or cleaved by an endonuclease, leaving no history of the actual site at which RNA polymerase terminated in the remaining transcript; in fact, specific 3′-end modifications are part of normal RNA processing in eukaryotes. Therefore, termination sites are often best characterized in vitro. The ability of the enzyme to terminate in vitro, however, is strongly influenced by parameters such as the ionic strength and temperature at which the reaction is performed; as a result, termination at a particular position in vitro does not prove that this is the same site where it occurs in cells. If the same 3′ end is detected in vivo and with purified components in vitro, though, this is generally recognized as good evidence for the authentic site of termination.
FIGURES 17.27 and 17.28 summarize the two major features found in intrinsic terminators. First, intrinsic terminators—that is, those that do not require auxiliary rho factor (ρ), as described shortly—require a G+C–rich hairpin to form in the secondary structure of the RNA being transcribed. Thus, termination depends on the RNA product and is not determined simply by scrutiny of the DNA sequence during transcription. The second feature is a series of up to seven uracil residues (thymine residues in the DNA) following the hairpin stem but preceding the actual position of termination. Approximately 1,100 sequences in the E. coli genome fit these criteria, suggesting that more than half of the cell’s transcripts are terminated at intrinsic terminators. Rho-dependent terminators are defined by the need for addition of rho factor in vitro, and mutations show that the factor is involved in termination in vivo.

FIGURE 17.27 The DNA sequences required for termination are located upstream of the terminator sequence. Formation of a hairpin in the RNA may be necessary.
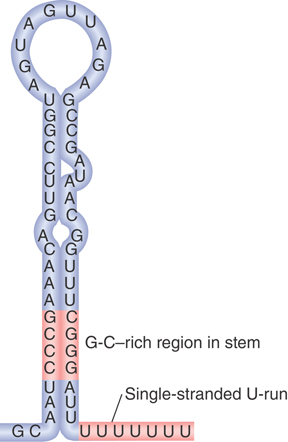
FIGURE 17.28 Intrinsic terminators include palindromic regions that form hairpins varying in length from 7 to 20 bp. The stem-loop structure includes a G-C–rich region and is followed by a run of U residues.
Terminators vary widely in their efficiencies. Readthrough transcripts refer to the fraction of transcripts that are not stopped by the terminator. (Readthrough is the same term used in translation to describe a ribosome’s suppression of termination codons.) Furthermore, the termination event can be prevented by specific ancillary factors that interact with RNA and/or RNA polymerase, a situation referred to as antitermination. Thus, as in the case of initiation or elongation, termination can be regulated as a mechanism for controlling gene expression.
Initiation and termination also have other parallels. Both require breaking of hydrogen bonds (initial melting of DNA at initiation and RNA–DNA dissociation at termination), and both can utilize additional proteins (sigma factors, activators, repressors, and rho factor) that interact with the core enzyme. Whereas initiation relies solely upon the interaction between RNA polymerase and duplex DNA, the termination event also involves recognition of signals in the transcript by RNA polymerase.
Point mutations that reduce termination efficiency usually occur within the stem region of the hairpin, replacing GC base pairs with weaker AT base pairs, or in the U-rich sequence, supporting the importance of these sequences in the mechanism of termination. The RNA–DNA hybrid makes a large contribution to the forces holding the elongation complex together. Thus, breaking the hybrid would destabilize the elongation complex, leading to termination. Interactions of the hairpin with the RNA polymerase or forces exerted by formation of the hairpin as the RNA emerges from the RNA exit channel can transiently misalign the 3′ end of the RNA with the active center in the enzyme. This misalignment, combined with the unusually weak RNA–DNA hybrid formed from the rU-dA RNA–DNA base pairs resulting from the stretch of U residues, destabilize the elongation complex.
Termination efficiency in vitro can vary widely, though, from 2% to 90%. The efficiency of termination depends not only on the sequences in the hairpin and the number and positions of U residues downstream of the hairpin but also on sequences both further upstream and downstream of the site of termination. Instead of terminating, the enzyme may simply pause before resuming elongation. These pause sites can serve regulatory purposes on their own (see the sections on the trp operon and attenuation in the chapter titled The Operon). Whether RNA polymerase arrests and releases the RNA chain or whether it merely pauses before resuming transcription (i.e., the duration of the pause and the efficiency of escape from the pause) is determined by a complex set of kinetic and thermodynamic considerations resulting from the characteristics of the hairpin and the U-rich stretch in the RNA and the upstream and downstream sequences in the DNA. For example, pausing can occur at sites that resemble terminators, but where the separation between the hairpin and the U-run is longer than optimal for termination.
17.16 How Does Rho Factor Work?
Rho factor is an essential protein in E. coli that causes transcription termination. The rho concentration may be as high as about 10% the concentration of RNA polymerase. Rho-independent termination accounts for almost half of E. coli terminators.
FIGURE 17.29 illustrates a model for rho function. First, it binds to a sequence within the transcript upstream of the site of termination. This sequence is called a rut site (an acronym for rho utilization). The rho factor then tracks along the RNA until it catches up to RNA polymerase. When the RNA polymerase reaches the termination site, rho first freezes the structure of the polymerase and then invades the exit channel to destabilize the enzyme, causing it to release the RNA. Pausing by the polymerase at the site of termination allows time for rho factor to translocate to the hybrid stretch and is an important feature of termination.

FIGURE 17.29 Rho factor binds to RNA at a rut site and translocates along RNA until it reaches the RNA–DNA hybrid in RNA polymerase, where it releases the RNA from the DNA.
We see an important general principle here. When we know the site on DNA at which some protein exercises its effect, we cannot assume that this coincides with the DNA sequence that it initially recognizes. They can be separate, and there need not be a fixed relationship between them. In fact, rut sites in different transcription units are found at varying distances preceding the sites of termination. A similar distinction is made by antitermination factors (see the section later in this chapter titled Antitermination Can Be a Regulatory Event).
What actually constitutes a rut site is somewhat unclear. The common feature of rut sites is that the sequence is rich in C residues and poor in G residues and has no secondary structure. An example is given in FIGURE 17.30. C is by far the most common base (41%), and G is the least common base (14%). The length of rut sites also vary. As a general rule, the efficiency of a rut site increases with the length of the C-rich/G-poor region.
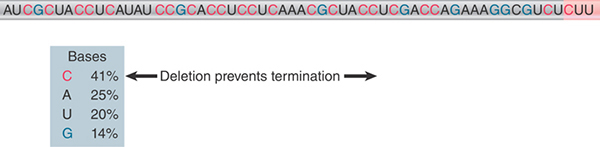
FIGURE 17.30 A rut site has a sequence rich in C and poor in G preceding the actual site(s) of termination. The sequence corresponds to the 3′ end of the RNA.
Rho is a member of the family of hexameric ATP-dependent helicases. Each subunit has an RNA-binding domain and an ATP hydrolysis domain. The hexamer functions by passing nucleic acid through the hole in the middle of the assembly formed from the RNA-binding domains of the subunits (FIGURE 17.31). The structure of rho gives some hints about how it might function. It winds RNA from the 3′ end around the exterior of the N-terminal domains, and pushes the 5′ end of the bound region into the interior, where it is bound by a secondary RNA-binding domain in the C-terminal domains. The initial form of rho is a gapped ring, but binding of the RNA converts it to a closed ring.
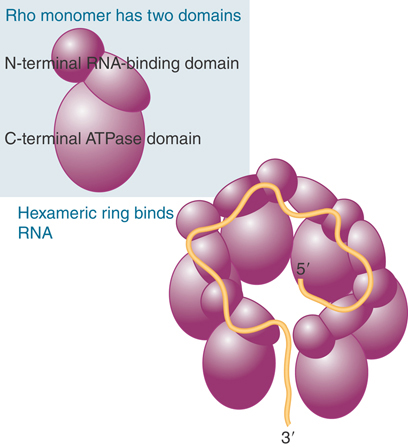
FIGURE 17.31 Rho has an N-terminal, RNA-binding domain and a C-terminal ATPase domain. A hexamer in the form of a gapped ring binds RNA along the exterior of the N-terminal domains. The 5′ end of the RNA is bound by a secondary binding site in the interior of the hexamer.
After binding to the rut site, rho uses its helicase activity, driven by ATP hydrolysis, to translocate along RNA until it reaches the RNA polymerase. It then may utilize its helicase activity to unwind the duplex structure and/or interact with RNA polymerase to help release RNA.
Rho needs to translocate along RNA from the rut site to the actual point of termination. This requires the factor to move faster than RNA polymerase. The enzyme pauses when it reaches a terminator, and termination occurs if rho catches it there. Pausing is therefore important in rho-dependent termination, just as in intrinsic termination, because it gives time for the other necessary events to occur.
The coupling between transcription and translation, unique to bacteria, has important consequences for rho action. Rho must first have access to RNA upstream of the transcription complex and then moves along the RNA to catch up with RNA polymerase. As a result, its activity is impeded when ribosomes are translating an mRNA. This model explains a phenomenon that puzzled early bacterial geneticists. In some cases, a nonsense mutation in one gene of a polycistronic transcription unit was found to prevent the expression of subsequent genes in the unit even though both genes had their own ribosome binding sites, an effect called polarity.
Rho-dependent termination sites within a transcription unit are usually masked by translating ribosomes (FIGURE 17.32), and therefore rho cannot act on downstream RNA polymerases. Nonsense mutations (forming stop codons) release ribosomes within the RNA of a multigene operon, though, enabling rho to terminate transcription prematurely and prevent expression of distal genes in the transcription unit even though their open reading frames contained wild-type sequences.

FIGURE 17.32 The action of rho factor may create a link between transcription and translation when a rho-dependent terminator lies soon after a nonsense mutation.
Why are stable RNAs (rRNAs and tRNAs) not subject to polarity? tRNAs are short and form extensive secondary structures that probably prevent rho binding. Parts of rRNAs also have extensive structure, but rRNAs are much longer than tRNAs, leaving ample opportunity for rho action. Cells have evolved another mechanism for preventing premature termination of rRNA transcripts, though: Proteins bind to so-called nut sites in the leader regions of the 16S/23S rRNA transcripts, forming antitermination complexes that inhibit the action of rho.
rho mutations show wide variations in their influence on termination. The basic nature of the effect is a failure to terminate. The magnitude of the failure, however, as seen in the percent of readthrough in vivo, depends on the particular target locus. Similarly, the need for rho factor in vitro is variable. Some (rho-dependent) terminators require relatively high concentrations of rho, whereas others function just as well at lower levels. This suggests that different terminators require different levels of rho factor for termination and therefore respond differently to the residual levels of rho factor in the mutants (rho mutants are usually leaky).
Some rho mutations can be suppressed by mutations in other genes. This approach provides an excellent way to identify proteins that interact with rho. The β subunit of RNA polymerase is implicated by two types of mutation. First, mutations in the rpoB gene can reduce termination at a rho-dependent site. Second, mutations in rpoB can restore the ability to terminate transcription at rho-dependent sites in rho-mutant bacteria. It is not known, however, what function the interaction plays.
17.17 Supercoiling Is an Important Feature of Transcription
Both prokaryotic and eukaryotic RNA polymerases usually seem to initiate transcription more efficiently in vitro when the template is supercoiled, and in some cases promoter efficiency is aided tremendously by negative supercoiling. Why are different promoters influenced more by the extent of supercoiling than others? The most likely possibility is that the dependence of a promoter on supercoiling is determined by the free energy needed to melt the DNA in the initiation complex. The free energy of melting, in turn, is dependent on the DNA sequence of the promoter. The more G+C rich the promoter sequence corresponding to the position of the transcription bubble, the more dependent the promoter would be on supercoiling to help melt the DNA.
However, whether a particular promoter’s activity is facilitated by supercoiling is much more complicated. The dependence of different promoters on the degree of supercoiling is also affected by DNA sequences outside of the bubble, because supercoiling changes the geometry of the complex, affecting the angles and distances between bases in space. Therefore, differences in the degree of supercoiling can alter interactions between bases in the promoter and amino acids in RNA polymerase. Furthermore, because different parts of the chromosome exhibit different degrees of supercoiling, the effect of supercoiling on a promoter’s activity can be influenced by the location of the promoter on the chromosome.
As RNA polymerase continually unwinds and rewinds the DNA as it moves down the template (illustrated in Figure 17.4), either the entire transcription complex must rotate around the DNA or the DNA itself must rotate about its helical axis. It is thought that the latter situation is closer to reality: The DNA threads through the enzyme like a screw through a bolt.
One consequence of the rotation of DNA is illustrated in FIGURE 17.33. In the twin domain model for transcription, as RNA polymerase moves with respect to the double helix it generates positive supercoils (more tightly wound DNA) ahead of it and leaves negative supercoils (partially unwound DNA) behind it. For each helical turn traversed by RNA polymerase, +1 turn is generated ahead and −1 turn behind. Transcription therefore not only is affected by the local structure of DNA but also affects the actual structure of the DNA. The enzymes DNA gyrase, which introduces negative supercoils into DNA, and DNA topoisomerase I, which removes negative supercoils in DNA, are required to prevent topological stresses from building up in the course of transcription and replication. Blocking the activities of gyrase and topoisomerase therefore results in major changes in DNA supercoiling, which, in turn, affect transcription and replication. This was discussed earlier in the context of replication (see the chapter titled The Replicon: Initiation of Replication).

FIGURE 17.33 Transcription generates more tightly wound (positively supercoiled) DNA ahead of RNA polymerase, while the DNA behind becomes less tightly wound (negatively supercoiled).
17.18 Phage T7 RNA Polymerase Is a Useful Model System
Certain bacteriophages (e.g., T3, T7, N4) make their own RNA polymerases, consisting of single polypeptide chains. These RNA polymerases recognize just a few promoters on the phage DNA, but they carry out many of the activities of the multisubunit RNA polymerases. Thus, they provide model systems for the study of specific transcription functions.
For example, the T7 RNA polymerase is a single polypeptide chain of less than 100 kD. It synthesizes RNA at a rate of about 300 nucleotides per second at 37°C, a rate that is much faster than that of the multisubunit RNA polymerase of its bacterial host and faster than the ribosomes that translate its mRNAs. Thus, T7-directed transcription would be subject to transcriptional polarity if it were not for the fact that transcription by T7 RNA polymerase occurs only later in infection, when rho expression is limited.
The T7 RNA polymerase is homologous to DNA and RNA polymerases in that the catalytic cores of all three enzymes have similar structures. The DNA lies in a “palm” surrounded by “fingers” and a “thumb,” and the enzymes use an identical catalytic mechanism. Several crystal structures of the T7 and N4 RNA polymerases are now available.
T7 RNA polymerase recognizes its target sequence in DNA by binding to bases in the major groove, as shown in FIGURE 17.34, using a specificity loop formed by a β ribbon. This feature is unique to the single-subunit RNA polymerases (it is not found in DNA polymerases). Like the multisubunit RNA polymerases, the promoter consists of specific bases in DNA upstream of the transcription start site, although T7 promoters consist of fewer bases than promoters typically recognized by multisubunit RNA polymerases.
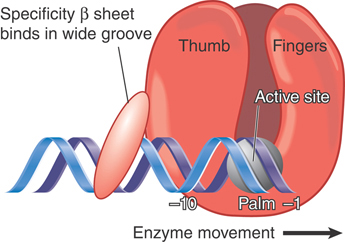
FIGURE 17.34 T7 RNA polymerase has a specificity loop that binds positions −7 to −11 of the promoter while positions −1 to −4 enter the active site.
The transition from the promoter initiation complex to the elongation complex is accomplished by two major conformational changes in the enzyme. First, as with the multisubunit RNA polymerases, the template is “scrunched” in the active site, and the enzyme remains bound to the promoter as the polymerase undergoes abortive synthesis, producing short transcripts from 2 to 12 nucleotides in length. The promoter-binding domain would present an obstacle to abortive product formation if it were not for the fact that it is moved out of the way by a rotation of approximately 45°, allowing the polymerase to maintain promoter contacts during synthesis of the initial RNA transcript. This is analogous to the displacement of the sigma factor domain 3–domain 4 linker from the RNA exit channel during the initial stages of RNA synthesis in the multisubunit bacterial RNA polymerase. The RNA emerges to the surface of the enzyme when 12 to 14 nucleotides have been synthesized. An even larger conformational change occurs next, in which a subdomain called region H moves more than 70 Å from its location in the initiation complex. This massive structural reorganization of the N-terminal domain upon formation of the elongation complex creates a tunnel through which the RNA transcript can exit, as well as a binding site for the single-stranded nontemplate DNA of the transcription bubble.
17.19 Competition for Sigma Factors Can Regulate Initiation
In the next few sections, we provide a few examples of regulation of initiation, elongation, and termination. Other examples will be presented in the chapters titled The Operon and Phage Strategies.
The division of labor between a core enzyme responsible for chain elongation and a sigma factor responsible for promoter selection raised the question of whether there would be more than one type of sigma factor, each specific for a different set of promoters. FIGURE 17.35 shows the principle of a system in which a substitution of the sigma factor changes the choice of promoter.

FIGURE 17.35 The sigma factor associated with core enzyme determines the set of promoters at which transcription is initiated.
E. coli often uses alternative sigma factors to respond to changes in environmental or nutritional conditions; they are listed in TABLE 17.2 (sigma factors are named by the molecular weight of the product or by the function of the genes they transcribe). The most abundant sigma factor, responsible for transcription of most genes under normal conditions, is σ70 (called σA in most bacterial species) and is encoded by the rpoD gene. The alternative sigma factor σS (σ38) is used for making many stress-related products; σH (σ32) and σE (σ24) are required for making products needed for responding to conditions that unfold proteins in the cytoplasm and periplasm, respectively; σN (σ54) makes products needed primarily for nitrogen assimilation; σFecI (σ19) makes a few products needed for iron transport; and σF (σ28) expresses products needed for synthesis of flagella.
TABLE 17.2 In addition to σ70, E. coli has several sigma factors that are induced by particular environmental conditions. (A number in the name of a factor indicates its mass.)
| Gene | Factor | Use |
|---|---|---|
| rpoD | σ70 | Most required functions |
| rpoS | σS | Stationary phase/some stress responses |
| rpoH | σ32 | Heat shock |
| rpoE | σE | Periplasmic/extracellular proteins |
| rpoN | σ54 | Nitrogen assimilation |
| rpoF | σF | Flagellar synthesis/chemotaxis |
| fecl | σfecl | Iron metabolism/transport |
The unfolded protein response is one of the most conserved regulatory responses in all of biology. Originally discovered as a response to an increase in temperature (and therefore called the heat-shock response), a similar set of proteins is synthesized in all three biological kingdoms that protect cells against environmental stress. Many of these heat-shock proteins are chaperones that reduce the levels of unfolded proteins by refolding them or degrading them. In E. coli, the induction of heat-shock proteins occurs at the transcription level. The gene rpoH is a regulator needed to switch on the heat-shock response. Its product, σ32, is an alternative sigma factor that recognizes the promoters of the heat-shock genes.
The heat-shock response (mostly chaperones and proteases) is feedback regulated. The key to the control of σ32 is that the availability of these cytoplasmic proteases and chaperones is dependent on whether they are titrated away by unfolded proteins. Thus, when unfolded protein levels go down (either because the heat-shock proteins refold or degrade them or because the temperature is lowered), they no longer titrate away the proteases that degrade σ32, and σ32 levels return to normal. Because σ70 and σ32 compete for available core enzyme, transcription from heat-shock gene promoters returns to basal levels as σ24 and σ32 levels go back to normal. Thus, the set of gene products made during heat shock depends on the balance between σ70 and σ32. Consistent with the importance of sigma competition, the concentration of σ70 is greater than that of core RNA polymerase under σ32 noninducing conditions.
σ32 is not the only sigma factor that controls the unfolded protein response. σE is induced by accumulation of unfolded proteins in the periplasmic space and outer membrane (rather than in the cytoplasm). As with σ32, proteolysis is the key to induction of transcription of σE-dependent promoters. The intricate circuit responsible for regulation of σE activity is summarized in FIGURE 17.36. σE binds to a protein (RseA) that is located in the inner membrane. RseA is an example of an antisigma factor. When bound to σE, RseA prevents σE from binding to core RNA polymerase and activating σE promoters. These promoters transcribe products needed for refolding denatured periplasmic proteins or degrading them. Thus, the periplasmic heat-shock response is a transient feedback response controlled by the concentrations of its own gene products. The σE regulon responds to the levels of unfolded and denatured periplasmic proteins rather than unfolded and denatured cytoplasmic proteins.
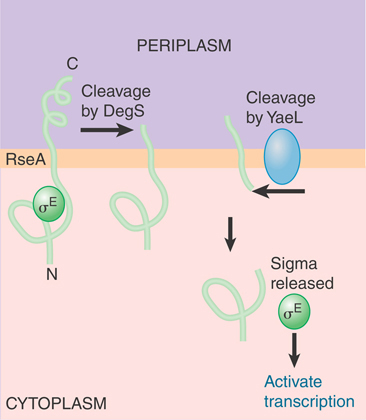
FIGURE 17.36 RseA is synthesized as a protein in the inner membrane. Its cytoplasmic domain binds the σE factor. RseA is cleaved sequentially in the periplasmic space and then in the cytoplasm. The cytoplasmic cleavage releases σE.
How does RseA know when to release σE? The mechanism involves regulated, sequential proteolysis of RseA. The accumulation of unfolded proteins activates a protease (DegS) in the periplasmic space, which cleaves off the C-terminal end of the RseA protein. This cleavage activates another protease, RseP, this time on the cytoplasmic face of the inner membrane. RseP cleaves the N-terminal region of RseA, ultimately releasing σE. σE can then bind core RNA polymerase and activate transcription. Thus, accumulation of unfolded proteins at the periphery of the bacterium activates the set of genes controlled by the sigma factor.
17.20 Sigma Factors Can Be Organized into Cascades
As in E. coli, sigma factors are used extensively to control initiation of transcription in the bacterium Bacillus subtilis. The B. subtilis genome encodes at least 18 different sigma factors, compared to the 7 found in E. coli. Larger numbers of sigma factors than in E. coli are not unusual. In fact, the Streptomyces coelicolor genome encodes more than 60!
In B. subtilis, some of the sigma factors are present in vegetative cells, whereas others are produced only in the special circumstances of phage infection or during the change from vegetative growth to sporulation. The major RNA polymerase engaged in normal vegetative growth contains the same subunits and has the same overall structure as that of E. coli, α2ββ′ωσ, but in addition it has another subunit called δ. Its major sigma factor (σA) recognizes promoters with the same consensus sequences used by the E. coli enzyme under direction from σ70. Alternative RNA polymerases containing different sigma factors are found in much smaller amounts and recognize promoters with different consensus sequences in the −35 and −10 regions.
Transitions from expression of one set of genes to another set are a feature of bacteriophage infection. This is the case in B. subtilis infection by the phage SPO1, as it is in E. coli infection by phages such as T7, N4, or Φλ. In all but the very simplest cases, the development of the phage involves shifts in the pattern of transcription during the infective cycle. These shifts may be accomplished by the synthesis of a phage-encoded RNA polymerase or by the efforts of phage-encoded ancillary factors that control the bacterial RNA polymerase. During infection of B. subtilis by phage SPO1, the different stages of infection are controlled via the production of new sigma factors.
The infective cycle of SPO1 has three stages of gene expression. Immediately on infection, the early genes of the phage are transcribed. After 4 to 5 minutes, the early genes cease transcription and the middle genes are transcribed. At 8 to 12 minutes, middle gene transcription is replaced by transcription of late genes.
The early genes are transcribed by the holoenzyme of the host bacterium. They are essentially indistinguishable from host genes whose promoters have the intrinsic ability to be recognized by the RNA polymerase α2ββ′ωσA.
Expression of phage genes is required for the transitions to middle and late gene transcription. Three regulatory genes—28,33, and 34—control the course of transcription. Their functions are summarized in FIGURE 17.37. The pattern of regulation resembles a cascade, in which the host enzyme transcribes an early gene whose product is needed to transcribe the middle genes. After this transcription, two of the middle genes code for products that are needed to transcribe the late genes.
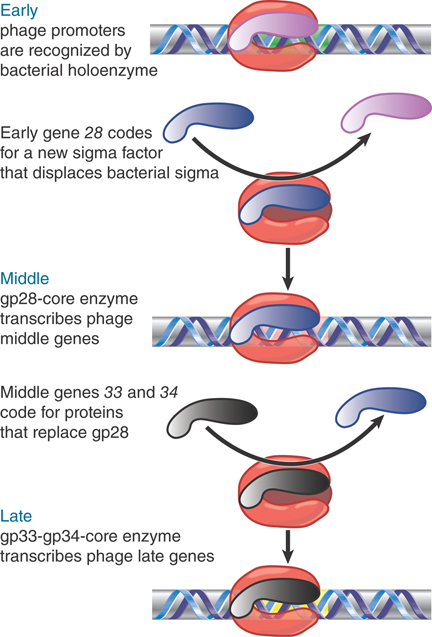
FIGURE 17.37 Transcription of phage SPO1 genes is controlled by two successive substitutions of the sigma factor that change the initiation specificity.
Mutants in the early gene 28 cannot transcribe the middle genes. The product of gene 28 (called gp28) is a 26-kD protein that replaces the host sigma factor on the core enzyme. This substitution is the sole event required to make the transition from early to middle gene expression. It creates a holoenzyme that can no longer transcribe the host genes but instead specifically transcribes the middle genes. It is not known how gp28 displaces σ43 or what happens to the host sigma polypeptide.
Two of the middle genes are involved in the next transition. Mutations in either gene 33 or 34 prevent transcription of the late genes. The products of these genes form a dimer that replaces gp28 on the core polymerase. Again, it is not known how gp33 and gp34 exclude gp28 (or any residual host σA), but once they have bound to the core enzyme, they are able to initiate transcription only at the promoters for late genes.
The successive replacements of sigma factor have dual consequences. Each time the subunit is changed the RNA polymerase becomes able to recognize a new class of genes and it no longer recognizes the previous class. These switches therefore constitute global changes in the activity of RNA polymerase.
17.21 Sporulation Is Controlled by Sigma Factors
A good example of the use of switching of holoenzymes to control changes in gene expression is provided by sporulation, an alternative lifestyle that occurs in many bacterial species. When logarithmic growth ceases because nutrients in the medium become depleted, the vegetative phase in growth of these bacteria ends. This triggers sporulation, a developmental stage in which the cell is resistant to many kinds of environmental and nutritional stresses (illustrated in FIGURE 17.38). During spore formation in B. subtilis, one of the daughter genomes that results from DNA replication is segregated at one end of the cell, attached to the cell pole. A septum forms, generating two independent compartments: the mother cell and the forespore. The growing septum traps part of one chromosome in the forespore, and then a translocase (SpoIIIE) pumps the rest of the chromosome into the forespore. Eventually the forespore, with its engulfed chromosome, is surrounded by a tough coat, and this spore is stable almost indefinitely.

FIGURE 17.38 Sporulation involves the differentiation of a vegetative bacterium into a mother cell that is lysed and a spore that is released.
Sporulation takes approximately 8 hours. It can be viewed as a primitive sort of differentiation, in which a parent cell (the vegetative bacterium) gives rise to two different daughter cells with distinct fates: The mother cell is eventually lysed, and the spore that is released has an entirely different structure from the original bacterium.
Sporulation involves a drastic change in the biosynthetic activities of the bacterium, in which many genes are involved. Changes in gene expression resulting ultimately in the formation of the spore result primarily from changes in transcription initiation. Some of the genes that function in the vegetative phase are turned off during sporulation, but most continue to be expressed. Many genes specific for sporulation are expressed only during this period, though. At the end of sporulation, about 40% of the bacterial mRNA is sporulation specific.
New forms of RNA polymerase become active in sporulating cells; they contain the same core enzyme as vegetative cells, but have different proteins in place of the vegetative sigma factor, σA. The changes in transcriptional specificity are summarized in FIGURE 17.39. The principle is that in each compartment the existing sigma factor is successively displaced by a new sigma factor that causes transcription of a different set of genes. Communication between the compartments occurs in order to coordinate the timing of the changes in the forespore and mother cell.
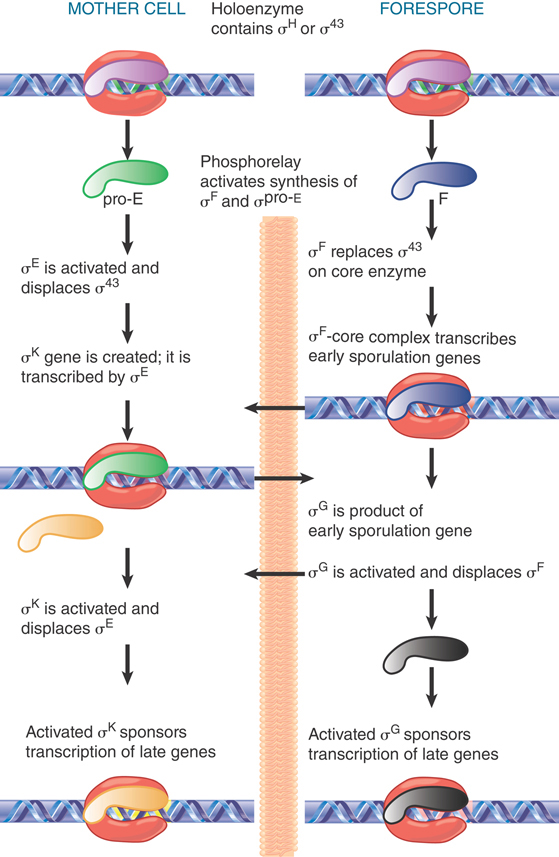
FIGURE 17.39 Sporulation involves successive changes in the sigma factors that control the initiation specificity of RNA polymerase. The cascades in the mother cell (left) and the forespore (right) are related by signals passed across the septum (indicated by horizontal arrows).
The sporulation cascade is initiated when environmental conditions trigger a phosphorelay, in which a phosphate group is passed along a series of proteins until it reaches a transcriptional regulator called SpoOA. Many gene products are involved in this process, whose complexity reflects the utilization of checkpoints—times when the bacterium confirms that it wishes to continue on the pathway to differentiation. This is not a regulatory course that should be undertaken unnecessarily, as the ultimate decision is irreversible.
Activation of SpoOA by phosphorylation marks the beginning of sporulation. In its phosphorylated form, SpoOA activates transcription of two operons, each of which is transcribed by a different form of the host RNA polymerase. Host enzyme utilizing the general sigma factor σA transcribes the gene coding for σF, and host enzyme under the direction of another sigma factor, σH, transcribes the gene encoding a precursor to the sigma factor σE. The precursor sigma factor is referred to as pro-σE. Both σF and pro-σE are produced before septum formation, but become active later.
Transcription directed by σF is inhibited because an antisigma factor (SpoIIAB) binds to it, preventing it from forming a holoenzyme. In the forespore, however, an anti-antisigma factor (SpoIIAA) inhibits the inhibitor. Inactivation of the anti-antisigma is controlled by a series of phosphorylation/dephosphorylation events, in which dephosphorylation by a phosphatase called SpoIIE is the first step. SpoIIE is an integral membrane protein that accumulates at the cell pole, with the result that its phosphatase domain becomes more concentrated in the forespore. In summary, dephosphorylation activates SpoIIAA, which, in turn, displaces SpoIIAB from σF. Release of σF activates it.
Activation of σF marks the start of cell-specific gene expression. Under the direction of σF, RNA polymerase transcribes the first set of sporulation genes. Not all transcription in the forespore comes from σF-directed transcription. σA is not destroyed during sporulation, and, therefore, the vegetative holoenzyme, EσA, remains in sporulating cells. (An “Eσ” holoenzyme refers to the polymerase enzyme plus a given sigma factor.)
The cascade continues as products derived from promoters recognized by EσF are made in the forespore (see FIGURE 17.40). For example, EσF makes a transcript encoding σG, which, in turn, forms the holoenzyme that transcribes the late sporulation genes. EσF also recognizes a promoter controlling expression of a product responsible for communicating with the mother cell compartment, SpoIIR, which is secreted from the forespore into the membrane separating the two compartments. In the membrane, SpoIIR activates the membrane-bound protein SpoIIGA, which cleaves inactive precursor pro-σE into active σE in the mother cell. (σE produced in the forespore is degraded.)
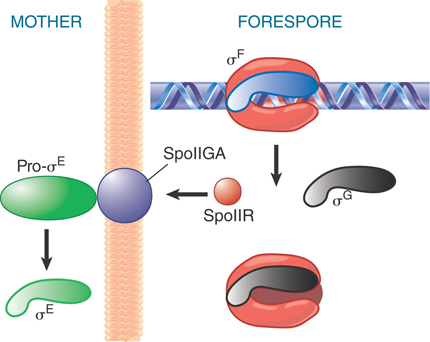
FIGURE 17.40 σF triggers synthesis of the next sigma factor in the forespore (σG) and turns on SpoIIR, which causes SpoIIGA to cleave pro-σE.
The cascade continues when σE in the mother cell is replaced by σK. (The production of σK is quite complex, because its gene is created by a site-specific recombination event!) Like σE, σK is also synthesized as an inactive precursor, pro-σK. Thus, σK has to be activated by cleavage of its precursor form before it can replace σE and transcribe late genes in the mother cell. The timing of these events in the two compartments is coordinated by still other signals. In summary, the activity of σE in the mother cell is necessary for activation of σG in the forespore, and the activity of σG is required to generate a signal that is transmitted across the septum to activate σK.
Sporulation is thus controlled by a cascade in which sigma factors in each compartment are successively activated by sigmas F, E, G, and K, each directing the synthesis of a particular set of genes. The cascade can be represented by a crisscross pattern of signals crossing the septum, connecting gene expression in one compartment with that in the other, as illustrated in FIGURE 17.41. As new sigma factors become active, old sigma factors are displaced, turning sets of different genes on and off in the two compartments.
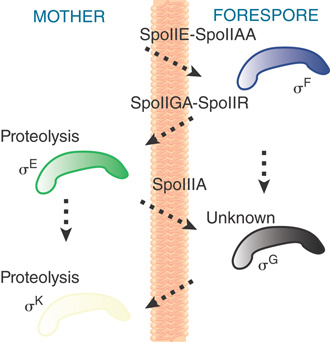
FIGURE 17.41 The crisscross regulation of sporulation coordinates timing of events in the mother cell and forespore.
17.22 Antitermination Can Be a Regulatory Event
Antitermination is used as a mechanism for control of transcription in both phage and bacterial operons. As shown in FIGURE 17.42, antitermination refers to modification of the enzyme, which allows it to read past a terminator into genes that lie downstream. In the example shown in the figure, the default pathway is for RNA polymerase to terminate at the end of region 1, but antitermination results in continued transcription through region 2.

FIGURE 17.42 Antitermination can control transcription by determining whether RNA polymerase terminates or reads through a particular terminator into the following region.
Antitermination systems are common in lambdoid bacteriophages (phages similar to phage lambda, described in the chapter titled Phage Strategies). Unlike the E. coli T7-like phages and the B. subtilis SPO1 phages discussed earlier, lambda does not encode either its own dedicated RNA polymerase or even its own dedicated sigma factors. Rather, it uses the host multisubunit RNA polymerase for all of its transcription. Shortly after phage infection, transcription begins at two early promoters, PR and PL. However, terminators in each of these operons follow the transcription start site before most of the genes that encode most early functions, and termination of transcription at these positions aborts the infection. If RNA polymerase reads through the terminators and transcribes the early genes responsible for replication of the phage genome, though, lambda development proceeds.
The first termination decision is controlled by an antitermination protein called N, which is the first protein produced by expression from PL. N forms a complex with host proteins called Nus factors (N utilization substances) to modify RNA polymerase in such a way that it no longer responds to the terminators. The antitermination complex actually forms on the nascent RNA at a sequence called nut (N utilization site). nut sites consist primarily of RNA sequences called boxA and boxB where the host factors NusA, NusB, NusE (ribosomal protein S10), and NusG assemble. The antitermination proteins remain bound to these RNA sites as a persistent antitermination complex as RNA polymerase synthesizes the two transcripts to the right and the left. Thus, the nascent RNA physically connects the antitermination proteins bound to the nut site with the RNA polymerase as it approaches terminators. Although the actual mechanism by which the antitermination complex prevents termination is still not understood, tethering of the antitermination proteins to RNA polymerase through the nascent RNA explains its ability to antiterminate at successive terminators spaced hundreds or even thousands of bases downstream. The last protein produced by the N-antiterminated transcript from the other early promoter, PR, is named Q. Like N, Q is an antitermination protein. Q antiterminates transcription from the late promoter PR, which produces a transcript coding for the phage’s head and tail proteins. Thus, lambda gene expression occurs in two stages, each of which is controlled by antitermination (see the chapter titled Phage Strategies and FIGURE 17.43). Q enables RNA polymerase to read through terminators in the late transcription unit, but it does so by a completely different mechanism than N. Unlike N, Q binds DNA (at the qut, Q utilization, site), but like N it travels with RNA polymerase and somehow interferes with the action of terminators throughout the late operon. It appears that the action of Q involves acceleration of RNA polymerase through pause sites. (We discuss the overall regulation of lambda development in the chapter titled Phage Strategies.)

FIGURE 17.43 An antitermination protein can act on RNA polymerase to enable it to read through a specific terminator.
rRNA operons might be expected to exhibit polarity, because they are long but are not translated. Each of the rRNA operons of E. coli, however, contains boxA- and boxB-like sequences that assemble antitermination complexes on the transcripts consisting of at least some of the same Nus factors as those utilized by phage lambda. These complexes do not contain an N- or Q-like factor, which are encoded only by phage genomes, but they are sufficient to prevent premature termination at the hairpin sequences and weak rho-dependent terminators that occur fortuitously within the rRNA structural genes. Antitermination is needed for efficient rRNA production all the time, not just when lambda infects cells. Thus, bacterial evolution did not select for the Nus factors to facilitate lambda gene expression. Rather, these factors undoubtedly evolved to prevent polarity in rRNA operons. The leader regions of the rrn operons contain boxA sequences that assemble the Nus factors as the boxA sequences in RNA emerge from the RNA exit channel. As with antitermination in lambda, this process somehow changes the properties of RNA polymerase in such a way that it can now read through terminators, although the mechanism remains unclear.
Summary
A transcription unit comprises the DNA between a promoter, where transcription initiates, and a terminator, where it ends. One strand of the DNA in this region serves as a template for synthesis of a complementary strand of RNA. The RNA–DNA hybrid region is short and transient, as the transcription “bubble” moves along DNA. The RNA polymerase holoenzyme that synthesizes bacterial RNA can be separated into two components. Core enzyme is a multimer containing the subunits α2ββ′ω that is sufficient for elongating the RNA chain. Sigma (σ) factor is a single subunit that is required only at the stage of initiation for recognizing the promoter.
Core enzyme has a general affinity for DNA. The addition of sigma factor reduces the affinity of the enzyme for nonspecific binding to DNA and increases its affinity for promoters. The rate at which RNA polymerase finds its promoters can be too rapid to be accounted for by random encounters with DNA by simple diffusion; transcription factors that recruit RNA polymerase to the DNA and direct exchange of the enzyme between one DNA sequence and another are likely to play a role in the promoter search.
Many bacterial promoters can be identified from the sequences of two 6-bp sequences centered at –35 and –10 relative to the start point, although other accessory promoter elements upstream from the –35 element (the UP element) and surrounding the –10 element (the extended –10 and discriminator regions) also contribute to promoter recognition. The distance separating the consensus sequences is almost always 16 to 18 bp. The enzyme can cover as much as about 75 bp of DNA. The initial “closed” binary complex is converted to an “open” binary complex by sequential melting of a sequence of about 14 bp that begins in the −10 region and extends to about 3 bp downstream from the start point. The A-T–rich base pair composition of the −10 sequence contributes to the melting reaction.
The binary complex is converted to a ternary complex by the incorporation of ribonucleotide precursors. Multiple cycles of abortive initiation typically occur, during which RNA polymerase synthesizes and releases very short RNA chains without escaping from the promoter. At the end of this stage, sigma is usually released, and the resulting core enzyme covers only ~35 bp of DNA rather than the twice that amount observed in the initiation complex. The core enzyme then moves down the template, unwinding the DNA as it synthesizes the RNA transcript.
The core enzyme can be directed to recognize promoters with different consensus sequences by alternative sigma factors. In E. coli, these sigma factors are activated by adverse conditions such as heat shock or nitrogen starvation. The geometry of the RNA polymerase–promoter complex is relatively similar for all holoenzymes. All sigma factors except σ54 recognize consensus elements located about 35 and 10 bp upstream from the transcription start site, making direct contacts with bases in these elements. The σ70 factor of E. coli has an N-terminal autoinhibitory domain that prevents the DNA-binding regions from recognizing DNA. The autoinhibitory region is displaced by DNA when the holoenzyme forms an open complex.
The “strength” of a promoter describes the frequency at which RNA polymerase initiates transcription; it is related to the closeness with which its promoter elements −35, −10, and other accessory elements conform to the ideal consensus sequences. Negative supercoiling increases the strength of certain promoters. Transcription generates positive supercoils ahead of RNA polymerase and leaves negative supercoils behind the enzyme.
B. subtilis contains a single major sigma factor with the same specificity as the major E. coli sigma factor, but it also contains a variety of minor sigma factors, some of which are activated sequentially during the process of sporulation; sporulation is regulated by a sigma factor cascade in which sigma factor replacements occur in the forespore and mother cell. Cascades involving sequential utilization of different RNA polymerases can also regulate transcription during bacteriophage infection and development.
Bacterial RNA polymerase terminates transcription at two types of sites. Intrinsic terminators contain a G-C–rich hairpin followed by a U-rich region. They are recognized in vitro by core enzyme alone. Rho-dependent terminators require rho factor both in vitro and in vivo; rho binds to rut sites that are rich in C and poor in G residues that precede the actual site of termination. Rho is a hexameric ATP-dependent helicase that translocates along the RNA until it reaches the RNA polymerase, where it dissociates the RNA polymerase from DNA. In both types of termination, pausing by RNA polymerase likely contributes to the termination event.
Antitermination is used by lambdoid phages to regulate progression from one stage of gene expression to the next. Multiprotein complexes containing the lambda phage N protein or Q protein, as well as Nus factors, can associate with RNA polymerase through RNA and perhaps DNA loops, respectively, and prevent transcription termination. The N-containing antitermination complex allows RNA polymerase to read through terminators located at the ends of the immediate early genes, whereas Q-containing antitermination complexes are required later in phage infection.
References
17.2 Transcription Occurs by Base Pairing in a “Bubble” of Unpaired DNA
Review
Losick, R., and Chamberlin, M. (eds.). (1976). RNA Polymerase. Cold Spring Harbor, NY: Cold Spring Harbor Laboratory.
Research
Revyakin, A., Liu, C., Ebright, R. H., and Strick, T. R. (2006). Abortive initiation and productive initiation by RNA polymerase involve DNA scrunching. Science 314, 1139–1143.
17.3 The Transcription Reaction Has Three Stages
Research
Kireeva, M. L., and Kashlev, M. (2009). Mechanism of sequence-specific pausing of bacterial RNA polymerase. Proc. Natl. Acad. Sci. USA 106, 8900–8905.
Rice, G. A., Kane, C. M., and Chamberlin, M. (1991). Footprinting analysis of mammalian RNA polymerase II along its transcript: an alternative view of transcription elongation. Proc. Natl. Acad. Sci. USA 88, 4245–4281.
Wang, D., Meier, T. I., Chan, C. L., Feng, G., Lee, D. N., and Landick, R. (1995). Discontinuous movements of DNA and RNA in RNA polymerase accompany formation of a paused transcription complex. Cell 81, 341–350.
17.4 Bacterial RNA Polymerase Consists of Multiple Subunits
Reviews
Helmann, J. D., and Chamberlin, M. (1988). Structure and function of bacterial sigma factors. Annu. Rev. Biochem. 57, 839–872.
Shilatifard, A., Conway, R. C., and Conway, J. W. (2003). The RNA polymerase II elongation complex. Annu. Rev. Biochem. 72, 693–715.
Research
Campbell, E. A., Korzheva, N., Mustaev, A., Murakami, K., Nair, S., Goldfarb, A., and Darst, S. A. (2001). Structural mechanism for rifampicin inhibition of bacterial RNA polymerase. Cell 104, 901–912.
Geszvain, K., and Landick, R. (2005). The structure of bacterial RNA polymerase. In The Bacterial Chromosome, Higgins, N. P. (ed.). Washington, DC: American Society for Microbiology Press, pp. 283–296.
Korzheva, N., Mustaev, A., Kozlov, M., Malhotra, A., Nikiforov, V., Goldfarb, A., and Darst, S. A. (2000). A structural model of transcription elongation. Science 289, 619–625.
Vassylyev, D. G., Vassylyeva, M. N., Perederina, A., Tahirov, T. H., and Artsimovitch, I. (2007). Structural basis for transcription elongation by bacterial RNA polymerase. Nature 448, 157–162.
Zhang, G., Campbell, E. A., Zhang, E. A., Minakhin, L., Richter, C., Severinov, K., and Darst, S. A. (1999). Crystal structure of Thermus aquaticus core RNA polymerase at 3.3 Å resolution. Cell 98, 811–824.
17.5 RNA Polymerase Holoenzyme Consists of the Core Enzyme and Sigma Factor
Research
Travers, A. A., and Burgess, R. R. (1969). Cyclic reuse of the RNA polymerase sigma factor. Nature 222, 537–540.
17.6 How Does RNA Polymerase Find Promoter Sequences?
Review
Bustamante, C., Guthold, M., Zhu, X., and Yang, G. (1999). Facilitated target location on DNA by individual Escherichia coli RNA polymerase molecules observed with the scanning force microscope operating in liquid. J. Bio. Chem. 274, 16665–16669.
17.7 The Holoenzyme Goes Through Transitions in the Process of Recognizing and Escaping from Promoters
Research
Bar-Nahum, G., and Nudler, E. (2001). Isolation and characterization of sigma(70)-retaining transcription elongation complexes from E. coli. Cell 106, 443–451.
Chen, J., Darst, S. A., and Thirumalai, D. (2010). Promoter melting triggered by bacterial RNA polymerase occurs in three steps. Proc. Natl. Acad. Sci. USA 107, 12523–12528.
Gries, T. J., Kontur, W. S., Capp, M. W., Saecker, R. M., and Record, M. T., Jr. (2010). One-step DNA melting in the RNA polymerase cleft opens the initiation bubble to form an unstable open complex. Proc. Natl. Acad. Sci. USA 107, 10418–10423.
Kapanidis, A. N., Margeat, E., Ho, S. O., Kortkhonjia, E., Weiss, S., and Ebright, R. H. (2006). Initial transcription by RNA polymerase proceeds through a DNA-scrunching mechanism. Science 314, 1144–1147.
Krummel, B., and Chamberlin, M. J. (1989). RNA chain initiation by E. coli RNA polymerase. Structural transitions of the enzyme in early ternary complexes. Biochemistry 28, 7829–7842.
Mukhopadhyay, J., Kapanidis, A. N., Mekler, V., Kortkhonjia, E., Ebright, Y. W., and Ebright, R. H. (2001). Translocation of sigma(70) with RNA polymerase during transcription. Fluorescence resonance energy transfer assay for movement relative to DNA. Cell 106, 453–463.
Wang, Q., Tullius, T. D., and Levin, J. R. (2007). Effects of discontinuities in the DNA template on abortive initiation and promoter escape by E. coli RNA polymerase. J. Biol. Chem. 282, 26917–26927.
17.8 Sigma Factor Controls Binding to DNA by Recognizing Specific Sequences in Promoters
Reviews
Haugen, S. P., Ross, W., and Gourse R. L. (2008). Advances in bacterial promoter recognition and its control by factors that do not bind DNA. Nature Rev. Micro. 6, 507–520.
McClure, W. R. (1985). Mechanism and control of transcription initiation in prokaryotes. Annu. Rev. Biochem. 54, 171–204.
Research
Bar-Nahum, G., and Nudler, E. (2001). Isolation and characterization of sigma(70)-retaining transcription elongation complexes from E. coli. Cell 106, 443–451.
Haugen, S. P., Ross., W., Manrique, M., and Gourse, R. L. (2008). Fine structure of the promoter–σ region 1.2 interaction. Proc. Natl. Acad. Sci. USA 105, 3292–3297.
Mukhopadhyay, J., Kapanidis, A. N., Mekler, V., Kortkhonjia, E., Ebright, Y. W., and Ebright, R. H. (2001). Translocation of sigma(70) with RNA polymerase during transcription. Fluorescence resonance energy transfer assay for movement relative to DNA. Cell 106, 453–463.
Ross, W., Gosink, K. K., Salomon, J., Igarashi, K., Zou, C., Ishihama, A., Severinov, K., and Gourse, R. L. (1993). A third recognition element in bacterial promoters: DNA binding by the alpha subunit of RNA polymerase. Science 262, 1407–1413.
17.9 Promoter Efficiencies Can Be Increased or Decreased by Mutation
Review
McClure, W. R. (1985). Mechanism and control of transcription initiation in prokaryotes. Annu. Rev. Biochem. 54, 171–204.
17.10 Multiple Regions in RNA Polymerase Directly Contact Promoter DNA
Research
Campbell, E. A., Muzzin, O., Chlenov, M., Sun, J. L., Olson, C. A., Weinman, O., Trester-Zedlitz, M. L., and Darst, S. A. (2002). Structure of the bacterial RNA polymerase promoter specificity sigma subunit. Mol. Cell 9, 527–539.
Dombrowski, A. J., Walter, W. A., Record, M. T., Jr., Siegele, D. A., and Gross, C. A. (1992). Polypeptides containing highly conserved regions of transcription initiation factor sigma 70 exhibit specificity of binding to promoter DNA. Cell 70, 501–512.
Mekler, V., Kortkhonjia, E., Mukhopadhyay, J., Knight, J., Revyakin, A., Kapanidis, A. N., Niu, W., Ebright, Y. W., Levy, R., and Ebright, R. H. (2002). Structural organization of bacterial RNA polymerase holoenzyme and the RNA polymerase-promoter open complex. Cell 108, 599–614.
Vassylyev, D. G., Sekine, S., Laptenko, O., Lee, J., Vassylyeva, M. N., Borukhov, S., and Yokoyama S. (2002). Crystal structure of a bacterial RNA polymerase holoenzyme at 2.6 Å resolution. Nature 417, 712–719.
17.11 RNA Polymerase–Promoter and DNA–Protein Interactions Are the Same for Promoter Recognition and DNA Melting
Reviews
Liu, X., Bushnell, D. A., and Kornberg, R. A. (2011) Lock and key to transcription: σ-DNA interaction. Cell 147, 1218–1219.
Siebenlist, U., Simpson, R. B., and Gilbert, W. (1980). E. coli RNA polymerase interacts homologously with two different promoters. Cell 20, 269–281.
Research
Feklis, A., and Darst, S. A. (2011). Structural basis for promoter −10 element recognition by the bacterial RNA polymerase σ subunit. Cell 147, 1257–1269.
17.12 Interactions Between Sigma Factor and Core RNA Polymerase Change During Promoter Escape
Research
Basu, R. S. Warnev, B. A., Molodtov, V., Pupov, D., Esyunina, D., Ferneadez-Tornero, C., Kulbachinsky, A., and Murakami, K. S. (2014). Structural basis of transcription initiation by bacterial RNA polymerase holoenzyme. J. Biol. Chem. 289, 24549–24559.
17.13 A Model for Enzyme Movement Is Suggested by the Crystal Structure
Reviews
Herbert, K. M., Greenleaf, W. J., and Block, S. M. (2008). Single-molecule studies of RNA polymerase: motoring along. Annu. Rev. Biochem. 77, 149–176.
Nudler, E. (2009). RNA polymerase active center: the molecular engine of transcription. Annu. Rev. Biochem. 78, 335–361.
Shilatifard, A., Conaway, R. C., and Conaway, J. W. (2003). The RNA polymerase II elongation complex. Annu. Rev. Biochem. 72, 693–715.
Research
Cramer, P., Bushnell, D. A., Fu, J., Gnatt, A. L., Maier-Davis, B., Thompson, N. E., Burgess, R. R., Edwards, A. M., David, P. R., and Kornberg, R. D. (2000). Architecture of RNA polymerase II and implications for the transcription mechanism. Science 288, 640–649.
Cramer, P., Bushnell, P., and Kornberg, R. D. (2001). Structural basis of transcription: RNA polymerase II at 2.8 Å resolution. Science 292, 1863–1876.
Gnatt, A. L., Cramer, P., Fu, J., Bushnell, D. A., and Kornberg, R. D. (2001). Structural basis of transcription: an RNA polymerase II elongation complex at 3.3 Å resolution. Science 292, 1876–1882.
17.14 A Stalled RNA Polymerase Can Restart
Review
Roberts, J. W. (2014). Molecular basis of transcription pausing. Science 344, 1226–1227.
Research
Kettenberger, H., Armache, K. J., and Cramer, P. (2003). Architecture of the RNA polymerase II-TFIIS complex and implications for mRNA cleavage. Cell 114, 347–357.
Larson, M. H., Mooney, R. A., Peters, J. M., Windgassen, T., Nayak, D., Gross, C. A., Block, S. M., Greenleaf, W. J., Landick, R., and Weissman, J. S. (2014). A pause sequence enriched at translation start sites drives transcription dynamics in vivo. Science 344, 1042–1047.
Opalka, N., Chlenov, M., Chacon, P., Rice, W. J., Wriggers, W., and Darst, S. A. (2003). Structure and function of the transcription elongation factor GreB bound to bacterial RNA polymerase. Cell 114, 335–345.
Vvedenskaya, I. O., Vahedian-Movahed, H., Bird, J. G., Knoblauch, J. G., Goldman, S. R., Zhang, Y., Ebright, R. H. and Nickels, B. E. (2014). Interactions between RNA polymerase and the “core recognition element” counteract pausing. Science 344, 1285–1289.
17.15 Bacterial RNA Polymerase Terminates at Discrete Sites
Reviews
Adhya, S., and Gottesman, M. (1978). Control of transcription termination. Annu. Rev. Biochem. 47, 967–996.
Friedman, D. I., Imperiale, M. J., and Adhya, S. L. (1987). RNA 3′ end formation in the control of gene expression. Annu. Rev. Genet. 21, 453–488.
Greenblat, J. F. (2008). Transcription termination: pulling out all the stops. Cell 132, 917–919.
Platt, T. (1986). Transcription termination and the regulation of gene expression. Annu. Rev. Biochem. 55, 339–372.
von Hippel, P. H. (1998). An integrated model of the transcription complex in elongation, termination, and editing. Science 281, 660–665.
Research
Lee, D. N., Phung, L., Stewart, J., and Landick, R. (1990). Transcription pausing by E. coli RNA polymerase is modulated by downstream DNA sequences. J. Biol. Chem. 265, 15145–15153.
Lesnik, E. A., Sampath, R., Levene, H. B., Henderson, T. J., McNeil, J. A., and Ecker, D. J. (2001). Prediction of rho-independent transcriptional terminators inE. coli. Nucleic Acids Res. 29, 3583–3594.
Reynolds, R., Bermadez-Cruz, R. M., and Chamberlin, M. J. (1992). Parameters affecting transcription termination by E. coli RNA polymerase. I. Analysis of 13 rho-independent terminators. J. Mol. Biol. 224, 31–51.
Weixlbaumer, A., Leon, K., Landick, R. and Darst, S. A. (2013). Structural basis of transcriptional pausing in bacteria. Cell 152, 431–441.
17.16 How Does Rho Factor Work?
Reviews
Das, A. (1993). Control of transcription termination by RNA-binding proteins. Annu. Rev. Biochem. 62, 893–930.
Richardson, J. P. (1996). Structural organization of transcription termination factor Rho. J. Biol. Chem. 271, 1251–1254.
von Hippel, P. H. (1998). An integrated model of the transcription complex in elongation, termination, and editing. Science 281, 660–665.
Research
Brennan, C. A., Dombroski, A. J., and Platt, T. (1987). Transcription termination factor rho is an RNA-DNA helicase. Cell 48, 945–952.
Geiselmann, J., Wang, Y., Seifried, S. E., and von Hippel, P. H. (1993). A physical model for the translocation and helicase activities of E. coli transcription termination protein Rho. Proc. Natl. Acad. Sci. USA 90, 7754–7758.
Roberts, J. W. (1969). Termination factor for RNA synthesis. Nature 224, 1168–1174.
Skordalakes, E., and Berger, J. M. (2003). Structure of the Rho transcription terminator: mechanism of mRNA recognition and helicase loading. Cell 114, 135–146.
17.17 Supercoiling Is an Important Feature of Transcription
Research
Wu, H.-Y., Shyy, S. H., Wang, J. C., and Liu, L. F. (1988). Transcription generates positively and negatively supercoiled domains in the template. Cell 53, 433–440.
17.18 Phage T7 RNA Polymerase Is a Useful Model System
Research
Cheetham, G. M., Jeruzalmi, D., and Steitz, T. A. (1999). Structural basis for initiation of transcription from an RNA polymerase-promoter complex. Nature 399, 80–83.
Cheetham, G. M. T., and Steitz, T. A. (1999). Structure of a transcribing T7 RNA polymerase initiation complex. Science 286, 2305–2309.
Temiakov, D., Mentesana, D., Temiakov, D., Ma, K., Mustaev, A., Borukhov, S., and McAllister, W. T. (2000). The specificity loop of T7 RNA polymerase interacts first with the promoter and then with the elongating transcript, suggesting a mechanism for promoter clearance. Proc. Natl. Acad. Sci. USA 97, 14109–14114.
17.19 Competition for Sigma Factors Can Regulate Initiation
Review
Hengge-Aronis, R. (2002). Signal transduction and regulatory mechanisms involved in control of the sigma(S) (RpoS) subunit of RNA polymerase. Microbiol. Mol. Biol. Rev. 66, 373–393.
Research
Alba, B. M., Onufryk, C., Lu, C. Z., and Gross, C. A. (2002). DegS and YaeL participate sequentially in the cleavage of RseA to activate the sigma(E)-dependent extracytoplasmic stress response. Genes Dev. 16, 2156–2168.
Grossman, A. D., Erickson, J. W., and Gross, C. A. (1984). The htpR gene product of E. coli is a sigma factor for heat-shock promoters. Cell 38, 383–390.
Kanehara, K., Ito, K., and Akiyama, Y. (2002). YaeL (EcfE) activates the sigma(E) pathway of stress response through a site-2 cleavage of anti-sigma(E), RseA. Genes Dev. 16, 2147–2155.
Sakai, J., Duncan, E. A., Rawson, R. B., Hua, X., Brown, M. S., and Goldstein, J. L. (1996). Sterol-regulated release of SREBP-2 from cell membranes requires two sequential cleavages, one within a transmembrane segment. Cell 85, 1037–1046.
17.21 Sporulation Is Controlled by Sigma Factors
Reviews
Errington, J. (1993). B. subtilis sporulation: regulation of gene expression and control of morphogenesis. Microbiol. Rev. 57, 1–33.
Haldenwang, W. G. (1995). The sigma factors of B. subtilis. Microbiol. Rev. 59, 1–30.
Losick, R., and Stragier, P. (1992). Crisscross regulation of cell-type specific gene expression during development in B. subtilis. Nature 355, 601–604.
Losick, R., Youngman, P., and Piggot, P. J. (1986). Genetics of endospore formation in B. subtilis. Annu. Rev. Genet. 20, 625–669.
Stragier, P., and Losick, R. (1996). Molecular genetics of sporulation in B. subtilis. Annu. Rev. Genet. 30, 297–341.
Research
Haldenwang, W. G., Lang, N., and Losick, R. (1981). A sporulation-induced sigma-like regulatory protein from B. subtilis. Cell 23, 615–624.
Haldenwang, W. G., and Losick, R. (1980). A novel RNA polymerase sigma factor from B. subtilis. Proc. Natl. Acad. Sci. USA 77, 7000–7004.
17.22 Antitermination Can Be a Regulatory Event
Review
Greenblatt, J., Nodwell, J. R., and Mason, S. W. (1993). Transcriptional antitermination. Nature 364, 401–406.
Research
Legault, P., Li, J., Mogridge, J., Kay, L. E., and Greenblatt, J. (1998). NMR structure of the bacteriophage lambda N peptide/boxB RNA complex: recognition of a GNRA fold by an arginine-rich motif. Cell 93, 289–299.
Mah, T. F., Kuznedelov, K., Mushegian, A., Severinov, K., and Greenblatt, J. (2000). The alpha subunit of E. coli RNA polymerase activates RNA binding by NusA. Genes Dev. 14, 2664–2675.
Mogridge, J., Mah, J., and Greenblatt, J. (1995). A protein-RNA interaction network facilitates the template-independent cooperative assembly on RNA polymerase of a stable antitermination complex containing the lambda N protein. Genes Dev. 9, 2831–2845.
Olson, E. R., Flamm, E. L., and Friedman, D. I. (1982). Analysis of nutR: a region of phage lambda required for antitermination of transcription. Cell 31, 61–70.