Each breakpoint (which includes breakpoints, watchpoints, and catchpoints) you create is assigned a unique integer identifier, starting at 1. This identifier is used to perform various operations on the breakpoint. The debugger also includes a means of listing all your breakpoints and their properties.
When you create a breakpoint, GDB tells you the number assigned to it. For instance, the breakpoint set in this example
(gdb) break main
Breakpoint 2 at 0x8048824: file efh.c, line 16.
was assigned the number 2. If you ever forget what number was assigned to which breakpoint, you can remind yourself with the info breakpoints command:
(gdb) info breakpoints
Num Type           Disp Enb Address    What
1   breakpoint     keep y   0x08048846 in Initialize_Game at efh.c:26
2   breakpoint     keep y   0x08048824 in main at efh.c:16
        breakpoint already hit 1 time
3   hw watchpoint  keep y              efh.level
4   catch fork     keep y
We'll see that these identifiers are used to perform various operations on breakpoints. To make this more concrete, a very quick example is in order.
In the previous section you saw the delete command. You could delete breakpoint 1, watchpoint 3, and catchpoint 4 by using the delete command with the identifiers for those breakpoints:
(gdb) delete 1 3 4
You'll see many other uses for breakpoint identifiers in the upcoming sections.
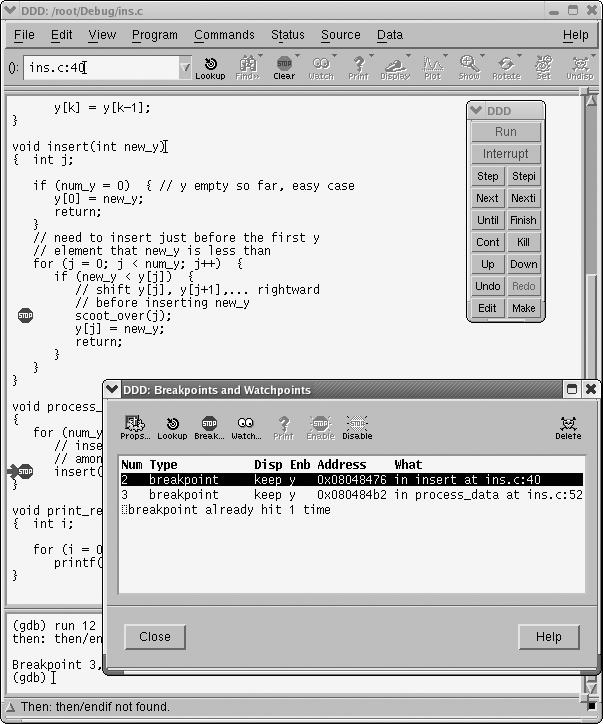
DDD users mainly perform breakpoint management operations with the point-and-click interface, so breakpoint identifiers are less important to DDD users than they are to GDB users. Selecting Source | Breakpoints will pop up the Breakpoints and Watchpoints window, listing all your breakpoints, as shown in Figure 2-1.
Recall, though, that DDD allows you to use GDB's command-based interface as well as the provided GUI. In some cases, GDB provides breakpoint operations that are not available through the DDD GUI, but the DDD user can access those special GDB operations via the DDD Console. In such cases, breakpoint identifiers can still be useful to DDD users.
Note that you can keep this Breakpoints and Watchpoints window open constantly if you wish, dragging it to a convenient part of your screen.
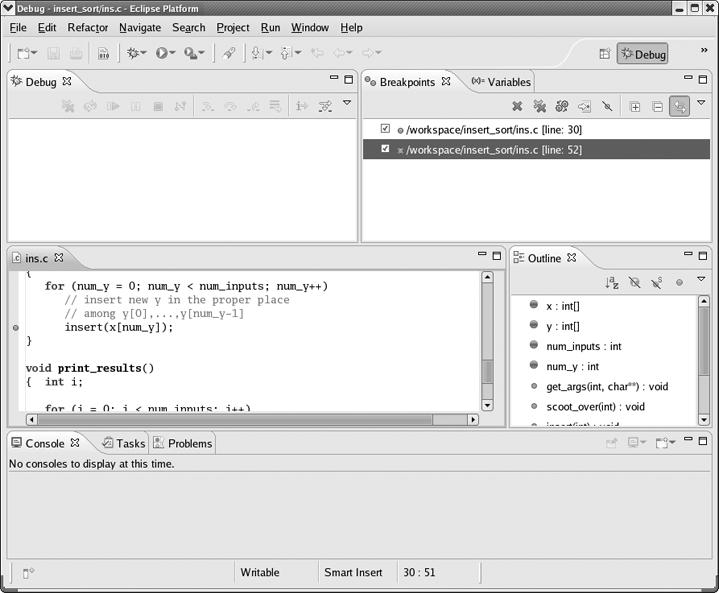
The Debug perspective includes a Breakpoints view. In Figure 2-2, for instance, you see that you currently have two breakpoints, at lines 30 and 52 of the file ins.c.
You can right-click the entry of any breakpoint to examine or change its properties. Also, double-clicking an entry will result in the focus of the source file window moving to that breakpoint.

