Our tree example here has greater complexity, and thus, more sophisticated methods are needed. We'll take a look at some here.
In earlier chapters you have used GDB's basic print command. How might you use it here? Well, the main work is obviously done in insert(), so that would be a good place to start. While running GDB within the while loop in that function, you could issue a set of three GDB commands each time you hit a breakpoint:
(gdb) p tmp->val
$1 = 12
(gdb) p tmp->left
$2 = (struct node *) 0x8049698
(gdb) p tmp->right
$3 = (struct node *) 0x0
(Recall from Chapter 1 that the output from GDB is labeled $1, $2, and so on, with these quantities collectively called the value history. We will discuss them further in Making Use of the Value History.)
Here you would find that the node currently pointed to by tmp contains 12, with a nonzero left pointer but a zero right pointer. Of course, the actual value of the left pointer, that is, the actual memory address, is probably not of direct interest here, but the fact that a pointer is nonzero or zero is important. The point is that you see that there currently is a left subtree below 12 but no right subtree.
- First improvement: Print the struct in its entirety
It would be quite laborious to keep typing those three
printcommands each time we reached a breakpoint. Here is how we could do the same thing with just oneprintcommand:(gdb) p *tmp $4 = {val = 12, left = 0x8049698, right = 0x0}Since
tmppoints to the struct,*tmpthen is the struct itself, and thus GDB shows us the entire contents.- Second improvement: Use the GDB
displaycommand Typing
p *tmpabove saves time and effort. Each time you hit a breakpoint, you would need to type only one GDB command, not three. But if you know you will type this each time you hit a breakpoint, you can save even more time and effort using GDB'sdisplaycommand, abbreviateddisp. This command tells GDB to automatically print the specified item each time there is a pause in execution (due to a breakpoint, thenextorstepcommands, and so on):(gdb) disp *tmp 1: *tmp = {val = 12, left = 0x8049698, right = 0x0} (gdb) c Continuing. Breakpoint 1, insert (btp=0x804967c, x=5) at bintree.c:37 37 if (x < tmp->val) { 1: *tmp = {val = 8, left = 0x0, right = 0x0}As seen here, GDB automatically printed
*tmpafter hitting the breakpoint, since you had issued thedisplaycommand.Of course, a variable in the display list will only be displayed during times in which it is in scope.
- Third improvement: Use the GDB
commandscommand Suppose you wish to look at the values in the child nodes when you are at a given node. Recalling GDB's
commandscommand from Chapter 1, you could do something like this:(gdb) b 37 Breakpoint 1 at 0x8048403: file bintree.c, line 37. (gdb) commands 1 Type commands for when breakpoint 1 is hit, one per line. End with a line saying just "end". >p tmp->val >if (tmp->left != 0) >p tmp->left->val >else >printf "%s\n", "none" >end >if (tmp->right != 0) >p tmp->right->val >else >printf "%s\n", "none" >end >end
Note in this example that GDB's
printcommand has a more powerful cousin,printf(), with formatting similar to that of its C-language namesake.Here is a sampling of the resulting GDB session:
Breakpoint 1, insert (btp=0x804967c, x=8) at bintree.c:37
37            if (x < tmp->val)
$7 = 12
none
none
(gdb) c
Continuing.

Breakpoint 1, insert (btp=0x804967c, x=5) at bintree.c:37
37            if (x < tmp->val)
$6 = 12
$7 = 8
none
(gdb) c
Continuing.

Breakpoint 1, insert (btp=0x804967c, x=5) at bintree.c:37
37            if (x < tmp->val)
$8 = 8
none
none
Of course, you could make the output fancier with labels, and so on.
- Fourth improvement: Use the GDB
callcommand A common approach in debugging is to isolate the first data item at which trouble appears. In the context here, that could be accomplished by printing out the entire tree each time you finish a call to
insert(). Since you have a function in your source file to do this anyway—printtree()—you could simply add a call to this function right after your call toinsert()in the source code:for (i = 1; i < argc; i++) { insert(&root,atoi(argv[i])); printtree(root); }However, this would be undesirable from various points of view. It would mean, for instance, that you would have to take time to edit your source file and recompile it. The former would be distracting and the latter could take some time if you had a large program. This, after all, is what you are trying to get away from by using a debugger.
Instead, it would be nice to do the same thing from within GDB. You can do this via GDB's
callcommand. For example, you could set a breakpoint at line 57, the end ofinsert(), and then do the following:(gdb) commands 2 Type commands for when breakpoint 1 is hit, one per line. End with a line saying just "end". >printf "*********** current tree ***********" >call printtree(root) >end
A sampling of the resulting GDB session is:
Breakpoint 2, insert (btp=0x8049688, x=12) at bintree.c:57
57 }
******** current tree ********
12
(gdb) c
Continuing.

Breakpoint 2, insert (btp=0x8049688, x=8) at bintree.c:57
57 }
*********** current tree ***********
8
12
(gdb) c
Continuing.

Breakpoint 2, insert (btp=0x8049688, x=5) at bintree.c:57
57 }
*********** current tree ***********
5
8
12
(gdb) c
Continuing.

Breakpoint 2, insert (btp=0x8049688, x=19) at bintree.c:57
57 }
*********** current tree ***********
19
12
Note that this shows that the first data item to cause trouble was the number 19. This information will allow you to zero in on the bug very quickly. You would re-run the program with the same data, setting a breakpoint at the beginning of
insert()but with the conditionx == 19, and then investigate what happens there.The command set for a given breakpoint can be modified dynamically, or simply canceled by redefining an empty set:
(gdb) commands 1
Type commands for when breakpoint 1 is hit, one per line.
End with a line saying just "end".
>end
As you know by now, you can invoke any GDB command from within DDD in the DDD Console Window. But one of the real advantages of DDD is that many of the GDB commands can be run more conveniently in DDD, and in some cases, DDD is capable of powerful operations not offered by GDB, such as the displaying of linked data structures described below.
As mentioned in earlier chapters, checking the value of a variable in DDD is highly convenient: Simply move the mouse pointer to any instance of the variable in the Source Code Window. But there are other goodies well worth using as well, especially for programs using linked data structures. We will illustrate that by using the same binary tree example from earlier in this chapter.
Recall the illustration of GDB's display command:
(gdb) disp *tmp
Here the contents of the struct pointed to by tmp are printed automatically each time you hit a breakpoint or otherwise cause the execution of your program to pause. Since tmp was a pointer to the current node in the tree, this automatic printing was helpful to monitoring your progress in traversing the tree.
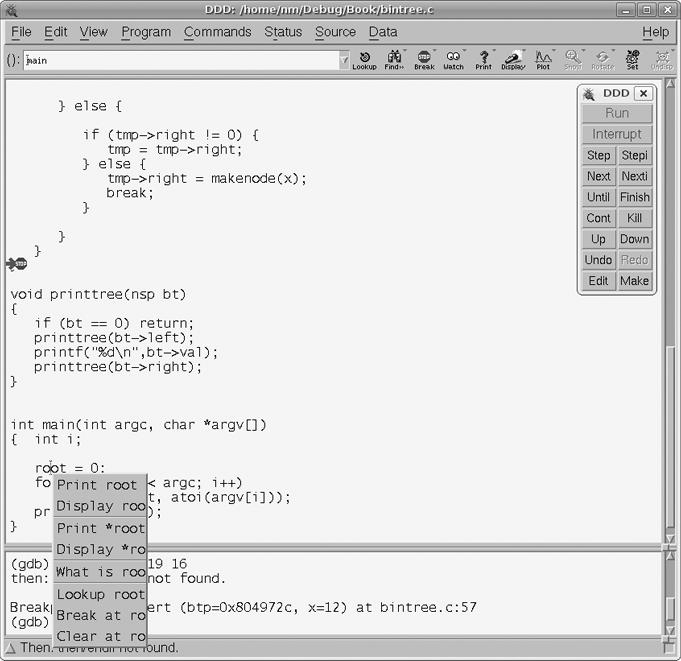
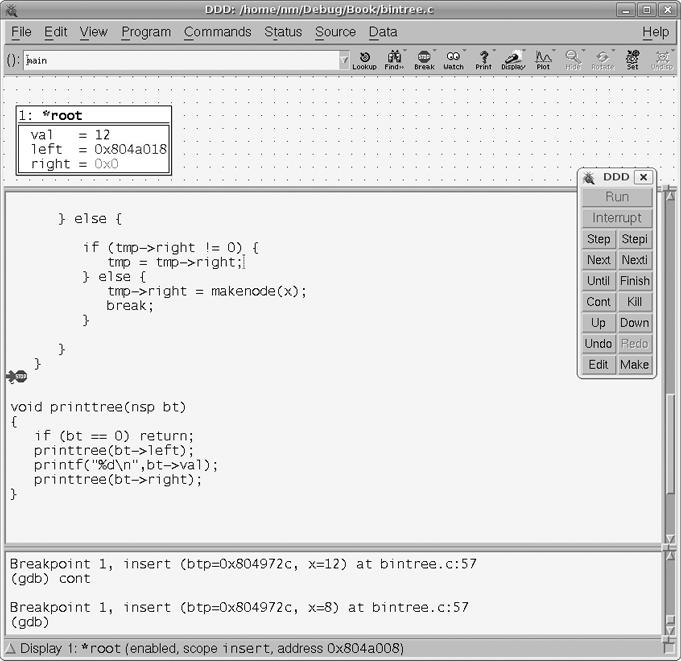
Somewhat analogous is the Display command in DDD. If you right-click any instance of a variable, say root in the example here, in the Source Code Window, a menu pops up, as seen in Figure 3-1. As you can see, you have a number of choices here with regard to viewing root. The choices Print root and Print *root work exactly like their GDB counterparts, and in fact their output appears in DDD's Console (where GDB commands are echoed/entered). But for the case at hand here, the most interesting choice is Display *root. The result of selecting that choice, after hitting the breakpoint at line 48 of the source code, is shown in Figure 3-2.
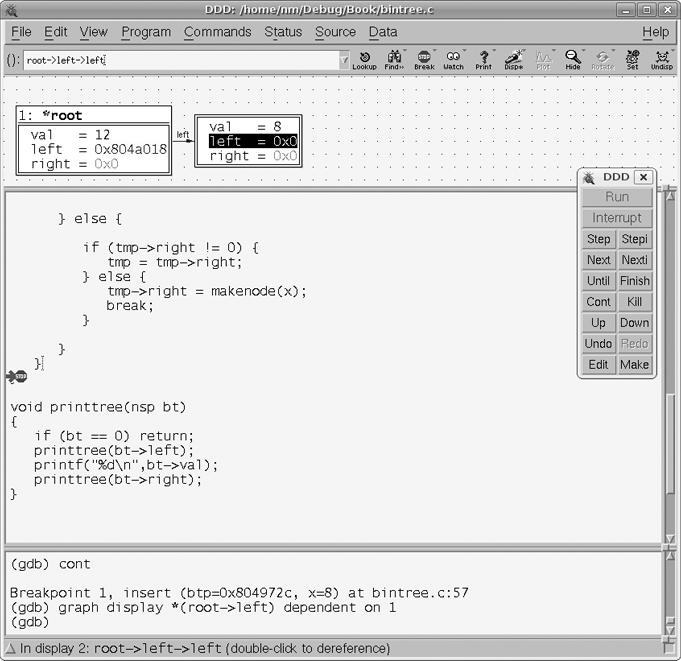
A new DDD window has appeared—the Data Window, with the node corresponding to root. So far, this is nothing more than just a graphical analog to GDB's display command. But what is really nice here is that you can follow the tree links! To follow the left branch of the tree, for instance, right-click the left field of the displayed root node. (You wouldn't do so on the right node at this time, since the link is 0.) Then select the Display *() choice in the pop-up menu, and now DDD is as seen in Figure 3-3. So, DDD is presenting you with a drawing of the tree (or this portion of it) just as you would write yourself on a blackboard—very cool!
The display of the contents of an existing node will automatically update whenever the node contents change. Each time a link changes from zero to nonzero, you can right-click it to display the new node.
Clearly, the Data Window can become cluttered quite quickly. You can expand the window by clicking and dragging the little square at the lower right of that window, but a better approach would be to anticipate this situation before you even start DDD. If you invoke DDD with the separate commandline option
$ ddd --separate bintree
then separate windows—Source Code, Console, and Data—will come up, which you can resize at will.
If you want to remove part or all of the contents of the Data Window during your DDD session, there are many ways to do it. You can, for instance, right-click an item, and then choose the Undisplay option.
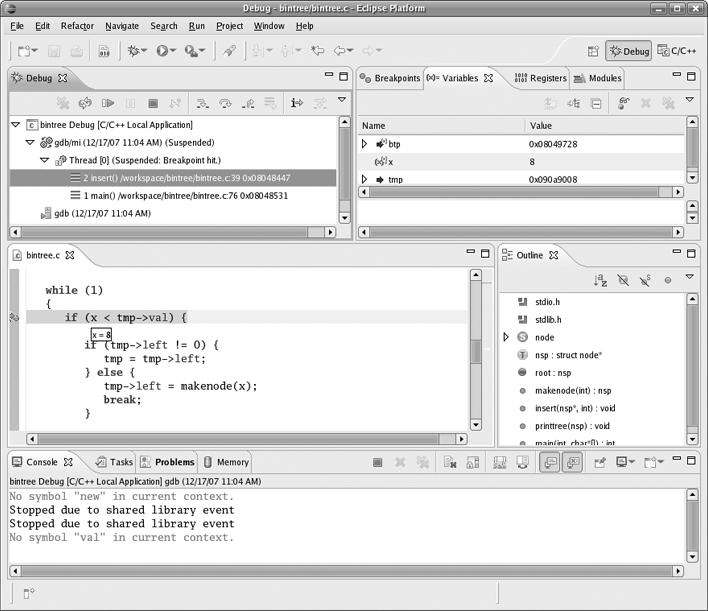
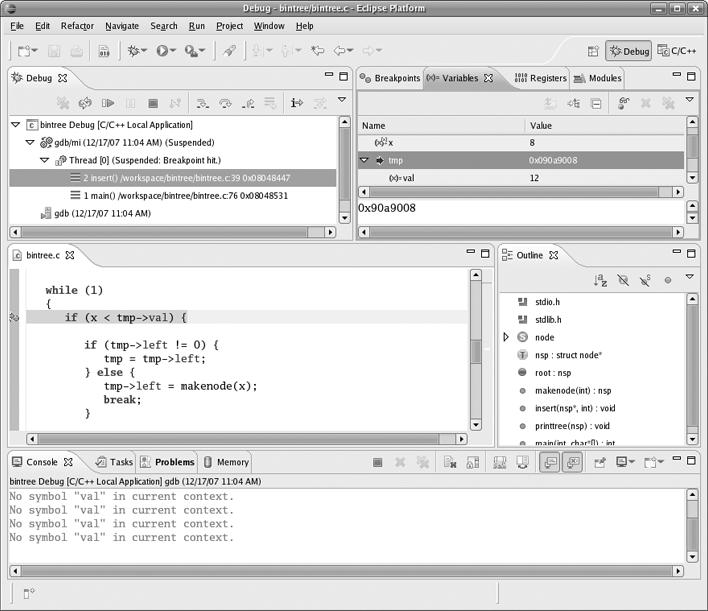
As with DDD, to inspect a scalar variable in Eclipse, just move the mouse pointer to any instance of the variable in the source code window. Note that this must be an independent scalar, not one within a struct, for example. This is illustrated in Figure 3-4. We have successfully queried the value of x here, but if we were to move the mouse pointer to the val portion of tmp->val in the same line, it would not tell us what's there.
At this point, you would make use of Eclipse's Variables view, which you can see in the upper-right portion of Figure 3-5. Click the triangle next to tmp to point it downward, then scroll down a line and find that tmp->val is displayed. (It turns out to contain 12.)
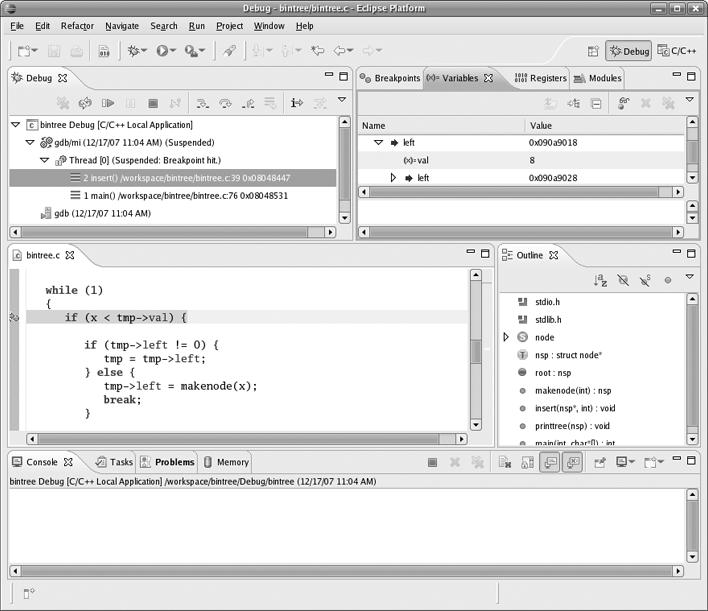
And you can continue this process. After clicking the triangle next to left, you'll find the screen shown in Figure 3-6, where you'll see that tmp->left->val is 8.
By default, the Variables view does not show global variables. In the program here, there is one, root. You can add that to the Variables view by right-clicking within that view, selecting Add Global Variables, checking the box for root in the resulting pop-up window, and then clicking OK.
As discussed in Chapter 1, in GDB you can print an entire array, say declared as
int x[25];
by typing
(gdb) p x
But what if the array had been created dynamically, say as
int *x;
...
x = (int *) malloc(25*sizeof(int));
If you wanted to print out the array in GDB, you could not type
(gdb) p x
This would simply print the address of the array. Nor could you type
(gdb) p *x
That would print out only one element of the array, x[0]. You could still print out individual elements, as in the command p x[5], but you could not print the entire array simply using the print command on x.
In GDB you can solve this problem by creating an artificial array. Consider the code
1  int *x;
2
3  main()
4  {
5     x = (int *) malloc(25*sizeof(int));
6     x[3] = 12;
7  }
Then you could do something like this:
Breakpoint 1, main () at artif.c:6
6          x = (int *) malloc(25*sizeof(int));
(gdb) n
7          x[3] = 12;
(gdb) n
8       }
(gdb) p *x@25
$1 = {0, 0, 0, 12, 0 <repeats 21 times>}As you can see, the general form is
*pointer@number_of_elements
GDB also allows casts to be used when appropriate, for example,
(gdb) p (int [25]) *x
$2 = {0, 0, 0, 12, 0 <repeats 21 times>}As always, you could utilize the GDB method, in this case artificial arrays, through the DDD Console.
Another option would be to print or display a range of memory (see Examining Memory Directly below).
Here you can use Eclipse's Display as Array command.
For instance, let's extend our earlier example a bit:
1  int *x;
2
3  main()
4  {
5      int y;
6      x = (int *) malloc(25*sizeof(int));
7      scanf("%d%d",&x[3],&x[8]);
8      y = x[3] + x[8];
9      printf("%d\n",y);
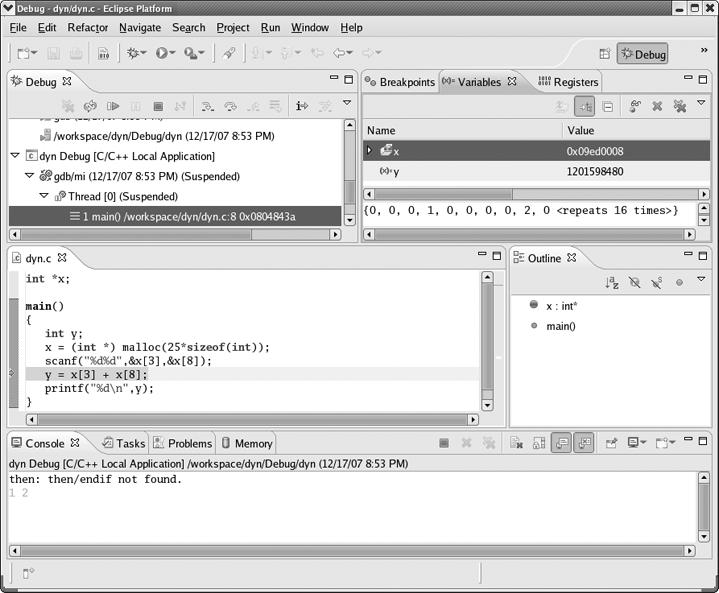
10 }Say you are currently at the assignment to y. You would first get x into the Variables view by right-clicking in that view and choosing x. You would then right-click x in the Variables view again, and select Display As Array. In the resulting pop-up box, you would fill in the Start Index and Length fields, say with 0 and 25 to display the entire array. The screen would now be as in Figure 3-7. You can see the array there in the Variables view, shown as
(0,0,0,1,0,0,0,0,2,0,<repeats 16 times>)
The values 1 and 2 came from our input to the program, seen in the Console view.
To illustrate the situation for C++ code, here is a C++ version of the binary tree example used earlier:
// bintree.cc: routines to do insert and sorted print of a binary tree in C++

#include <iostream.h>

class node {
   public:
      static class node *root;  // root of the entire tree
      int val;  // stored value
      class node *left;  // ptr to smaller child
      class node *right;  // ptr to larger child
      node(int x);  // constructor, setting val = x
      static void insert(int x);  // insert x into the tree
      static void printtree(class node *nptr);  // print subtree rooted at *nptr
};

class node *node::root = 0;

node::node(int x)
{
   val = x;
   left = right = 0;
}

void node::insert(int x)
{
   if (node::root == 0)  {
      node::root = new node(x);
      return;
   }
   class node *tmp=root;
   while (1)
   {
      if (x < tmp->val)
      {

         if (tmp->left != 0) {
            tmp = tmp->left;
         } else {
            tmp->left = new node(x);
            break;
         }

      } else {

         if (tmp->right != 0) {
            tmp = tmp->right;
         } else {
            tmp->right = new node(x);
            break;
         }

      }
   }
}

void node::printtree(class node *np)
{
   if (np == 0) return;
   node::printtree(np->left);
   cout << np->val << endl;
   node::printtree(np->right);
}

int main(int argc, char *argv[])
{
   for (int i = 1; i < argc; i++)
      node::insert(atoi(argv[i]));
   node::printtree(node::root);
}
You still compile as usual, making sure to tell the compiler to retain the symbol table in the executable file.[14].
The same GDB commands work, but with somewhat different output. For example, again printing out the contents of the object pointed to by tmp within insert(), you get the following output:
(gdb) p *tmp
$6 = {static root = 0x8049d08, val = 19, left = 0x0, right = 0x0}
This is similar to the case of the C program, except that now the value of the static variable node::root is printed as well (which it should be, since it is part of the class).
Of course, you do have to keep in mind that GDB needs you to specify variables according to the same scope rules that C++ uses. For example:
(gdb) p *root
Cannot access memory at address 0x0
(gdb) p *node::root
$8 = {static root = 0x8049d08, val = 12, left = 0x8049d18, right = 0x8049d28}
We needed to specify root via its full name, node::root.
GDB and DDD do not have built-in class browsers, but the GDB's ptype command is handy to get a quick review of the structure of a class or struct, for example,
(gdb) ptype node
type = class node {
  public:
    static node *root;
    int val;
    node *left;
    node *right;

    node(int);
    static void insert(int);
    static void printtree(node*);
}
In DDD, one can right-click the class or variable name, and then choose What Is in the pop-up menu to get the same information.
Eclipse has its Outline view, so you can easily get class information in that manner.
In GDB, you can get a list of values of all the local variables in the current stack frame by invoking the info locals command.
In DDD, you can even display the local variables by clicking Data | Display Local Variables. This will result in a section of the DDD Data Window being devoted to displaying the locals (updated as you step through the program). There appears to be no direct way of doing this within GDB, though you could do it on a per-breakpoint basis by including an info locals command within a commands routine for each breakpoint at which you wish to have the locals automatically printed out.
Eclipse displays the local variables in the Variables view, as you've seen.
In some cases, you might wish to examine memory at a given address, rather than via the name of a variable. GDB provides the x ("examine") command for this purpose. In DDD one selects Data | Memory, specifies the starting point and number of bytes, and chooses between Print and Display. Eclipse has a Memory view, in which you can create Memory Monitors.
This is normally useful mainly in assembly language contexts and is discussed in detail in Chapter 8.
The print and display commands allow you to specify alternative formats. For example,
(gdb) p/x y
will display the variable y in hex format instead of decimal. Other commonly used formats are c for character, s for string, and f for floating-point.
You can temporarily disable a display item. For instance,
(gdb) dis disp 1
temporarily disables item 1 in the display list. If you do not know the item numbers, you can check via the info disp command. To re-enable an item, use enable, for example,
(gdb) enable disp 1
To delete a display item entirely, use undisplay, for example,
(gdb) undisp 1
[14] There are various issues which may arise in this regard, though. See the GDB manual concerning executable file formats. The examples here use the G++ compiler (a C++ wrapper for GCC), with the -g option for specifying that the symbol table should be retained. We also tried the -gstabs option, which worked but with somewhat less-desirable results
