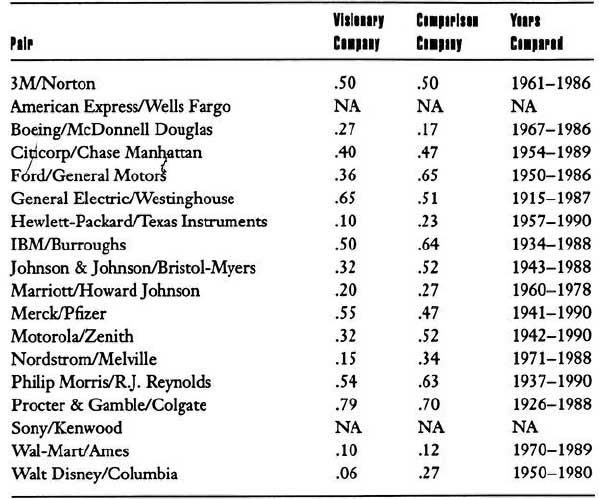
Table A.1
Categories Tracked Across the Entire History (From Founding Date to 1991) of the Visionary and Comparison Companies in our Research Study
Category 1: Organizing Arrangements. “Hard” items, such as organization structure, policies and procedures, systems, rewards and incentives, ownership structure, and general business strategies and activities of the company (e.g., acquisitions, significant changes in strategy, going public).
Category 2: Social Factors. “Soft” items, such as the company’s cultural practices, atmosphere, norms, rituals, mythology and stories, group dynamics, and management style.
Category 3: Physical Setting. Significant aspects of the way the company handled physical space, such as plant and office layout or new facilities. This included any significant decisions regarding the geographic location of key parts of the company.
Category 4: Technology. How the company used technology: information technology, state-of-the-art processes and equipment, advanced job configurations, and related items.
Category 5: Leadership. Leadership of the firm since its inception: the transition between key early shapers of the organization and later generations, leadership tenure, the length of time the leaders were with the organization before becoming CEO (Were they brought in from the outside or grown from within? When did they join?), leadership selection processes and criteria.
Category 6: Products and Services. Significant products and services in the company’s history. How did the product or service ideas come about? What guided their selection and development? Did the company have any product failures, and how did it deal with them? Did the company lead with new products or follow in the marketplace?
Category 7: Vision: Core Values, Purpose, and Visionary Goals. Were these variables present? If yes, how did they come into being? Did the organization have them at certain points in its history and not others? What role did they play? If it had strong values and purpose, did they remain intact or become diluted? Why?
Category 8: Financial Analysis. Ratio and spreadsheet analysis of all income statements and balance sheets for every year going back to the date when the company became public: sales and profit growth, gross margins, return on assets, return on sales, return on equity, debt to equity ratio, cash flow and working capital, liquidity ratios, dividend payout ratio, increase in gross property plant and equipment as a percentage of sales, asset turnover. We also examined stock returns and overall stock performance relative to the market.
Category 9: Markets/Environment. Significant aspects of the company’s external environment: major market shifts, dramatic national or international events, government regulations, industry structural issues, dramatic technology changes, and related items.
Table A.2
Sources of Information in Our Research Study
• Historical materials obtained directly from the companies: archive materials, historical documents (such as prospectuses from when the company went public), historical descriptions, internal publications, video footage, transcripts of interviews and speeches of alive and deceased leaders, corporate policy documents, historical and current vision (values, purpose, mission) statements, employee handbooks, training and socialization materials, and related materials.
• Books written about the industry, the company, and/or its leaders published either by the company or by outside observers. (We placed more weight on books written by outsiders). We obtained all books (old and new) available through the unified catalog of library listings at Stanford, University of California, Harvard, Yale, and Oxford.
• Articles written about the company. We did extensive literature searches from the time of the company’s founding up to the present and examined all major articles on each company through the decades from broad sources such as Forbes, Fortune, Business Week, Wall Street Journal, Nation’s Business, New York Times, U.S. News, New Republic, Harvard Business Review, The Economist, and selected articles from industry or topic specific sources such as Discount Merchandiser, Marketing, and Hotel and Restaurant Quarterly.
• Corporate annual reports and financial statements. In some cases, this involved nearly a hundred separate income statements and balance sheets for a single company.
• Harvard and Stanford Business School case studies and industry analyses. We obtained every available business case study on each company and each industry in our study.
• Financial databases, including the University of Chicago Center For Research in Security Prices (CRSP) Market Index Database, which gave us monthly stock returns for every company dated back to when first available.
• Interviews with key major figures, employees, ex-employees, and outside “experts” about the company or the industry (e.g., analysts and academics).
• Business and industry reference materials, such as the Biographical Dictionary of American Business Leaders, the International Directory of Company Histories, Hoover’s Handbook of Companies, Development of American Industries, and Movie Industry Almanac.
Table A.3
Leadership* as a Distinguishing Variable During Formative Stages?
* Leadership is defined as top executive(s) who displayed high levels of persistence, overcame significant obstacles, attracted dedicated people, influenced groups of people toward the achievement of goals, and played key roles in guiding their companies through crucial episodes in their history. NOTE: In selecting dates, we tried to cover the period during which the executive still had significant influence over the direction of the company; in some cases, the executive held numerous titles over the course of time—for example, president, CEO, chairman, and general manager. The point of this table is to show that both the visionary and comparison companies had such people during formative stages of evolution and, therefore, leadership so defined does not show up as a distinguishing variable.
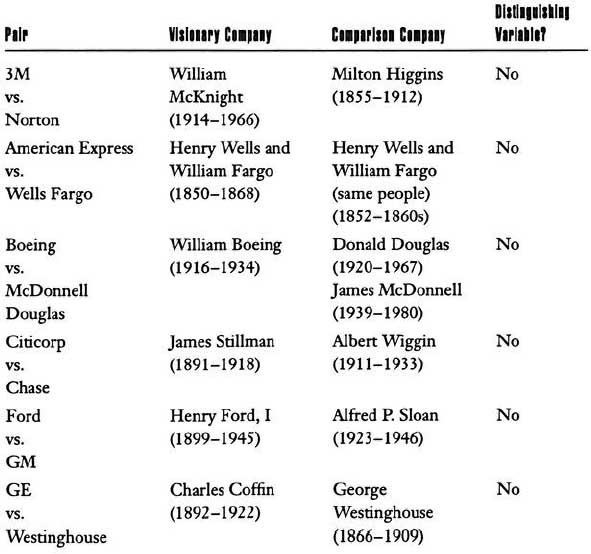
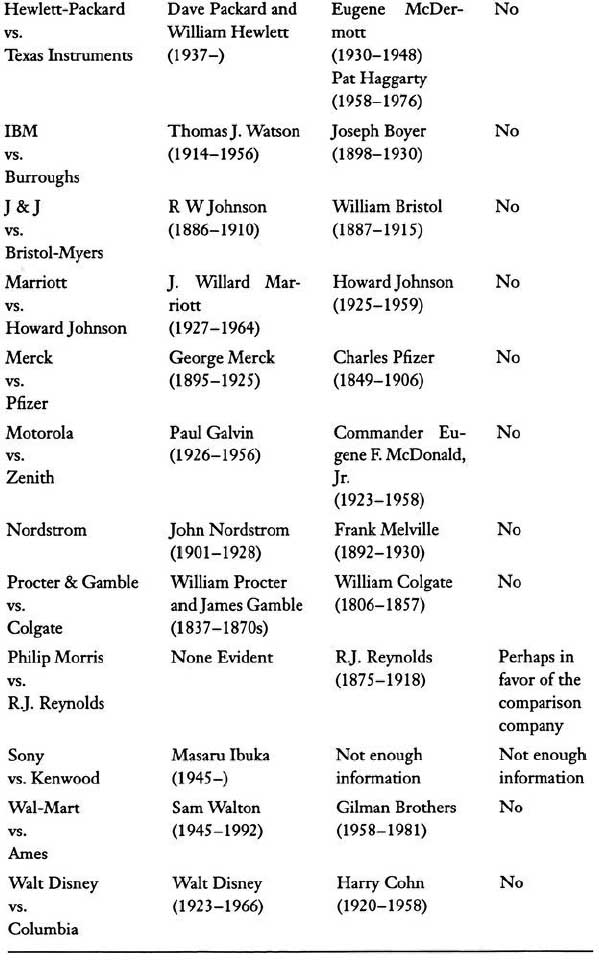
Table A.4
Evidence of Core Ideology
METHOD: In assessing the ideological nature of the visionary and comparison companies, we considered evidence along each of the following dimensions:
A: Statements of Ideology
B: Historical Continuity of Ideology
C: Ideology Beyond Profits
D: Consistency Between Ideology and Actions
In each category, we gave each visionary and comparison company a rating based on the evidence we had available. We then calculated an overall index based on a summation of the company’s ratings across these dimensions, scoring each “H” as a 3, each “M” as a 2, and each “L” as a 1.
A: Statements of Ideology
H: Significant evidence that the company stated an ideology (core values and/or purpose as per our definitions) with the intent to use the ideology as a source of guidance. Evidence that key members of the company spoke and/or wrote about the ideology more than a few times and that the ideology was communicated widely to people throughout the organization.
M: Some evidence that the company stated an ideology (core values and/or purpose as per our definitions) with the intent to use the ideology as a source of guidance. Some evidence that key members of the company spoke and/or wrote about the ideology, but perhaps only once or a few times, and some evidence that the ideology was communicated to people in the organization, but less than those that received an “H” on this dimension.
L: Little or no evidence that the company made any serious attempt to clarify and declare an ideology (core values and/or purpose as per our definitions).
B: Historical Continuity of Ideology
H: Evidence that the stated ideology discussed in Part A has changed little and has been continually emphasized throughout the company’s history since the time the ideology was first articulated.
M: Evidence that the stated ideology discussed in Part A has changed substantially and/or that the company has been sporadic in its references to the ideology through its history since the ideology was first articulated.
L: Little evidence of any continuity of an ideology through the history of the company.
C: Ideology Beyond Profits
H: Evidence of explicit discussions about the role of profitability or shareholder wealth as being only a part of the company’s objectives, and not the primary driving objective. Explicit use of phrases like “reasonable” returns, “adequate” returns, “fair” returns, “profitability as a necessary condition to pursue other aims,” rather than “maximal” or “highest” returns.
M: Evidence that profitability and shareholder returns are highly important—equal to or greater than other aims and values. Ideological concerns are also important, but noticeably less so (relative to profit motives) than the companies that receive an “H” on this dimension.
L: Evidence that the company is highly profit or shareholder wealth oriented with ideological concerns deeply subordinated to making money. Evidence that the company sees maximizing wealth as the reason for existence and number one goal far ahead of any other concerns.
D: Consistency Between Ideology and Actions
H: Significant evidence that the company’s ideology has been more than words on paper. Significant evidence (consistently throughout the company’s history) of major strategic (such as product, market, or investment) and/or organization design decisions (such as structure, incentive systems, policies) being guided by and consistent with the stated ideology.
M: Some evidence that the company’s ideology has been more than words on paper. Some evidence of major strategic (product, market, investment) and/or organization design decisions (structure, incentive systems, policies) being guided by and consistent with the stated ideology or that this has been less consistent through history than for those companies that receive an “H” on this dimension.
L: Little evidence of any guidance by the ideology and consistency between stated ideologies and corporate actions.
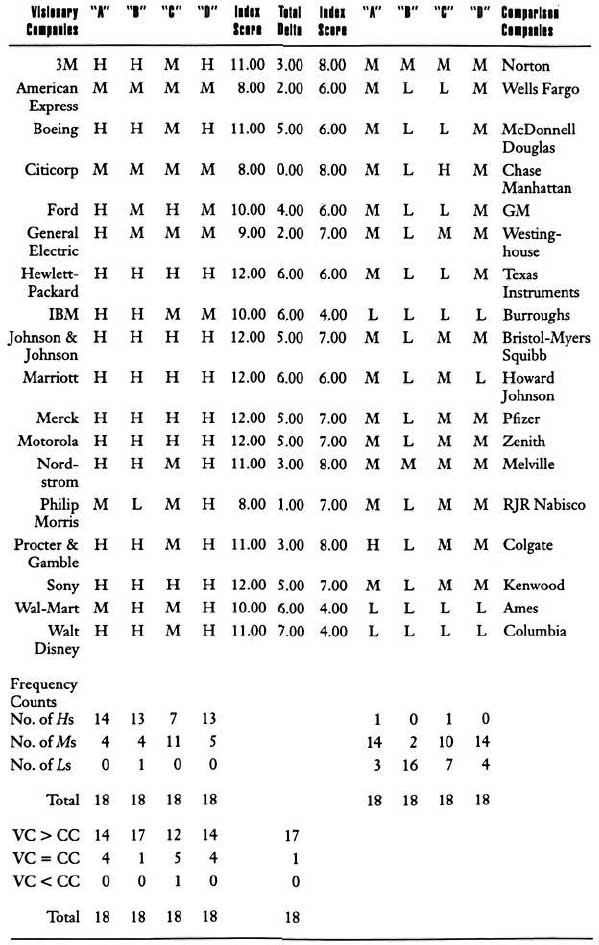
Table A.5
Evidence of BHAGs
METHOD: In assessing the use of BHAGs in the visionary and comparison companies, we considered evidence along each of the following dimensions:
A: Use of BHAGs
B: Audacity of BHAGs
C: Historical Pattern of BHAGs
In each category, we gave each visionary and comparison company a rating based on the evidence we had available. We then calculated an overall index based on a summation of the company’s ratings across these dimensions, scoring each “H” as a 3, each “M” as a 2, and each “L” as a 1.
A: Use of BHAGs
H: Significant evidence that the company used BHAGs to stimulate progress.
M: Some evidence that the company used BHAGs to stimulate progress, but less clear or prominent than those that received an “H.”
L: Little or no evidence that the company made any serious use of BHAGs in its history.
B: Audacity of BHAGs
H: Significant evidence that the BHAGs used were highly “audacious” (evidence that they were very difficult to achieve and/or highly risky).
M: Evidence that the BHAGs used were “audacious,” but significantly less risky or difficult to achieve than those that received an “H” on this dimension.
L: Little evidence that goals were highly audacious.
C: Historical Pattern of BHAGs
H: Evidence that the company had a repetitive historical pattern of BHAGs, or set BHAGs that transcended through multiple generations of leadership.
M: Less evidence (than those that received an “H”) of a repetitive historical pattern of BHAGs, or use of BHAGs that transcended through multiple generations of leadership.
L: Little evidence of a historical pattern of BHAGs in its history.

Table A.6
Evidence of Cultism
METHOD: In assessing cultism in the visionary and comparison companies, we considered evidence indicating that the company seeks to create an intense sense of loyalty and dedication and to influence the behavior of those inside the company to be consistent with the company’s ideology. We examined evidence along three key dimensions of cultlike environments:
A: Indoctrination
B: Tightness of Fit
C: Elitism.
In each category we gave each visionary and comparison company a rating based on the evidence we had available. We then calculated an overall index based on a summation of the company’s ratings across these dimensions, scoring each “H” as a 3, each “M” as a 2, and each “L” as a 1.
A: Indoctrination
H: Significant evidence that the company has a history of formal and/or tangible employee indoctrination processes. These processes might include:
— Orientation programs that teach such things as values, behavioral norms, corporate ideology, history, and tradition
— Ongoing “training” that has ideological content
— Internal publications: books, newspapers, and periodicals that reinforce ideology
— “On-the-job” ideological socialization by peers, immediate supervisors, and others
— Members of the company becoming the primary social group for new employees; employees being encouraged to socialize primarily with other employees
— Singing corporate songs, yelling corporate cheers
— Exposure to a mythology of “heroic deeds” by exemplar employees
— Use of unique language and terminology that reinforces a frame of reference
— Making pledges or affirmations
— Hiring young, promoting from within, shaping the employee’s mind-set from a young age; everyone starting at the bottom, so as to force people to “grow up” in the ideology
M: Some evidence that the company has a long history of formal and tangible employee indoctrination processes around the core ideology, but less prominent and/or less historically consistent than those that received an “H.”
L: Little or no evidence that the company has a long history of formal and/or tangible employee indoctrination processes around the core ideology.
B: Tightness of Fit
H: Significant evidence that the company has historically imposed “tightness of fit”—people tend to either fit well with the company or tend to not fit at all; the boundaries of “fit” are very tight (especially with respect to the company’s ideology). The company uses a variety of tangible methods to enforce tightness of fit, which might include:
— Tangible recognition and rewards for those who fit and tangible negative reinforcement and penalties for those who don’t fit (those who fit seem to be happy, rewarded, valued; those who don’t fit seem to be unhappy, unvalued, “left behind”)
— Tolerance for mistakes that do not breach the company’s ideology (“non-sins”); severe penalties for those who breach the ideology (“sins”)
— Tight screening processes, either during hiring or within the first few years
— Severe expectations of loyalty; penalties and/or sense of betrayal for perceived “lack of loyalty”
— Overtight behavioral norms and intrusive behavior control which tends to repel those who don’t fit
— Expectations of zealousness of behavior and espousement of the ideology
— Seeking buy-in (as in financial or time investment) which will tend to repel those not willing to fully “join”
M: Some evidence that the company has historically imposed “tightness of fit,” but less prominent and/or less historically consistent than those that received an “H.”
L: Little or no evidence that the company has historically imposed “tightness of fit.”
C: Elitism
H: Significant evidence that the company has historically reinforced a sense of belonging to something special and superior. Both parts of this are important—belonging and specialness. This can be reinforced in a variety of ways, such as:
— Continual verbal and written emphasis on being part of a special group, the elites
— An obsession with secrecy and control over information, especially in regard to the outside world
— Celebrations to reinforce successes, belonging, and specialness
— Use of names (“Motorolans,” “Nordies,” “Proctoids,” “Cast Members”) and special language to reinforce being part of a special group
— Lots of emphasis on a “family feeling”—all belonging to “a big, happy family”
— Physical isolation; that is, the company has its own facilities (post offices, restaurants, health clubs, social gathering places) that minimize the need for employees to deal with the outside world
M: Less evidence (than those that received an “H”) that the company has historically reinforced a sense of belonging to something special and superior.
L: Little or no evidence that the company has historically reinforced a sense of belonging to something special and superior.
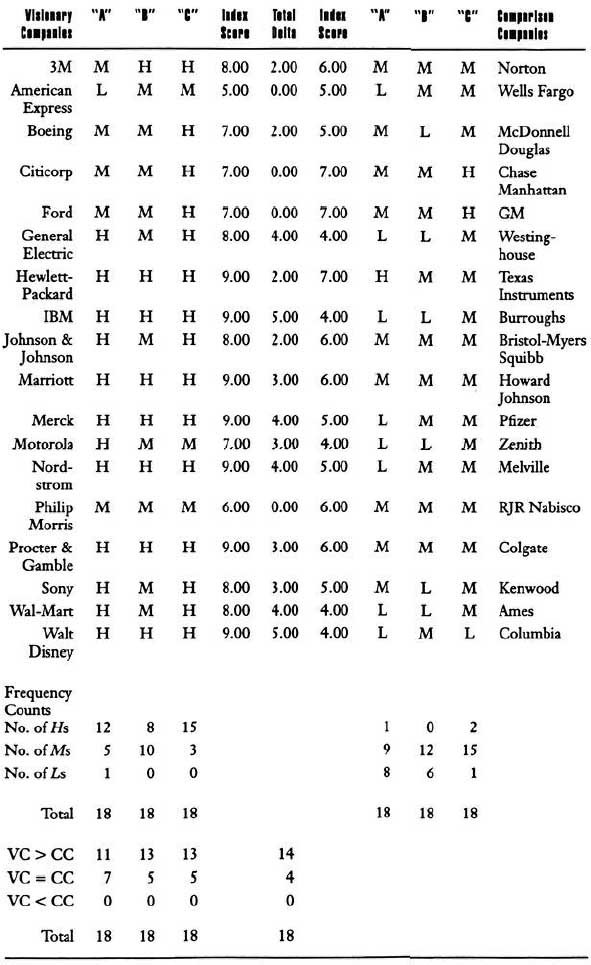
Table A.7
Evidence of Purposeful Evolution
METHOD: In assessing the use of evolutionary progress in the visionary and comparison companies, we considered evidence collected in the course of our study that would indicate purposeful evolution to stimulate progress. We examined evidence along three dimensions:
A: Conscious Use of Evolutionary Progress
B: Operational Autonomy to Stimulate and Enable Variation
C: Other Mechanisms to Stimulate and Enable Variation and Selection
In each category we gave each visionary and comparison company a rating based on the evidence we had available. We then calculated an overall index based on a summation of the company’s ratings across these dimensions, scoring each “H” as a 3, each “M” as a 2, and each “L” as a 1.
A: Conscious Use
H: Significant evidence that the company has a history of consciously embracing the concept of making progress by an evolutionary process of variation and selection. Although the company might also embrace other forms of progress (such as BHAGs, or self-improvement), it must also have made conscious use of evolutionary processes. Evidence that the company has, in fact, made some significant strategic shifts and moves stemming from use of this type of progress.
M: Some evidence that the company has a history of consciously embracing the concept of making progress by an evolutionary process of variation and selection, but less prominent and/or less historically consistent conscious adoption than those that received an “H.”
L: Little or no evidence that the company has a history of consciously embracing the concept of making progress by an evolutionary process of variation and selection.
B: Operational Autonomy
H: Significant evidence that the company has made historical use of operational autonomy as a means of enabling variation. Operational autonomy means that employees have wide personal discretion in how to go about fulfilling their responsibilities via decentralized organization structures and job designs that enable operational freedom.
M: Some evidence that the company has made historical use of operational autonomy as a means of enabling variation, but less prominent and/or less historically consistent conscious adoption than those that received an “H.”
L: Little or no evidence that the company has made historical use of operational autonomy as a means of enabling variation.
C: Other Mechanisms
H: Significant evidence that the company has a history of using a variety of mechanisms other than operational autonomy to stimulate and enable evolutionary progress via variation and selection. These mechanisms can be designed to stimulate creativity and new ideas, experimentation, opportunism (quick, vigorous action in response to unexpected opportunities), lack of penalties (or actual rewards) for mistakes, rewards for innovations and new directions, individual initiative, and incentives for creating new opportunities for the organization.
M: Some evidence that the company has a history of using a variety of mechanisms to stimulate and enable evolutionary progress via variation and selection, but less prominent and/or less historically consistent conscious adoption than those that received an “H.”
L: Little or no evidence that the company has a history of using a variety of mechanisms to stimulate and enable evolutionary progress via variation and selection.
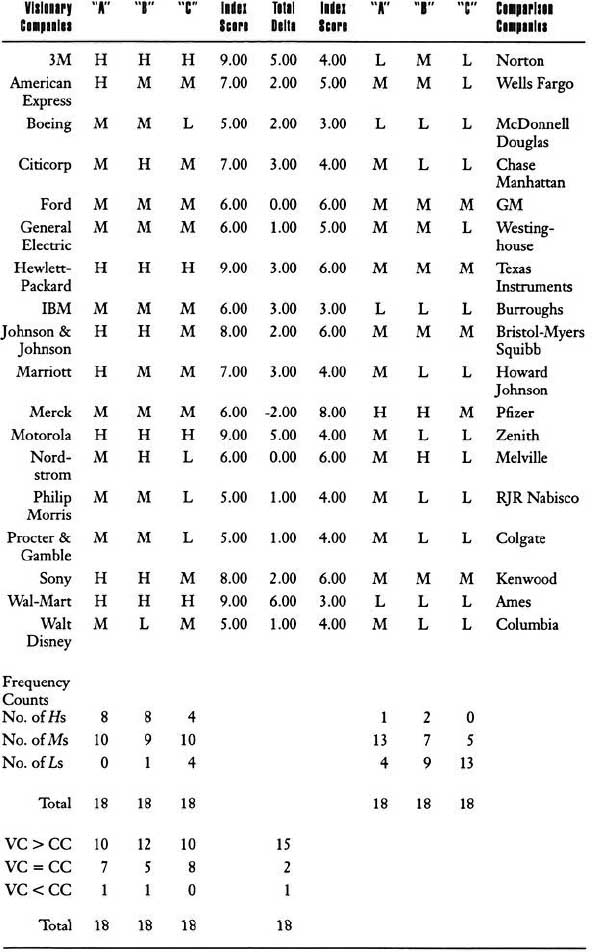
Table A.8
Evidence of Management Continuity
METHOD: In assessing management continuity in the visionary and comparison companies, we considered evidence along the following dimensions:
A: Internal Versus External Chief Executives
B: No “Post-Heroic-Leader Vacuum” or “Savior Syndrome”
C: Formal Management Development Programs and Mechanisms
D: Careful Succession Planning and CEO Selection Mechanisms.
In each category we gave each visionary and comparison company a raring based on the evidence we had available. We then calculated an overall index based on a summation of the company’s ratings across these dimensions, scoring each “H” as a 3, each “M” as a 2, and each “L” as a 1.
A: Internal/External
H: Significant evidence that the company has a history of selecting chief executive officers only from inside.
M: Evidence that the company has a history of selecting chief executive officers primarily from inside, but one or two deviations from this rule.
L: Evidence that the company has deviated from the “inside only” rule more than two times.
B: No “Post-Heroic-Leader Vacuum” or “Savior Syndrome”
H: No evidence that the company has experienced a “Post-heroic-leader vacuum” (a dearth of highly qualified successors after the departure of a strong CEO) or the “Savior Syndrome” (looking to the outside in times of trouble to find a “savior” who will come in and revive the company).
M: Evidence that the company has experienced a “Post-heroic-leader vacuum” or the “Savior Syndrome” at least once in its history.
L: Evidence that the company has experienced a “Post-heroic-leader vacuum” or the “Savior Syndrome” at least twice in its history.
C: Management Development Mechanisms
H: Significant evidence that the company has a history of conscious attention to management development via internal management training programs, rotation programs, conscious use of on-the-job experiences to develop managers, exposure to top management issues and thinking, and so on.
M: Some evidence that the company has a history of conscious attention to management development but less prominent and/or less historically consistent conscious adoption than those that received an “H.”
L: Little or no evidence that the company has a history of conscious attention to management development.
D: Succession Planning and CEO Selection Mechanisms
H: Significant evidence that the company has a history of careful succession planning and formal CEO selection mechanisms.
M: Some evidence that the company has a history of careful succession planning and formal CEO selection mechanisms, but less prominent and/or less historically consistent conscious adoption than those that received an “H.”
L: Little or no evidence that the company has a history of careful succession planning and formal CEO selection mechanisms.
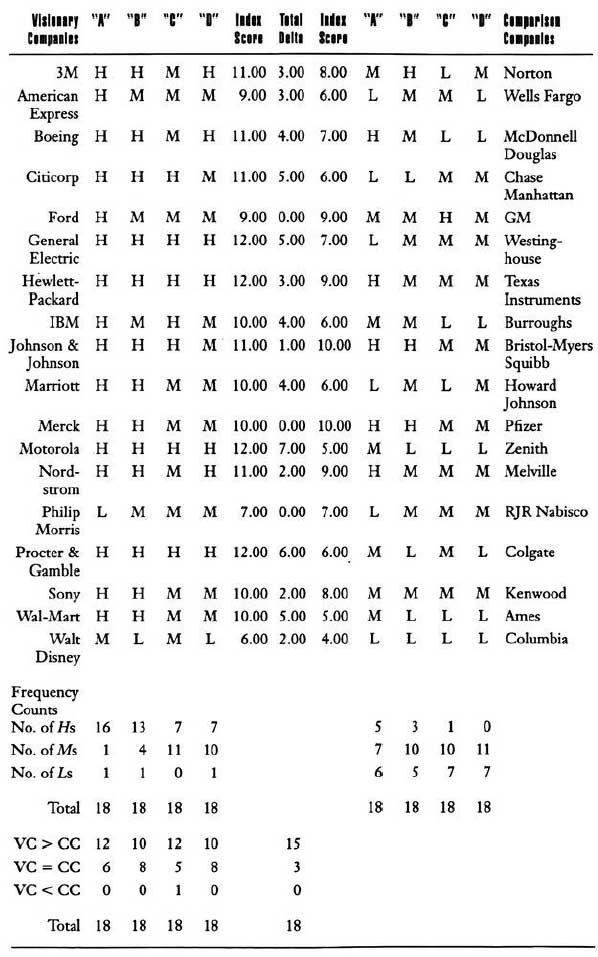
Table A.8 Backup Data
CEO Statistics
1806–1992

Table A.9
Performance Rankings of Chief Executive Eras General Electric Company
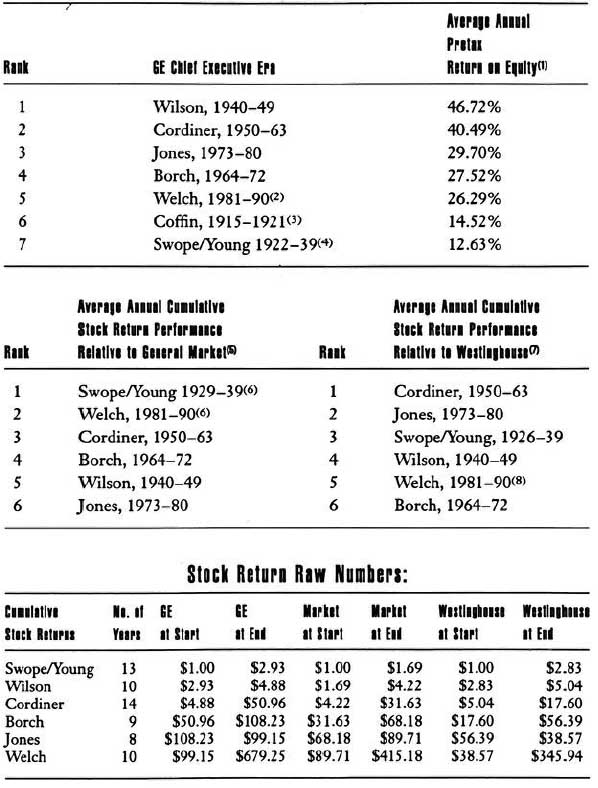
Notes to Table A.9
1. Calculated as pretax profit divided by year-end stockholder’s equity.
2. Our return on equity database cuts off in 1990. However, using 1991 and 1992 annual reports, we found that the rank order does not change adding in these additional years. Welch ROE from 1980–1992 comes out at 26.83 percent. (For 1991 ROE, we excluded the change in accounting for postretirement benefits in our calculations.)
3. Return on equity database dates back only to 1915; Coffin was in office beginning in 1892.
4. Swope and Young operated as a chief executive team.
5. Calculated as the ratio of cumulative GE stock return during the CEO era divided by cumulative general market stock return during the GE CEO era.
6. Our stock return database runs from January 1926 through December 1990.
7. Calculated as the ratio of cumulative GE stock return during the CEO era divided by cumulative general market stock return or cumulative Westinghouse stock return during the GE CEO era.
8. Given Westinghouse’s difficulties and GE’s success in 1988–1993, we predict that GE under Welch will rise significantly on this dimension.
Table A.10
Evidence of Self-Improvement
METHOD: In assessing self-improvement in the visionary and comparison companies, we considered evidence along the following dimensions:
A: Long-Term Investments (PP&E, R&D, Earnings, Reinvestments)
B: Investment in Human Capabilities: Recruiting, Training, and Development
C: Early Adoption of New Technologies, Methods, Processes
D: Mechanisms to Stimulate Improvement.
In each category we gave each visionary and comparison company a rating based on the evidence we had available. We then calculated an overall index based on a summation of the company’s ratings across these dimensions, scoring each “H” as a 3, each “M” as a 2, and each “L” as a 1.
A: Long-Term Investments
H: Significant evidence that the company has a history of reinvesting earnings for long-term growth, based on PP&E ratio as percentage of sales, R&D expenditures, and dividend payout ratios.
M: Some evidence that the company has a history of reinvesting earnings for long-term growth.
L: Evidence that the company has neglected investments for long-term growth.
B: Investment in Human Capabilities
H: Significant evidence that the company has a history of investment in employee recruiting, training, and professional development—even in downturns.
M: Some evidence that the company has a history of investment in employee recruiting, training, and professional development—even in downturns.
L: Little evidence that the company has a history of investment in employee recruiting, training, and professional development—even in downturns.
C: Early Adoption
H: Significant evidence that the company has a history of being an early adopter of, for example, new technologies, processes, or management methods.
M: Some evidence that the company has a history of being an early adopter of new technologies, processes, management methods.
L: Evidence that the company has a history of being a late adopter of new technologies, processes, management methods.
D: Mechanisms
H: Significant evidence that the company has a history of tangible “mechanisms of discomfort” that impel change and improvement from within before the external environment demands change and improvement.
M: Some evidence that the company has a history of tangible “mechanisms of discomfort” that impel change and improvement from within before the external environment demands change and improvement.
L: Little or no evidence that the company has a history of tangible “mechanisms of discomfort” that impel change and improvement from within before the external environment demands change and improvement.
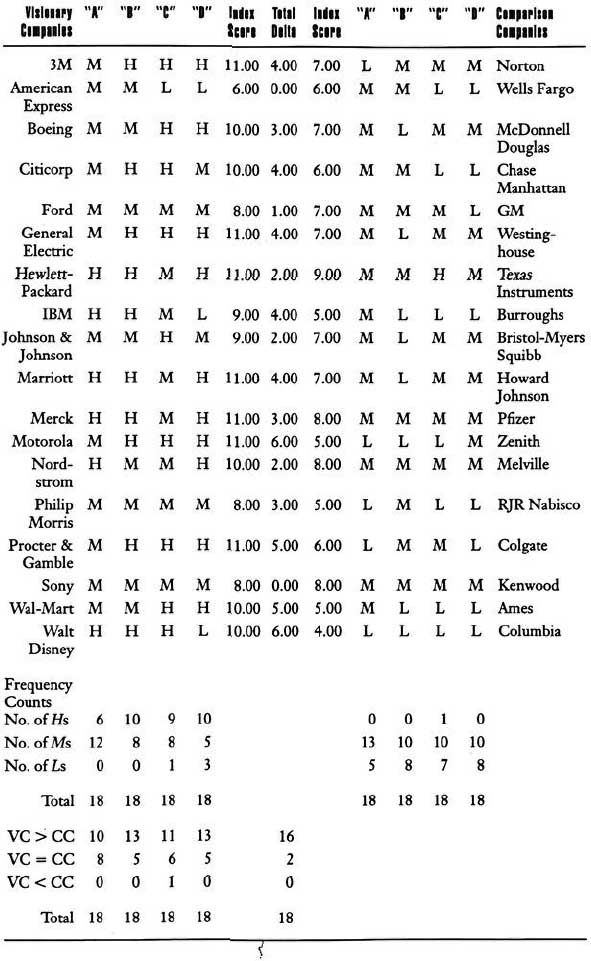
Table A.10 Backup Data
Average Annual Increase in Gross PP&E as Percentage of Sales

Table A.10 Backup Data
Average Annual Dividend Payout Ratio
