Figure 5.1. Schematization of Fluid-Structure Interaction (Ref)

The instabilities due to the interaction between the behavior of a fluid and the behavior of a structure are part of the conventional issues which require the greatest attention from design engineers. The behaviors considered in this chapter are aeroelastic couplings.
The flow will act on the structure which in turn, once deformed, will modify the flow and thus create self-sustained oscillation which may be unstable. Effects of inertia may also be superimposed in addition to the latter effects.
Figure 5.1. Schematization of Fluid-Structure Interaction (Ref)

Depending on the importance of these three effects, the dynamic behavior is not the same, and instabilities of several types may appear.
Aeroelastic behaviors are thus defined according to the triptych shown in Figure 5.1.
Several phenomena of static or dynamic instability result from this interaction, specially such as flutter or whirl flutter that we will describe in the next paragraphs.
For this type of self-sustained excitation, it is always interesting to analyze the energy exchanges between the deformable structure and the fluid. Although such energy exchanges may seem to be relatively low, considering damping is essential to obtain good prediction of structure stability.
As regards the case of a single-degree-of-freedom system, of mass m and stiffness k, Chapter 1 showed that stability was related to the sign of the first-order coefficient c, when the equation is of the following form:
[5.1] 
From an energetic point of view, the structure has a kinetic energy related to the mass, and a potential energy related to stiffness. When coefficient c is positive, the energy related to this coefficient corresponds to an energy dissipated and converted into heat and/or noise releasing in the external environment. This energy is either provided by external forces (F(t)) or corresponds to the initial system energy. In the case of a discrete input, where an initial potential energy is provided, the amplitude and kinetic energy of each successive vibration gradually decreases, and energy is dissipated.
In the case of a structure having a negative coefficient c, the forces related to this term are motive forces which positively work on the system. The work provided during one cycle is converted into kinetic energy supplementing the vibrations which are continuously increasing. Classified as self-induced, such vibrations cannot exist with no external energy source.
In most systems, self-sustained excitation and damping mechanisms take place simultaneously. As a matter of fact, the energy per cycle varies as a function of the vibration amplitude. In most cases, external provision of energy and dissipated energy are a function of the vibration amplitude, and are represented by curves which cross each other.
It can thus be observed in Figure 5.2, within amplitude range OA, the amount of energy fed to the system is greater than the amount it can dissipate, the amplitudes vary increasingly. If the amplitude reaches a value beyond A, there is more damping than self-excitation, the vibrations decrease. In both cases, the amplitude tends to A where there is an energy equilibrium; the movement done corresponds to stable-state, free, non-damped vibrations.
Figure 5.2. Self-Sustained Excitation Energy Analysis

Let us take the example of the airfoil in an airstream proposed in Chapter 1, whose schematization is reminded in Figure 5.3.
Behavior equation [1.99] shows that the sign of cequ depends on the fluid speed for a given airfoil. If the speed is low, the system is damped. Beyond a given speed, the system is divergent:
[5.2] 
Known as flutter, this phenomenon affects a great number of structures associated with flowing of a fluid such as civil engineering structures or aircraft (aviation).
Figure 5.3. Modeling of an Airfoil in an Airstream

Let us cite, for example, for non-rotating structures: bridges, cables, buildings, airplane wings, helicopter stabilizers, or for rotating structures: turbomachine blade systems and helicopter blades.
Practice shows that there is a critical airspeed in relation to the structure, termed “critical flutter speed”, from which coupling becomes unstable. For design engineers, it is essential to know that of the structure concerned so as to size it. This critical speed is usually determined by simulation and then testing in wind tunnels.
Flutter, and hence the critical flutter speed, depend on structure stiffness, damping, mass distribution, and aerodynamic and kinematic data, to which the effects of inertia and aerodynamic effects of the external environment are added.
Flutter behaviors can be classified differently according to the importance of all dynamic, aerodynamic and elastic effects.
Static divergence is aeroelastic coupling only involving static forces.
Figure 5.4. Fluid-Structure Interaction Schematization

This may be the case of a twisting flexible blade. The incidence of the relative wind may vary by modifying the aerodynamic forces. If the twist restoring moment is insufficient, the position is then statically unstable. Such phenomenon was often encountered on the first airplane wings or rotary wing blades since, at that period, engineering choices, materials and geometry, led to solutions excessively flexible in torsion. Such problems no longer appear today.
Figure 5.5. Conventional Flutter Modeling
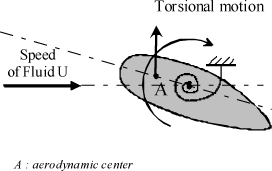
Conventional flutter involves two modes, usually: bending and torsional modes, related to the existence of two close eigenfrequencies which are made coincident for a given flowing speed range. This two-mode flutter may occur for low angles of attack.
The two previously described behaviors are present, thus obviously complicating the analysis and sizing. This is the case of structures whose deformation couples both types of motion, airplane wings or bridge decks, whose torsional and bending motions cannot be studied separately.
Figure 5.6. Conventional Flutter Modeling

Stall flutter occurs upon flow separation around an airfoil. Flow separation then causes aerodynamic reactions not linear in relation to the structure motion.
On structures such as airplane wings, separation specially occurs for significant angles of attack. This type of flutter is due to aerodynamic nonlinearities. It is not studied in this work.
Whirl flutter is an instability which appears for rotating systems placed in an airstream on a flexible system (wing, mast, etc.).
There are risks of instability on servocontrols associated with the controlled system.
Let us model the behavior of conventional flutter, which couples torsion and pumping, in order to analyze the effect of fluid-structure coupling.
Let us consider a solid, noted Σ, of any shape, immersed in a fluid of constant speed, noted U, relative to the Galilean reference system, Figure 5.7 [BLE 77]. The solid may have a translational motion perpendicular to the flow direction (pumping along y) and a rotational motion along a third axis (torsion along z). The solid connecting component is modeled by a mass/spring/damper system.
Figure 5.7. Conventional Flutter Modeling and Setup
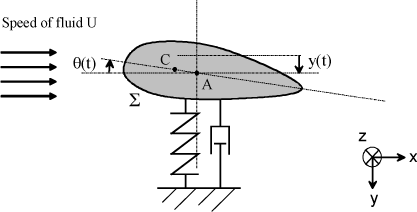
For a streamlined shape, the aerodynamic forces are modeled at center of pressure C by the following equation, Figure 5.8:
[5.3] 
where:
– U: fluid speed,
– S: aerodynamic reference area,
– ρ: fluid density,
– Cy, Cz and CM: aerodynamic coefficients associated with airfoil.
The structure/mount connection is modeled by a linear elastic behavior (spring of stiffness k) and a dissipative behavior (Newtonian viscous fluid damping). Dynamic equations are derived at A (center of rotation):
[5.4] 
where:
– k: translational stiffness,
– μ: translational damping,
– kθ: rotational stiffness,
– μθ: rotational damping.
where:
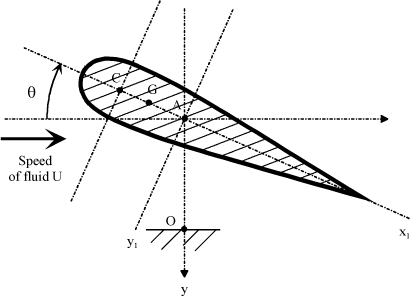
– G: airfoil center of inertia,
– C: center of pressure,
– A: center of connection.
Figure 5.8. Airfoil Characteristic Definition
Let us use the method of Lagrange’s equations to determine the equations of motion. We must define the kinetic energy of the system, the potential functions associated with the stiffness values, the dissipation functions and the generalized forces associated with the aerodynamic forces.
By definition, the speed of center of inertia G is:
[5.5] 
With the following parameter setting:
[5.6] 
where:
– r: center-of-gravity/rotation axis distance,
– y: vertical position of point A.
Thus:
[5.7] 
Hence the kinetic energy expression:
[5.8] 
Where:
– m: airfoil mass,
– J = I + m r2: airfoil inertia about axis (A,  ),
),
– ms = m r: airfoil static moment at A.
The potential function associated with the stiffness values is expressed by:
[5.9] 
The dissipation function associated with the dampers is expressed by:
[5.10] 
The generalized forces related to the aerodynamic forces are given by:
[5.11] 
The Lagrange equations are used to construct the following system of linear equations:
[5.12] 
Coupling due to the effects of inertia can be observed. The latter are associated with static moment ms, product of the mass and distance between the airfoil center of inertia and the rotation axis.
Experimentally, it can be observed that aerodynamic coefficients Cy and CM are a function of the angle of attack (noted α) of air with the airfoil, Figure 5.9.
Figure 5.9. Typical Law of Lift Coefficient Versus Angle of Attack
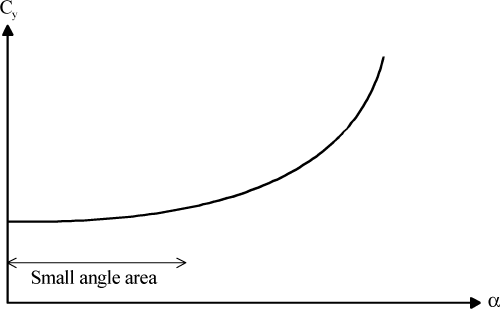
By assuming motions sufficiently small, these expressions are developed as firstorder Taylor series, thus:
[5.13] 
Figure 5.10. Airfoil Angle of Attack

Angle of attack α can be geometrically approximated as functions of system parameters y and θ; it can then be shown that:
[5.14] 
The aerodynamic coefficient definition [5.13] becomes:
[5.15] 
Damping and stiffness terms are caused to appear, and qualified as aerodynamic damping and stiffness; the following system is then obtained through equations [5.12]:
[5.16] 
where:
[5.17] 
Couplings can be observed between the torsional motion and the pumping motion. The latter can be observed with time in Figure 5.11.
Figure 5.11. Airfoil Coupled Motions With Time

Through definitions [5.17], it can be observed that couplings depend on the aerodynamic forces, specially functions of position r of the center of inertia, and position of the center of pressure.
Figure 5.12. Positioning of Center of Pressure, Center of Inertia and Hinge Axis

Figure 5.13. Positioning of Center of Inertia, and Hinge Axis – Unstable Position
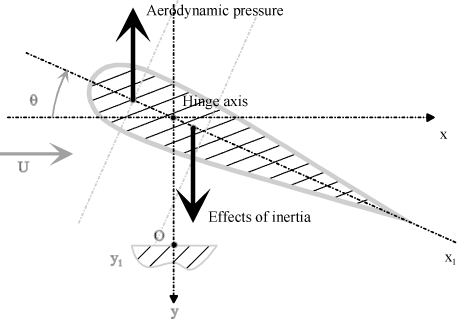
Figure 5.14. Positioning of Center of Inertia, and Hinge Axis – Stable Position

If the center of inertia is aft of the hinge axis, upward flapping acceleration then produces a moment of inertia forces about this axis, tending to increase the pitch angle, Figure 5.13. The system is unstable.
If the center of aerodynamic pressure is forward of the angle-of-attack axis, there is a positive nose-up moment, Figure 5.14.
Figure 5.15. Instability Loop Schematization

As it can be seen in Figure 5.15, a pitch increase may lead to increase of the aerodynamic forces which may then lead to another pitch increase. Behavior instability may thus occur.
The system stability can be studied from equation [5.16]. Let us conduct this study through two simpler examples: flapping of a high-voltage line, and vibratory motion of a helicopter empennage.
Overhead power lines are often subject to galloping, Figure 5.16. Depending on atmospheric conditions, wind induces a flapping motion of the cables. The latter start oscillating, which changes the wind effect. Flapping divergence may then appear, as previously.
Figure 5.16. Overhead Power Lines Subject to Gallop

Cable motion modeling is defined in Figure 5.18. The cable motion is assumed to have a vertical component only.
Figure 5.17. Cable Gallop Phenomenon

The gallop phenomenon is thus represented by a single-degree-of-freedom system.
Figure 5.18. Model Associated With Cable Gallop
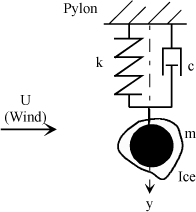
The presence of the ice layer is important since its shape determines the values of the aerodynamic coefficients. The instability phenomenon appears when the cable profile is highly asymmetrical. Thus, in winter, there are many more instability phenomena when frost or ice have formed on the cable.
In practice, the values of mass m, stiffness k and damping c are defined in order to retrieve the eigenfrequency and damping ratio associated with the motion of a point of the cable with zero wind, which has been observed or measured besides.
The equation of motion along the y-axis is:
[5.18] 
As angle of attack α remains small, we use the Taylor series development for aerodynamic coefficient Cy:
[5.19] 
Coefficient  can be evaluated by means of the aerodynamic forces; the following can thus be defined:
[5.20] 
Figure 5.19. Aerodynamic Actions on Cable

The following force can also be defined:
[5.21] 
Thus, using equation [5.21], the following relation is obtained:
[5.22] 
The following is obtained as first order, for α<30°:
[5.23] 
And:
[5.24] 
Figure 5.20. Aerodynamic Coefficient Trend for a Cable

Let us set:
[5.25] 
Then we have:
[5.26] 
Which enables the following equation of motion to be written:
[5.27] 
A stability condition is therefore obtained for the system if the apparent damping coefficient remains positive.
And:
[5.28] 
It is interesting to know the speed from which the phenomenon diverges. This condition is obtained by canceling the damping factor, i.e.:
[5.29] 
Let us quantify this gallop phenomenon through an example. The overhead power line has the following characteristics:
[5.30] 
The flapping eigenfrequency measured during testing in a wind tunnel is 0.5 Hz. Usually, this type of phenomenon is between 0.1 and 3 Hz. Structural damping is estimated to 0.05%.
The model mass is evaluated by the following calculation:
[5.31] 
Stiffness constant k is calculated as follows:
[5.32] 
Damping coefficient c is expressed as follows:
[5.33] 
The wind speed is 30 m/s, i.e., 108 km/h. The air density is assumed to be constant and equal to 1.225 kg/m3.
Apparent damping coefficient Ce is defined by:
[5.34] 
Apparent damping coefficient Ce can thus be plotted as a function of  :
:
Figure 5.21. Cable Stability Area

It can be observed that stability depends on the aerodynamic coefficient related to the profile shape (cable+frost). The objective is to get the possibility of creating cable profiles on which ice or frost formation induces no instability.
Another solution to counter such type of problem consists in inserting flapping devices or resonators on the lines.
Stabilizers (empennage) may be a source of instability for a structure like the helicopter. Coupling of the empennage bending and torsional motions induced by the surrounding airstream can be observed.
Figure 5.22. Location of an Empennage on a Helicopter

Let us model the stabilizer by a beam of rectangular straight cross-section. The coefficients are determined by a bending and torsion study.
Owing to its morphology, the empennage is modeled by two series-mounted beams of different characteristics, Figure 5.23.
The equations of motion can be written in the following form:
[5.35] 
Where:
[5.36] 
The characteristic equation is written as follows:
[5.37] 
where p = α +i ω.
Figure 5.23. Empennage Bending and Torsion Study

The system will be unstable if at least one of the roots is positive real or if there is a pair of complex roots with positive real parts.
Figure 5.24 describes the change of real parts α for bending and torsion as a function of the aircraft speed. It can be observed that the bending coefficient remains negative. The system can therefore be considered as stable to bending.
The torsional damping coefficient remains negative until the aircraft speed reaches 570 km/h. Thus, the latter will no longer be stable for higher speeds, and risks of breakage appear. We therefore highlighted, in this case, a critical operating speed for the aircraft.
It should be noted that helicopters never reach such speeds in reality (max speed around 380 km/h); we can therefore say that aircraft safety is guaranteed.
It is interesting to see the trend of the resonant frequencies versus the speed values. It can be seen (in Figure 5.25) that the more the speed increases, the closer the frequencies. This is very dangerous in the case where this would correspond to the operating speed interval. The certification rules allow such type of phenomenon to be avoided.
Coupled phenomena, rapidly causing damage to the structure, could appear.
Figure 5.24. Stability Area According to Forward Speed
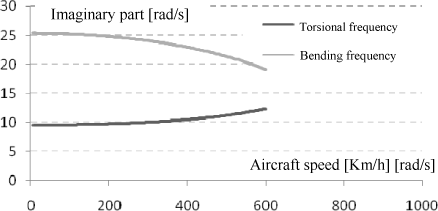
Figure 5.25. Frequency Changes Versus Aircraft Speed
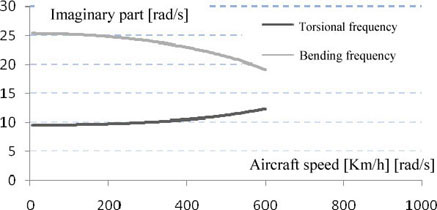
It can be observed that the torsional and bending frequencies are quite separated; there is therefore little chance of entering coupled resonance.
Bridge decks behave as flexible structures which may be deformed along various and complex modes: bending, torsion, lateral motions.
As regards stability, two types of sources of energy were historically identified for the system to be in self-sustained excitation – excitation related to pedestrians’ reaction and wind aerodynamic effects, Figure 5.26.
Figure 5.26. Classification of Bridge Deck Stresses

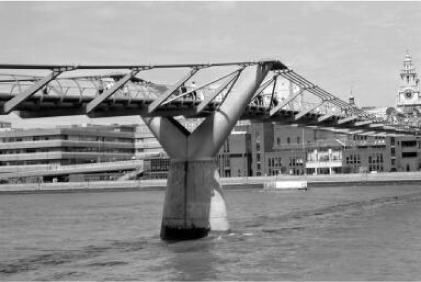
Very substantial vibrations were observed when people flocked over the Millenium bridge in London upon its inauguration, Figure 5.27.
The bridge oscillations were very violent; just inaugurated, the bridge was closed to pedestrians for reasons of excess pitching. Let us take this example to illustrate the self-sustained excitation phenomena leading to instability.
Figure 5.27. Millenium Bridge in London
In the case of the bridge, energy is induced by the collective motion of pedestrians or wind if any. Pedestrians walk at a given frequency which varies with their forward speed. This energy is related to the number of persons present at a given instant. The difficulty for studying such phenomenon lies in the modeling of the force transmitted by the pedestrians to the bridge, and in the determination of damping of the bridge structure [WIL 02].
This phenomenon is related to the behavior of the pedestrians who react to the bridge motion so as to keep their equilibrium. The pedestrians participate in damping of the whole motion, but they instinctively lean with a phase shift, thus causing a force in phase with the speed, hence destabilizing. As most pedestrians have the same reflex, their action is not negligible. This thus meets the self-sustained excitation diagram.
The pedestrians’ forces on the bridge deck were observed by sensors placed on the structure. The latter are proportional to the bridge displacement speed, i.e.:
[5.38] 
Coefficient B is characteristic of the type of bridge. This formulation takes account of the position of the group on the bridge and excited mode. It should be noted that knowledge of the crowd distribution and density is of prime importance.
The first vibration mode of the bridge is often lower than 5 Hz. The usual excitation frequencies corresponding to walking of a pedestrian are related to his displacement speed.
Table 5.1. Order of Magnitude of Excitation Frequencies of a Pedestrian Versus his Speed
| Frequency (Hz) | Speed (m/s) | |
|---|---|---|
| Slow walk | 1.7 | 1.1 |
| Normal walk | 2 | 1.5 |
| Fast walk | 2.3 | 2.2 |
| Slow running | 2.5 | 3.3 |
| Fast running | 3.2 | 5.5 |
A pedestrian standing still acts as a damper since he takes the lateral oscillations of the bridge; only moving pedestrians are considered. They are assigned with a mean speed. The walk of a pedestrian can be compared very approximatively to an excitation in the form of a square wave.
Figure 5.28. Pedestrian Excitation Cycle Modeling

We consider that a pedestrian always walks with the same amplitude, without considering any right foot/left foot asymmetry.
Vibratory response ε((t) to this excitation is written as follows:
[5.39] 
where:
– Δ: duration of one step,
– λ: damping ratio,
– ω: motion eigenfrequency,
– ωn: natural frequency,
– I1: bridge inertia,
– C1: motion amplitude.
Excitation ε can thus be written as functions of the parameters which affect the system, by:
[5.40] 
We thus write the system response to a square wave and with zero damping ratio:
[5.41] 
hence:
[5.42] 
We can thus plot the trend of ε as a function of the time, and then compare it with the excitation.
Figure 5.29. Representation of Bridge Response Versus Excitation

[5.43] 
 where T is the motion eigenperiod.
Figure 5.30. Dynamic Amplitude of Vibrations Versus n

We therefore check that the max amplitude is close to two when the step duration corresponds to half the period of the bridge eigenoscillations. In this case, we can consider that each pedestrian lean is in phase so as to go in the direction of the increase of the motion amplitude.
Such modeling obviously does not consider damping. The latter is harder to be modeled and considered in the analysis. It should be reminded that damping must be sufficient for the system to become stable, for example, by adding energy dissipating systems to the structure.
a) Passive Methods: Example of Bridge Deck
A first method consists in using a resonator [KRY 03]. On the Millenium bridge, resonators have the form of pendulums.
Figure 5.31. Horizontal Resonator of Compensated Pendulum Type

The eigenfrequency of a simple pendulum based on gravity is given by the following law:
[5.44] 
where:
– L: pendulum length,
– g: gravity constant.
As the period of these oscillations is quite substantial, we need a very long string. Now, the space available on the bridge is very restricted. When a pedestrian walks slowly, he excites a frequency of 1.47 Hz.
The required string length would be 8.7 m, which is completely impossible to arrange on a bridge. The compound pendulum is used to compensate for this problem. The total string length is the sum of two shorter lengths, the system taking less space in height. The total length of a simple pendulum can thus be distributed using construction levels.
A second method consists in using viscous dampers. In order to have a lot of energy dissipated, it is important to place the damper in a position of optimal effectiveness, i.e., there where it can sense the largest motions. The solution retained is presented in Figure 5.32.
Figure 5.32. Positioning of Dampers on Bridge
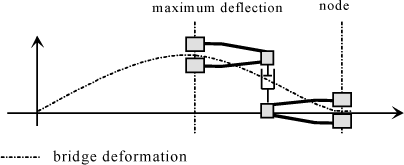
Arms linked to the bridge structure are used. The damper interconnects the arms and damps the relative motions of these two arms.
As a matter of fact, the arms will move but, depending on the form of the excited mode, the arm displacements are not identical. A relative displacement with which the motion along y is damped is therefore induced by securing a hydraulic-type damper.
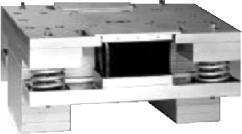
In the case of vertical motions, resonators can also be used. This time, stiffness is due to springs. The latter are placed at the vibration antinodes of the modes in order to relieve the latter from any risk of instability.
The vibration issues of the London’s Millenium bridge were solved by the provision of damping through hydraulic dampers and horizontal (4) and vertical (26) dynamic vibration absorbers.
Figure 5.33. Resonator for Bridge Vertical Motions [WEB 02]
When there is wind, the aerodynamic forces created by the flow change the equivalent damping and stiffness coefficients such as in the phenomenon described in the preceding section.
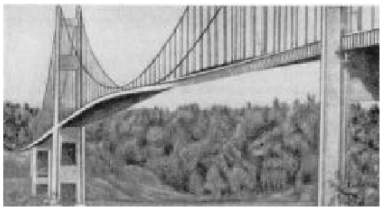
However, it should be noted that, owing to the great value of the bridge mass, the wind effect only applies to high speeds. In reality, winds start affecting bridges for speeds ranging between 50 and 100 km/h. During storms, breakage of the bridge may be observed such as was the case in Tacoma. Stiffness and damping of that bridge were not high enough. Here is a photo showing the amplitude of the phenomenon.
Figure 5.34. Illustration of Deformation of a Bridge Deck - Tacoma Bridge
As in the case of the empennage, aerodynamic forces apply to the aerodynamic center of the bridge during high wind periods. Thus, these forces add aerodynamic damping and stiffness which are equivalent to those of flutter. The aerodynamic forces are:
– Lift force:
[5.45] 
– Drag force:
[5.46] 
– Aerodynamic moment at center of pressure C:
[5.47] 
where:
– Cx, Cy, CD: aerodynamic coefficients,
– U: relative wind speed,
– S: lateral bridge surface area,
– ρ: air density.
In the application exercise of this chapter, let us make a numerical application to illustrate the phenomenon observed upon breakage of some bridges.
Changes of the angle of attack and geometry are linked. As a matter of fact, a geometry change automatically changes the angle of attack. Conversely, if the angle of attack is changed, the geometry is changed too. However, even when wind is not present, it can be clearly observed that the pedestrians’ motion causes a problem of instability. Hence, as in the preceding case, coupling occurs and the analysis of the resonant frequencies is essential for the system stability.
The system of equations governing the bridge motion is expressed as follows:
[5.48] 
where:
– r: number of persons present on the bridge,
– B: proportionality coefficient between the pedestrians’ force and the lateral speed,
– m: system mass {bridge + pedestrians},
– Ixz: system coupled inertia,
– Jθ: polar inertia,
– μ and μθ: system damping coefficients,
– k and kθ: system characteristic stiffness values.
The bridge can be modeled as a succession of beams embedded at their ends. The equation of bending motion of a beam embedded at both of its ends is expressed as follows:
[5.49] 
where v(x,t) is the beam deflection at M.
The method of separation of variables is used to solve such equations. Let us set:
[5.50] 
For these functions to be a solution to equation [5.49], their form must be:
[5.51] 
where:
[5.52] 
Owing to the continuity of the displacements and bending angles, the displacements of each beam can be written. The conditions at limits can be used to calculate the final form of these displacements:
– beam 1 is embedded at x=0 v(0,t)=0 and Φ(0,t)=0,
– beam 2 is embedded at x=L2 v(L, t)=0 and Φ(L, t)=0.
These four conditions can be used to write the following system of equations:
[5.53] 
In order to obtain solutions differing from identically nil solutions, the matrix determinant must cancel out, i.e., 1- Cos(βL) Cosh(βL)=0.
The numerical values were estimated to illustrate the approach, and do not correspond to actual values.
The following bending eigenmodes are consequently obtained:
[5.54] 
where:

The solution which meets the equation governing the torsional motion is:
[5.55] 
The conditions at the limits of this system are:
– the beam is embedded at x=0 ⇔ v(0,t)=0 ⇒ D=0,
– the beam is embedded at x = L ⇔ v(L, t)=0 ⇒sin(βL) = 0 ⇒ βL = nπ.
The following bending damping coefficient is therefore obtained:
[5.56] 
As well as the following resonant frequency values:
[5.57] 
where:
– G: shear modulus,
– J and Iθ: inertia values.
Let us assume that the eigenform of the bending mode is:
[5.58] 
Conditions h(0)=0 and h(L)=0 give the following result:
[5.59] 
The following generalized masses can thus be calculated:
[5.60] 
For the model to be complete, integrals ∫hαdy, ∫h2dy, ∫hαdm merely have to be calculated by the rectangle method.
Bending:

Torsion:

[5.61] 
This graph describes the change of bending and torsional damping of the bridge as a function of the wind speed. It can immediately be observed that the bending coefficient remains negative. The system can therefore be considered as stable to bending.
The torsional damping coefficient remains negative until the wind speed reaches 82 km/h. Thus, the bridge will no longer be stable for higher speeds, and risks of breakage appear. We highlighted, in this case, a critical operating speed for the bridge.
It is interesting to see the trend of the resonant frequencies versus the speed values. It can be seen (in Figure 5.36) that the frequencies are equal. Therefore, coupled phenomena may appear, such as upon collapsing of the Tacoma Narrows Bridge in 1940.
The Tacoma Narrows Bridge was a suspension bridge opened to traffic in 1940. This architecture was selected for its aestheticism and its economical side but, unfortunately, the engineers had little information and experience on such type of bridge. It was destroyed four months after its opening. The data used were estimated to illustrate the phenomenon but can under no circumstances be considered as corresponding to reality.
Figure 5.35. Change of Bridge Bending and Torsional Damping Versus Wind Speed
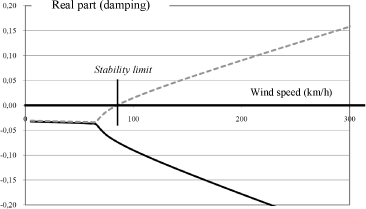
Figure 5.36. Change of Bridge Bending and Torsional Frequencies Versus Wind Speed

The flutter phenomenon may be encountered on a helicopter rotor. The pitch or bending motions of the blades produce aerodynamic force changes entailing a possibility of unstable self-sustained excitation. The blade takes energy from the airstream as required to make it oscillate, in some configurations, in divergent way, and thus cause flutter.
Such phenomenon is close to conventional flutter of fixed wings, as previously described, but differs by the role of effects of inertia generated by centrifugal loads.
Oscillatory motions may be produced by either the blade elasticity, or the flexibility of the blade pitch control system (change rods) that we are going to study herein.
For a rigid blade, these degrees of freedom in relation to the rotor hub can be considered as being a flap motion and a pitch motion. The latter is effectively considered as a degree of freedom as the control is flexible.
If a blade is isolated in the rotating reference system, it can be observed that it is subjected to aerodynamic forces that are considered to be applied at the center of pressure (point P), and centrifugal forces applied at the center of inertia (point G). It can be intuitively understood thart the relative position of both of these points in relation to the pitch axis (A,  ) is fundamental as regards system stability, Figure 5.37.
Figure 5.37. Definition of Center of Pressure, Center of Inertia and Pitch Axis

Depending on the position of center of inertia G in relation to the pitch axis, the effects of inertia induce a moment about the pitch axis which tends to increase or decrease the pitch. The center of pressure is usually located close to the quarter-chord point. Depending on its position in relation to the pitch axis, it induces a moment which may also be stabilizing or destabilizing.
In the case of a position very aft of the center of inertia, as well as in the case of a center of pressure forward of the pitch change axis, the blade motion may diverge. Thus, the upward flap motion causes a pitch angle nose-up variation, thus increasing the upward flap motion, and so on to end by sudden destruction of the blade. Such instability is known as static divergence; a single cycle is sufficient to destroy the blade. Static pitch divergence may also occur when the blade moves on the back side in a reverse flow for high forward displacements (See Figure 5.38).
Figure 5.38. Torsional Divergence on Back Side in a Substantial Reverse Flow

When the center of pressure is located at 3/4 of the chord at any point of the blade in the reverse flow, the moment generated in relation to the pitch change axis produces a blade nose-up deflection, which increases the motion instability. The aerodynamic moment acts as a spring with “negative stiffness”. A divergence occurs when this moment exceeds the moment related to the control system and the moment related to the blade elasticity.
Combined flapping and pitching create the divergence situation, Figure 5.39. For some configurations, it can be observed that the pitch motion is delayed by 90° from the pitch moment which results from the effects of inertia, whereas the aerodynamic forces are in phase with the vertical speed of the flapping blade, which causes a divergent motion over one cycle.
Figure 5.39. Aerodynamic Force Work
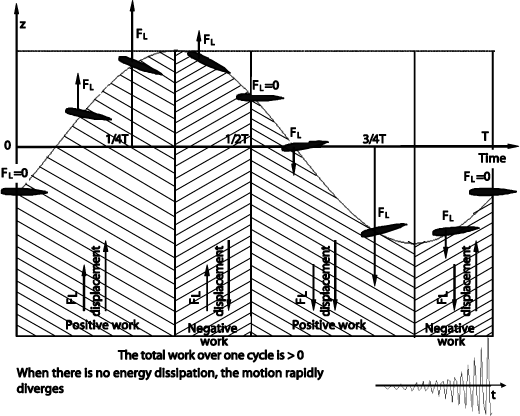
In some cases, because of nonlinear effects, the motion amplitude reaches a limit value and then produces vibrations with quite large amplitudes, without immediate destruction. This is a limit cycle. Destruction then takes place by fatigue.
In order to prevent flutter from occurring, a solution consists in equipping the blades with a balancing weight at their leading edges so as to position the center of inertia enough forward of the pitch axis. This single solution has the drawback of making the blade heavier.
A supplementary solution consists in using the tabs (small flaps located at the trailing edge of a blade) to locate the center of pressure between 2% and 3% aft of the quarter-chord point.
The next paragraphs give the mathematical description of flutter and the way it can be used for designing a rotor.
Let us illustrate the flutter of a blade through a configuration with two degrees of freedom: a flap motion and a pitch motion. The blade is assumed to be infinitely rigid.
The geometric data of the blade used is given in Figure 5.40. Let us consider a hinged rotor, with no shift of the flap hinge in relation to the rotor hub rotation axis (rotor eccentricity neglected). This approximation simplifies the equations without affecting the analysis of the phenomenon.
Figure 5.40. Hinged Rotor Blade With Flap and Pitch Motions

There is some flexibility in the control system (pitch change rod for instance) which must be taken into account. This requires kinematic coupling between the two motions studied, known as pitch-flap coupling. The latter is represented by coefficient Kβ.
The eccentricity of the flapping hinge is neglected, i.e.:
[5.62] 
When a blade is isolated, the momentum theorem applied to the blade and expressed along axis y1 at A gives:
[5.63] 
Figure 5.41. Blade Motion Setup

The dynamic moment of the blade at A is as follows by definition:
[5.64] 
That is:
[5.65] 
By considering the small motions, the following is obtained:
[5.66] 
Equation [5.63] gives the following by considering the pitch-flap coupling and aerodynamic forces:
[5.67] 
That is:
[5.68] 
By setting:
[5.69] 
It is then more convenient to introduce the notions of reduced inertia in pitch  frequency of the flap mode
  , and Lock number γ, such that:
[5.70] 
The equation of flap motion is then written as follows:
[5.71] 
The equation of pitch motion is obtained from the following equation:
[5.72] 
The equation then becomes:
[5.73] 
Let us set:
[5.74] 
Equation [5.73] is written in the following form:

Afterward, we consider that θcons=0.
Figure 5.42. Aerodynamic Forces on a Blade Section

Airfoil angle of attack a is evaluated by:
[5.75] 
Term MInst represents a moment of the aerodynamic forces due to time variations of the parameters.
It is determined from the Theodorsen’s theory [BIE 92].
Thus, the lift force per unit length is equal to:
[5.76] 
where:
– ρ: density,
– c: chord,
– Cz, α: lift polar curve slope.
The lift on a blade component is given by:
[5.77] 
For a hover flight configuration, the following is obtained:
[5.78] 
where:
– kβ: pitch-flap coupling coefficient,
– xa: position of the center of pressure in relation to the pitch axis.
Thus we have:
[5.79] 
The Theodorsen’s theory applies to an infinitely thin airfoil subject to heave motion h and pitch motion a around abscissa point A, such as illustrated in Figure 5.43.
By assuming low instationarity, Theodorsen’s coefficients C(k) can be taken equal to 1, and the following expression is obtained for the non-circulatory moment, i.e., induced by effects of flow acceleration [BIE 92, BRA 01]:
[5.80] 
Figure 5.43. Thin Heaving and Pitching Airfoil

Moreover, the momentum expression is:
[5.81] 
After simplification, only instationary terms remain in the momentum expression by considering the fact that:
[5.82] 
then:
[5.83] 
The virtual mass terms, such as the acceleration terms, can be neglected. Thus, calculating the aerodynamic moment gives:
[5.84] 
where:
[5.85] 
The equations therefore become:
[5.86] 
[5.87] 
As regards azimuths, they can be formulated by setting the following:
[5.88] 
then:
[5.89] 
[5.90] 
And:
[5.91] 
where:
[5.92] 
The system can be set to the form of a conventional matrix system which can be solved through its characteristic equation.
Let us study the eigenvalues to analyze the system stability.
Let λ be a system eigenvalue, with:
[5.93] 
The instability criterion is expressed by:
[5.94] 
For a rectangular blade, the following approximation can be made:
[5.95] 
where:
– R: rotor radius,
– xI: position of the center of gravity in relation to the pitch axis.
For the divergence, the acceleration and speed terms are not important and can therefore be neglected in the main equations which then become:
[5.96] 
If the determinant is assumed to be equal to zero, the following critical condition is obtained:
[5.97] 
For a system to be stable, the determinant must be positive. If this inequality is solved for the following values: γ = 8.5, R = 7.5 m, νβ = 1.045, the graph obtained is that given in Figure 5.44. The latter shows the following data.
The more the center of gravity is aft in relation to the pitch axis (xI negative), the more the blade must be stiff in torsion to guarantee stability.
If the center of pressure is located toward the leading edge in relation to the pitch axis (xa positive), the larger the torsional flexibility can be admitted to keep the system stable.
The positive pitch-flap coupling (kβ positive) is stabilizing for the system.
Figure 5.44. Effect of Pitch-Flap Coupling kβ and Distance xa and xI on Divergence Stability in Pitch-Flap Flutter

Self-excited oscillations are induced by coupling of the pitch motion and flap motion.
Let us analyze the stability using the Routh-Hurwitz criterion. Let us use the Laplace transform for this purpose:
[5.98] 
Then, the equations are of the following form:
[5.99] 
where:
[5.100] 
Developing the determinant of equation [5.99] gives:
[5.101] 
where, after simplification:
[5.102] 
At the flutter critical condition, system damping becomes zero, which means that the real part of imaginary number “s” is also zero. That is:
[5.103] 
By transferring to the following equation [5.101]:
[5.104] 
The following two equations are obtained by separating the real part and imaginary part:
[5.105] 
By removing ω from both of these equations, the following is obtained:
[5.106] 
That is:
[5.107] 
The latter equation defines the stability condition according to the Routh-Hurwitz criterion for the pitch-flap flutter.
Figure 5.45 shows, for a given rotor configuration, the stability areas in relation to the center-of-gravity shift xI and at torsional frequency ωθ.
Appearance of flutter instability is observed, and can be avoided in practice by:
– increasing the blade torsional stiffness which consists of the eigenstiffness of the blade and the stiffness of the series-mounted control system, which gives ωθ;
– reducing xI, i.e., moving the center of gravity closer to the torsional axis.
Let us now describe the contribution of multibody modeling using a specialized software from the analytical model previously developed. The model consists of a rigid rotating mast which drives the swashplate and blade, as illustrated in Figure 5.46. The flap and pitch hinges are represented by pivot connections. The blade is a rigid beam.
Figure 5.45. Divergence Stability and Pitch-Flap Flutter Area Due to Center-of-Gravity Shift and Torsional Frequency γ = 8.5; R = 7.5 m; νβ = 1.045; If* = 0.001; c = 0.65 m

Pitch-flap coupling is introduced geometrically in the model design, and the control system rigidity is modeled through stiffness interconnecting the two sections of the pitch change rod. So as not to disturb the dynamic blade behavior, the other components consist of a very light material for their inertia effects to be negligible. The blade flapping stiffness is modeled by an angular stiffness Kβ, defined by the eigenfrequency of the flapping mode with:
[5.108] 
Figure 5.46. Multibody Model Overall View

The torsional stiffness of the blade is due to that of the control system which therefore has been reset in order to determine the correspondence between its value and the reduced frequency of the torsional mode.
Figure 5.47. Reduced Frequency of Torsional Mode Versus Control System Stiffness

The blade center of inertia is located at a distance d from the pitch axis chordwise. The flapping inertia is calculated from the Lock number.
The blade is considered as being rectangular, hence of constant chord, with neither sweep nor dihedral. Its profile is symmetrical. It is discretized into 6 elements so as to take account of the vertical velocity term; the lift and drag forces, and the Theodorsen’s instationary moment are applied to these elements for the segment of index i. The center of pressure is located at xa from the pitch axis, chordwise.
The speed induced by the rotor is evaluated by the Froude’s theory, hence assumed to be uniform over the entire rotor disk:
[5.109] 
where S = π R2 is the surface area of the rotor disk.
As the profile is symmetrical, the pitching moment coefficient is zero, Cm = 0, as well as for the lift coefficient at zero angle of attack Cz, α = 0.
The aerodynamic forces and moments are expressed by the conventional formulas, in the aerodynamic reference system:
[5.110] 
The airfoil angle of attack is measured by:
[5.111] 
They are then projected into the airfoil reference system where the forces applied to the blade are calculated:
[5.112] 
The flight phase considered is hovering. Thus, the model, first at rest, is subjected to a change of its pitch through rising of the swashplate. The rotor is then accelerated up to its rated speed Ω.
The blade torsional mode is then excited by a dynamic moment at the frequency corresponding to the control system stiffness, and the system response is recorded.
In the case of static pitch divergence, blade flapping is increased upon rotor acceleration until diverging.
The numerical values of the model are correlated with those used within the analytical model, and summarized in the following list:
– rotor speed Ω: 200 rpm;
– rotor radius R: 7.5 m;
– flapping stiffness Kβ: 70,234 N/m;
– control system stiffness Kθ depending on configuration ∈ [5 272] kN/m;
– position of the center of pressure in relation to the pitch axis, xa: positive toward the leading edge;
– depending on configuration ∈ [−0.05 0.05] m;
– position of the mass center in relation to the pitch axis, xI: positive toward the leading edge;
– depending on configuration ∈ [0 0.12];
– chord C: 0.65 m;
– pitch-flap coupling kβ depending on configuration ∈ [−1 0];
– lift curve slope, Cz,α 5.87;
– drag coefficient at zero angle of attack, Cx0 1.10-4;
– coefficient at α2 in Cx k 2.10-3;
– induced speed vi: 11.66 m/s;
– air density ρ: 1.225 kg.m3.
Moreover, the blade mass per unit length has been taken equal to 12 kg/m. And also, the rotor radius of 7.5 m is used to consider a medium-tonnage helicopter; for the calculation of the Froude’s speed, let us consider a 6-ton aircraft.
The rotor speed has been evaluated in such a way as to obtain, for a forward speed of 260 km/h, a Mach number of 0.7 at the tip of an advancing blade. The pitch-flap coupling of the model corresponds to an angle δ3 of −16°.
The inertia value about the flapping axis is obtained by means of a Lock number of 8.5 which has been retained. The inertia about the pitching axis is determined by the value of If.
The flapping stiffness value is induced by the frequency, νβ=1.045. Theoretically, the frequency of this mode would be 3.64 Hz; with the multibody model, the value obtained is 3.52 Hz, which confirms the choice of the stiffness value.
The model configuration corresponding to a pitch-flap coupling of −0.3 and an aerodynamic center offset of 0.05 m was proven, both numerically and analytically, in order to compare the results and validate the flutter multibody approach.
Figure 5.48. Comparison of Analytical and Multibody Model Results, xa=0.05

The comparison of results shows correct result correlation, the multibody model providing results with a correct accuracy.
Moreover, other investigations were conducted on the configuration, Figure 5.49 and Figure 5.48.
The adequacy between the multibody model results and the analytical results was, this time, proven conjointly on the flutter limit and static divergence limit of the blade.
Good prediction offered by the blade flutter multibody model can be seen in Figure 5.49, in the configurations which can be physically achieved, i.e., except for the instability envelopes common to both phenomena. This analytical model/multibody model comparison is used to validate the multibody models which are used for the complex configurations which cannot be represented by analytical models.
Figure 5.49. Comparison of Analytical and Multibody Model Results, xa=0

The muscular force of the pilots can be directly used to control the blades of a helicopter or control surfaces of an airplane, when these aircraft are small. As regards heavy aircraft, it is necessary to use an electrical or hydraulic force amplification system, Figure 5.50. Such force generator is position-slaved to reproduce the movement of the pilot’s control stick as regards displacements of the control surfaces by using external energy to obtain the amplification.
Figure 5.50. Helicopters of Different Tonnage With Different Control Systems: 5 Tons With Hydraulic System, and 0.6 Ton With Direct Mechanical System

A servomechanism is a system capable of slaving an output variable with production of energy to an input variable requiring little energy, the required energy being provided by another external source, Figure 5.52.
When the concerned variables are displacements or positions, the components involved are termed servocontrols [FAI 69, GUI 91, MAR 02].
Figure 5.51. Servomechanism on a Characterization Test Bench (Source: Eurocopter)

Figure 5.52. Servocontrol Behavior Schematization

Let us describe the operation and risk of instability which may happen on servocontrols associated with the controlled system.
The typical applications concern the hydraulic servocontrols which can be encountered on some aircraft.
On aircraft equipped with hydraulic servocontrols, the pilot controls opening of selector valves through link rods.
Figure 5.53. Selector Valve Schematization

Relative motion ε(t) of the selector valve body in relation to the control link rod is given by the following equation known as control equation:
[5.113] 
The flowrate is assumed to be proportional to the position difference between the inlet and the outlet.
Thus by assumption, the flowrate is expressed by:
[5.114] 
where α is the selector valve gain which mainly depends on the pressures involved.
Moreover, the second flowrate equation associated with the actuator piston motion is such that:
[5.115] 
where A is the effective cross-sectional area of the piston.
Using equations [5.114], [5.115], it can then be shown that:
[5.116] 
Using the Laplace operator, we have:
[5.117] 
Thus, the transfer function can be defined by:
[5.118] 
It can thus be shown that, as a first approximation, the servocontrol reacts such as a first-order linear system.
The system therefore tends to filter the link rod displacement at high frequencies: it behaves like a low-pass filter. For such type of technology, the servomechanism cannot be unstable. Let us illustrate the case of a servocontrol with differential lever.
Let us note e(t) the displacement of the input link rod, and s(t) the absolute output displacement of the actuator rod.
Figure 5.54. Control Lever Schematization

Figure 5.55. Control Lever Setup

The system geometry can be used to establish:
[5.119] 
In the case of the servocontrol studied, distances a1 and a2 are equal, i.e.:
[5.120] 
The flowrate equations being the same, the following is obtained:

Under these conditions, the system transfer function is then:
[5.121] 
More generally, the following is obtained for different lever arm values:
[5.122] 
Figure 5.56. Effect of Lever Arm on Servocontrol Transfer Function

It can be observed that the lever is used to change the servocontrol response rapidity but does not affect stability.
a) Effect of Mass Added at Actuator Output
The inertia effects of the controlled system must be taken into account. Thus, on a helicopter, the mass of the entire swashplate and blades plays an important role. Let us model such effects using a mass M.
Figure 5.57. Servocontrol Actuator Modeling With a Mass
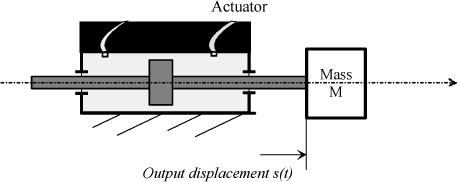
In this case, the inertia of the mass must be considered. When isolating the piston, the equation of motion gives:
[5.123] 
On the other hand, let us consider the compressibility of the fluid which provides some flexibility to the system. The fluid quantity flowing out of the selector valves is equal to the volume displaced by the piston plus the volume related to fluid compressibility, i.e.:
[5.124] 
where:
– β: coefficient of fluid compressibility,
– V: fluid volume,
– A: piston effective cross-sectional area.
On the other hand, the selector valve is characterized by its behavior equation with:
[5.125] 
where:
– α: selector valve gain,
– γ: pressure variation in relation to inlet/outlet difference. It depends on the temperature.
From equations [5.123] and [5.125], the following is deduced:
[5.126] 
From equation [5.124], the following is obtained:
[5.127] 
Using the Laplace operator, the transfer function is defined by:
[5.128] 
This third-order transfer function reveals a servomechanism stability condition which can be analyzed through a harmonic-state approach (p = iω). Thus:
[5.129] 
Thus:
[5.130] 
The eigenfrequency is obtained for:
[5.131] 
By analogy with the mass/spring system, the equivalent stiffness can be defined:
[5.132] 
The system behaves as a mass/spring system.
The spring stores the kinetic energy of the mass in the form of elastic potential energy. As the overall system energy remains constant, there is energy exchange between the mass and the spring, hence the oscillation phenomenon. Damping is related to frictions. Upon resonance, the output displacement may be amplified very significantly.
At low frequencies, the mass and spring vibrate in phase. At high frequencies, beyond the resonant frequency, they vibrate in phase opposition. The output displacement may be very low, slaving is no longer possible.
Figure 5.58. Response to a Step

Adding a mass at the actuator output contributes to make the system unstable. The following is indeed necessary for the servocontrol to be stable:
[5.133] 
That is, from [5.130]:
[5.134] 
Thus, for the system to be stable:
[5.135] 
It can be shown that there is a condition about the selector valve gain α to provide the system stability. This gain therefore cannot be indefinitely increased to improve the dynamic performance of the servomechanism without allowing for this instability phenomenon.
b) Effect of Support Rigidity/Anchor Stiffness
Let us now consider that the servocontrol attachment points are connected to the structure (fuselage on helicopter) through a support whose rigidity is no longer infinite.
The anchor rigidity is defined by K. Thus we have:
[5.136] 
It can then be shown that:
[5.137] 
Figure 5.59. Modeling of Effect of Flexibility on Attachment Connection

Using the Laplace transform, the transfer function expression gives:
[5.138] 
where:
– ωp eigenfrequency of servocontrol connected to mass M;
– ωS system eigenfrequency {mass M + spring};
where:
[5.139] 
The stability criterion, given by the Routh criterion, is then:
[5.140] 
If the support stiffness is increased, stability is favored.
Figure 5.60. Time Response to a Step

Figure 5.61. Nyquist Diagram

From the Nyquist diagram, it can be observed that the system may become unstable for low anchor stiffness values, Figure 5.61.
In the case of a servocontrol associated with a mass and an anchor flexibility, it is important to choose a gain allowing for observing a compromise between dynamic performance and stability.
In the definition of an aircraft, it is fundamental to provide for correct anchor stiffness of the servomechanism in order to prevent any instability phenomena.
Whirl flutter is an instability which appears for rotating systems placed in an airstream.
Two fundamental types of whirl flutter can be distinguished, forming two clearly identified theoretical cases. The induced motions are similar but result from distinct instability mechanisms:
– propeller whirl flutter. This type of instability appears on propellers for which the blades are rigidly connected to the hub. The plane defined by the blade tips therefore remains perpendicular to the engine pylon, and the blades can transmit bending moments to the hub;
– rotor whirl flutter. This type of whirl flutter appears on rotors having a flapping hinge. In such a case, the rotor plane does not remain perpendicular to the pylon, and the rotor eigendynamic data – mainly the lag of the rotor disk with respect to pylon tilting due to gyroscopic effects – plays an important role. As blades cannot transmit moments, destabilization is exclusively caused by the forces applied in the rotor plane.
Depending on the direction of rotation in which the propeller precesses around its nominal position, a “leading” mode and a “lagging” mode can be distinguished. In the first case, the precession rotational motion has the same direction as the propeller rotation; in the second case, it is opposed to this direction.
The convertible aircraft, or tiltrotor aircraft, is a transport aircraft which combines the performance data of a helicopter and a propeller airplane [NAC 03, BIE 92]. Its structure is close to that of an airplane, and two nacelles at the wing tips each support a rotor. The latter can pivot by about 90° and thus change the direction of the engines from a vertical position for the helicopter mode to a horizontal position for the airplane mode. If it has the advantages of an airplane and of a helicopter, it has also the relevant technical complexities, and any difficulties which may result from the association of both concepts, specially during the phase of conversion between both modes.
Figure 5.62. Convertible Aircraft Flight Phases

In addition to the overall complexity, this new type of aircraft is subject to a critical instability phenomenon already known on propeller airplanes but aggravated on the tiltrotor aircraft because of the large rotor sizes and relevant weights at wing tips. Thus, at high forward speeds in airplane mode, if some characteristics are incorrectly defined, this instability, known as whirl flutter, generates forces in the structure which may result in breakage of components, and have catastrophic consequences. This problem of aeroelasticity appears in the form of a divergent rotational motion of the rotor/pylon/nacelle assembly around its initial position, each one of the two rotors being concerned independently.
The whirl flutter phenomenon is related to the flexibility of the supports of the rotating section and variation of the aerodynamic forces generated by this flexibility. The tiltrotor aircraft, the rotor of which is usually located at a wing tip which features some flexibility, is particularly exposed to such type of problem.
The elements taking part in the phenomenon are the aerodynamic forces of the rotors, the masses of the engines at wing tips and the characteristics of the assembly which comprises the wing, the nacelle and the rotor.
A two-degree-of-freedom system can be used to illustrate the whirl flutter of a propeller, Figure 5.63. The model proposed considers a nacelle hinged in pitch (αy) and yaw (αz), with the rotor integral with the pylon.
Figure 5.63. Simplified Model Associated With Whirl Flutter Motion

Figure 5.64. Whirl Flutter Simplified Modeling
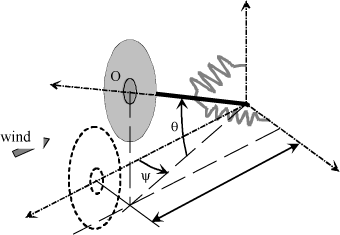
It consists of a rotating disk (Ω) perpendicularly connected to the end of a shaft having two angular degrees of freedom, yaw and pitch [BIE 92]. With stiffness K and damping C at each one of these degrees of freedom. The system is subjected to a constant relative speed ( ), in addition to its eigenmotion.
Figure 5.65. Self-Sustained Excitation Modeling

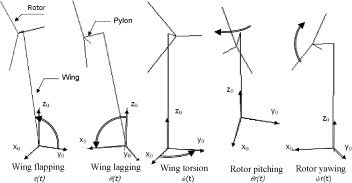
A more complete model is used to better assess the phenomenon. It retains five mobilities which are wing flapping, lagging and torsion, as well as the rotor balljoint connection broken down into yaw mobility and pitch mobility in the stationary reference system. The pitch and yaw motions of the rotor disk in the stationary reference system are firstly modeled by blade flapping β(t) in the rotating reference system.
Figure 5.66. Five Degrees of Freedom Retained for Whirl Flutter Study
The system can have the following matrix form:

The matrices obtained are [NAC 03]:


With the following constants:

By setting:

and:
– c: chord as a function of radius r,
– c0: mean chord value,
– Cz: aerodynamic lift coefficient,
– r: distance of the point considered,
– R: rotor radius,
– Ω: rotor rotational speed,
– V: forward speed,
– ρair: air density,
– Is1, Is2, Is3, Is4: moments of inertia of the wing and pylon assembly,
– IR: rotor disk flapping inertia,
– h1: half-wing length,
– e1: pylon length,
– Mrotor: rotor equivalent mass,
– γ: Lock number,
– Kψ: pylon yaw stiffness,
– Kθ: pylon pitch stiffness,
– Cψ: wing torsional damping,
– Cθ: wing lag damping,
– Cτ: wing flap damping,
– Cβ: blade flap damping.
In order to reset the model and better understand the rotor whirl flutter phenomenon, a convertible aircraft wing mockup has been designed to perform tests in wind tunnels.
The purpose of these wind tunnel tests is to study the rotor stability in relation to the wing stiffness. This is why a special device has been developed so as to vary the wing stiffness in torsion, flapping and lagging without changing wing.
This device uses blades which are loaded so as to make these stiffnesses vary.
The mockup diagram is thus the following:
Figure 5.67. Mockup Schematization
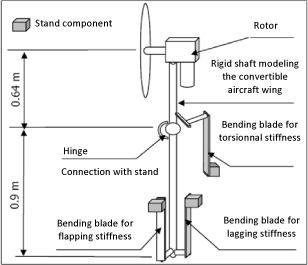
The model was reset through the identification of the wing flapping, lagging and torsional modes. To this end, stiffness sweeping of each blade, associated with these degrees of freedom, is done to reset the model stiffness associated with this component as a function of the test modal responses.
Figure 5.68. Whirl Flutter Test Bench (photo by: ENSAM)

The model was thus reset from the modes identified for all the blade length configurations.
The analysis by simulation of the effect of each model variable thus converged to values giving a numerical result close to the test point.
The wind tunnel tests must be compared with a model simulation in order to validate the model. Thus, the following curves show the system damping change as a function of the wind tunnel airflow speed V for three torsion blade stiffness configurations.
Figure 5.69. Damping Change Versus V
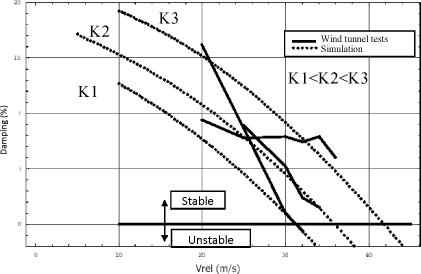
The simulation results are used to find out the critical instability speeds defined by experience, but do not follow the damping behavior prior to reaching the stability limit. This error is due to the fact that the balljoint connection between the shaft and the stand is not perfect. Frictions due to the type of technology used change damping as a function of the energy transmitted by the connection, which was observed upon identification of the lagging modes.
In order to validate this assumption, it would be necessary to limit such frictions by modifying this connection, and using a ball bearing system, for instance. Another series of simulations was implemented by considering this connection fault.
The model thus changes from a constant value of damping (former simulations) to a value function of the energy which crosses the connection. This effect was simulated by defining another damping through the use of a function dependent on speed V.
The results show (Figure 5.70) that the critical instability speeds remain consistent, and the damping trend is now more in adequacy with experience. These calculations only allow for checking the assumption of the effect of the balljoint connection on the mockup behavior before the stability limit.
Figure 5.70. Damping Change Versus V With Connection Fault Considered

Several parameters were studied to completely define the whole stability. Given that the model was validated, the curves given in this report are those provided by the model.
The displacement of the center is studied (by simulating a release) by varying the position of the stiffness eigenmode (through the blades) and the forward speed until finding the stability limits. Several configurations are used.
Table 5.2. Eigenmodes per Configuration

The results of configuration 1 are illustrated in Figure 5.71.
Figure 5.71. Variation of Each Degree of Freedom for a Speed V of 20 m/s
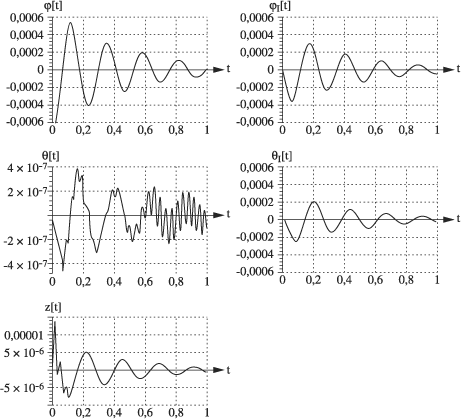
Figure 5.72. Variation of Rotor Center Position for a Speed V of 20 m/s

It can clearly be seen that the rotor head has a convergent motion since the oscillations are absorbed. A wavy motion can also be observed.
By increasing speed V, it can be observed that up to 32 m/s, the rotor head is at the stability limit (since the rotor head does neither diverge nor converge). Beyond this speed, the assembly is divergent.
Figure 5.73. Position of Rotor Head Center at a Speed of 32 m/s (Stability Limit)

Figure 5.74. Position of Rotor Head Center at a Speed of 34 m/s (Instability)

The results of the other simulations are almost the same, except that the limit speeds are different and the wavy motion disappears for configuration 3.
For studying this parameter, configuration 1 is used as a reference (this configuration is the reference for the study of all parameters unless otherwise specified).
Speed V acts on the torsional mode damping which becomes zero at 32 m/s.
The other modes are almost not affected by the speed variation.
The torsional mode frequency reduction observed during testing is also met by simulation.
The torsional stiffness has a substantial effect on stability such as illustrated in Figure 5.75.
Figure 5.75. Stability Versus Torsional Stiffness

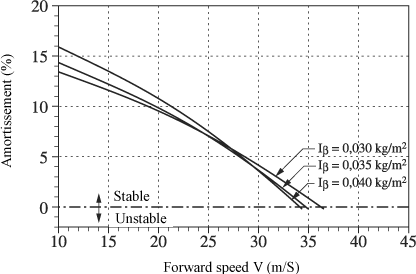
From the data of configuration 2, the moment of inertia of the blades tends to destabilize the system if its value increases in relation to 0.035 kg/m2 initial.
It can be seen that the greater the moment of inertia, the lower the speed V corresponding to the intersection of the curves with the stability limit line. This well shows that the moment of inertia tends to destabilize the assembly.
Figure 5.76. Effect of Blade Moment of Inertia
Using the configuration data, the destabilizing effect of connection K can be observed. For the same absolute value, the negative connection also proves slightly more stable as regards whirl flutter than positive connection K. The optimum value of connection K is −4.
By simulation, the results found during wind tunnel testing were also met, i.e., flapping had a stabilizing effect. Thus, the flapping stiffness must be very low for better stability.
The important point of these tests is that the critical stability speeds defined during testing were also met by calculation, as well as several results of the bibliographic study.
The interest is to increase the critical stability speed; to this end, several types of algorithm were used:
– single-variable control,
– LQG/LTR control,
– generalized predictive control.
It was necessary to modify the mockup prior to implementing these controls. Thus, the control system is hydraulic, the swashplate was reviewed with a reduced clearance between components, and additional sensors were installed on the mockup. A real-time computer has to manage the control algorithms.
A numerical model was also developed to model the new mockup. The design of such a description is complex since it must allow for the characteristics of the flexible wing, dynamics of the actuators or kinematics of the control system but also of the aerodynamics and gyroscopic effect. But such a model is essential as, to synthesize a controller, the system behavior must be optimally known. This new model was justified by a test campaign. Unfortunately, no model is identified in the unstable envelope, hence a compromise must be found if the flutter speed is expected to be exceeded.
This type of controller acts on a command (an angle of the swashplate) from a measurement at the system output [MUE 04]. Thus, the signal measured is conditioned using a filter and applied to the swashplate in such a way that the mockup reaction to the command is in phase opposition with the disturbing oscillation. A block diagram of the following type is therefore obtained:
Figure 5.77. Single-Variable Feedback Loop Block Diagram

Band-pass filter H1 filters the sensor signal around the resonant frequency, thus reducing the controller consequences on the system dynamics:
[5.141] 
The second part forms a pure phase shifter which adjusts the phase angle as a function of frequency wd:
[5.142] 
The purpose of this phase shifter is to generate a known phase shift at the resonant frequency of the mode to be controlled.
Parameter wd for a known phase shift φH2 is therefore calculated at frequency w = wr by solving the following according to wd:
[5.143] 
This type of control (like the generalized predictive control) takes account of several measurements to control several inputs at a time. The synthesis is obtained from a state representation of the system to be controlled.
This controller consists of two components: a Linear-Quadratic-Regulator (LQR) controller and a Kalman filter. The LQR consists in calculating an optimum gain matrix for feedback of the dynamic system states to the system inputs. The LQR requires knowledge of all the system states which usually cannot all be measured. This is why it is often accompanied with a Kalman filter used to estimate the system states from a limited number of output measurements. The controller and filter form the Linear-Quadratic-Gaussian (LQG) controller.
The departure point is the system state representation. This state system has the following form:
[5.144] 
Searching for the controller consists in searching for a matrix of gain Kc with:
[5.145] 
The matrix must stabilize the system and minimize the quadratic criterion:
[5.146] 
where:
– Q is a constant, symmetric, semi-definite positive matrix,
– R is constant, symmetric, definite positive.
When directly applied, this algorithm has excellent performance characteristics and an outstanding robustness.
Calculation of a command by predictive control is usually done by minimizing a quadratic criterion which implies the future input and output values, predicted by means of a mathematical model. The GPC (Generalized Predictive Control) is suited to processing of multivariable problems. Thus, to obtain a controlled system response, it is necessary to optimize the future commands. The predictive control principle can be schematized as follows:
Figure 5.78. GPC Operating Principle Schematization

The purpose of the GPC algorithm is to calculate the future inputs to be applied to the system in order to obtain the desired response.
The aeroelastic stability of the convertible aircraft can be described by curves (Figure 5.79) presenting the frequencies and damping values of the main eigenmodes. The damping and modal frequency are represented as a function of the forward ratio for the three wing modes ϕv, ϕt, ϕc, and progressive flapping mode β+. The curves are used to study the system behavior with no controller.
The only mode which becomes unstable is the wing vertical bending mode ϕv, the damping of which becomes negative at a critical forward speed μcritical = 0.94. As the flapping mode damping values are relatively substantial, there is no risk as regards system stability.
The mode to be stabilized is therefore ϕv in order to increase the flutter speed.
Figure 5.79. Natural Behavior With No Controller

As a reminder, the main purpose of active control is to increase aeroelastic stability of the aircraft. The controllers are evaluated according to the damping increase they provide in all modes, and their capability in pushing back the flutter speed.
The results in terms of critical forward speed are given in Table 5.3.
Table 5.3. Summary of Controller Performance Data in Terms of Critical Forward Speed
| Type of Controller | Critical Forward Ratio | Unstable Mode |
|---|---|---|
| None | 0.94 | Vertical bending |
| Single-variable | 1.11 | Regressive flapping |
| LQG/LTR | 1.21 | Regressive flapping |
| GPC | 1.15 | Regressive flapping |
The gain in terms of critical speed is 18% for single-variable control, 29% for LQG/LTR control, and 22% for GPC control. The mode which first diverges on the non-controlled system is the wing vertical bending mode qv. Since the controllers only act on the wing modes, these modes are very well stabilized.
The mode which becomes unstable, and very suddenly, is the regressive flapping mode: its damping drops by several tens of percent when the forward ratio increases by 0.2 only. The divergence of this mode results in the fact that the critical speed does not fundamentally differs from one controller to the other.
Thus, in the case of an actual application, the gain in terms of flutter speed, about 18% to 29%, is absolutely conclusive. For reasons of certification, a civil convertible aircraft cannot be designed in the medium term with a cruise speed higher than the natural flutter limit. The purpose of active control would firstly be to reduce the stability margins required by the regulations, in relation to the flutter speed, so as to effectively be capable of certifying a civil aircraft. This may entail considerable gains in terms of weight and effectiveness in cruise flight, since such intrinsic stability can be obtained only through extremely rigid structures.
Three operational solutions are proposed, each having its advantages and drawbacks depending on the operating context, priorities, etc.
LQG/LTR controller:
– the best promising for the application contemplated,
– excellent characteristics in terms of performance and robustness,
– reliable and controlled technology,
– simple real-time achievement.
Single-variable controller:
– very well suited to industrial case,
– dynamic data very accurately quantifiable,
– determination of its simple effect,
– will facilitate further certification of the system.
GPC controller: this type of corrector can self-match the configuration changes.
The whirl flutter phenomenon, in the case of a convertible aircraft, integrates a substantial number of degrees of freedom of the rotor (flapping + lagging) and wing (bending + torsion).
Instability is created and maintained through appearance of aerodynamic forces resulting from the blade angle-of-attack variation itself caused by the nacelle torsional/bending motions under the effect of gyroscopic forces induced at the rotor.
Under some operating conditions, this may lead to breakage of a component or wing/rotor assembly.
Figure 5.80. Summary of Whirl Flutter Principle

It was demonstrated that whirl flutter on a convertible aircraft is caused by a coplanar force (in the rotor plane) generated by the rotor itself. In order to destabilize the system, this force must appear at the eigenfrequency of the unstable mode, hence be coupled to this mode.
Moreover, it must be applied with a phase shift, in relation to the Lagrange displacement, which must be capable of injecting energy into the aeroelastic system.
In the vibration linear theory, the forces which have a phase lead between 0° and 180° provide energy to the system, phase lags down to −180° being conversely stabilizing.
This allows flutter – and usually, any convergent or divergent harmonic phenomenon – to be formulated using a complex stiffness, the divergence then appearing as negative overall damping.
To represent the appearance of such mechanism which causes whirl flutter, let us consider the time representation of a flight phase where the mockup successively moves with and without controller. The flight speed is beyond the natural limit of stability at μ=0.97, and the example of the LQG controller is retained. As a matter of fact, this controller has the advantage of modifying the vertical bending mode frequency fv only very slightly with respect to the open-loop configuration.
The curve in Figure 5.81 is an enlargement of the vertical bending degree of freedom ϕv. Only the simulation period between t = 14 s and t = 16 s is presented, the controller being initiated at t =15 s. The vertical coplanar force “H-force” is represented in the same figure.
Figure 5.81. Active System Effectiveness Measurement

Since it is vertical, force H directly acts on the vertical bending mode qv and torsional mode qt. It can clearly be observed that this force has the same frequency as mode qv, with a slight phase lead in the uncontrolled envelope, causing the system to slightly diverge. However, from initiation of the controller at t = 15 s, this phase lead is converted into a lag by the action of the controller. In closed-loop configuration, the system is therefore stabilized by the same force which makes it diverge in open-loop configuration, through adjustment of its phase, which shows the pertinence of flight control operated by the controller.