Figure 1.1. Tacoma Narrows Bridge Destruction

A number of accidents and structure deteriorations are due to an unstable behavior. The accident of the Tacoma Narrows Bridge, Figure 1.1, forms a typical example. On airplanes, the flutter phenomenon, the instability due to flexibility of the lifting surfaces and aerodynamic forces, limits the performance. The stability check is part of the design objectives for mechanical systems, such as static or fatigue strength check.
Figure 1.1. Tacoma Narrows Bridge Destruction

Instability can be intuitively defined such that, if a system is placed out of its equilibrium position, it leaves this position whatever the initial conditions may be (divergence). Otherwise, the system is defined as stable [BON 94, BIE 92, ROS 84, ROC 71].
This intuition can be mathematically converted using the solution of the differential system formed by the equations of motion. Consider a mechanical system with n parameters, noted qi, such that:
[1.1] 
The most frequently used notion of stability is that resulting from the Lyapunov theory. Two initial close conditions give close motions in the case of stable motion. With regards to unstable motions, two initial close conditions give increasingly separated motions.
Let  and
and  be two distinct motion states resulting from close initial conditions
  and
and  . The motion will be said to be stable in the sense of Lyapunov if λ can be made correspondent to any ε arbitrarily small and positive, such that:

results in:

Moreover, if  and
and  , the motion is said to be asymptotically stable.
Two methods can then be distinguished to determine the stability of a system: a direct method and an indirect method.
For these methods, it is necessary to determine the differential equations which govern the system motion by using conventional mechanics tools: general theorems, Lagrange equations, principle of virtual powers, etc.
Stability in the sense of Lyapunov can be seen like a mathematical expression of a basic finding: if the total energy of a system dissipates continuously, then this system, whether linear or not, stationary or not, tends to return to its equilibrium position.
Consider the following system of differential equations:
[1.2] 
which admits equilibrium state x=0, with f(0)=0.
According to the Lyapunov’s theorem, equilibrium state x = 0 is stable if a scalair function exists, noted U(x) and termed Lyapunov function, such that:
Ω is a region of Rn around 0.
Moreover, if inequality [1.3] is replaced with  , then the equilibrium state is asymptotically stable.
It should be noted that function U(x) is considered as being dependent on t through x, hence:
[1.4] 
This theorem is a sufficient stability condition but does not guide the user in the choice of the Lyapunov function and does not allow for any conclusion if such a function is not found. A Lyapunov candidate function is a positive-definite function, the decrease of which is tested around the equilibrium point. The study of the methods allowing for the construction of a Lyapunov candidate function for a given system was the reason for a lot of material. The quadratric forms are the most commonly used, specially the positive-definite functions which are first integrals (i.e., the time derivative is nil) of the idealized system (for example, the total energy of an ideally conservative mechanical system).
This method can be illustrated through the example of a mass-spring system, Figure 1.2. Assume that the actions of the spring and damper are nonlinear, such that:
[1.5] 
Figure 1.2. Modeling of a Single-Degree-of-Freedom System in Translation

Application of the fundamental principle of dynamics to solids gives the following equation of motion:
The following Lyapunov function is chosen:
[1.7] 
The derivative of the potential function is then:
[1.8] 
The following is obtained using equation [1.6]:
[1.9] 
Lyapunov function [1.7] is positive and derivative function [1.9] is negative, thus showing that the system is asymptotically stable.
The indirect method concerns the local stability of nonlinear systems. This is an intuitive approach: a nonlinear system behaves as an approximated linear system by assuming that the parameters of this system do not much vary around the linearization point.
Assume that the system responds to the following behavior equation:
[1.10] 
where:
– x: state variables,
– u: system commands.
Function f can be linearized to the first order; the following is obtained:
[1.11] 
 orders higher than the first order.
A linearized function of the system behavior around point x=0 and u=0 can then be obtained, by:
[1.12] 
where:

All the conventional methods, associated with linear systems and presented in the remainder of the chapter, can then be applied.
The interest of these analysis methods, known as Lyapunov’s methods, is to assess the stability of a system without integrating the differential equations which describe its behavior. The drawback is that they only provide sufficient conditions and that nothing can be concluded if the condition is not met. For the same reasons, they may provide a pessimistic (or conservative) result.
In the case of linear systems, some techniques are derived from the Lyapunov theorem. The latter may provide a necessary and sufficient condition for stability, Figure 1.3. We intend to present a number of techniques that we will use further on in the next chapters.
Figure 1.3. Summary of System Stability Analysis Methods

We are going to distinguish modeling based on single-degree-of-freedom systems, sufficient to analyze some phenomena, and modeling which use several degrees of freedom, often requiring heavier analysis and calculation means.
Among all types of instability, we are going to distinguish between self-sustaining instabilities and parametric instabilities.
Self-sustaining instabilities concern coupled systems. Two classes of problem can be observed:
– one system, generally defined as being the primary system, is naturally stable. Coupling with the secondary system is such that, in some cases, the energy initially injected into the system by the external disturbance generates divergent, hence unstable vibrations;
– the primary system is naturally unstable. The secondary system can be defined so as to render the vibrations convergent and hence stable.
Figure 1.4. Schematization of a System With Self-Sustained Vibrations

A great number of industrial problematics corresponds to such behaviors. A few examples are developed in the next chapters. Self-sustained vibrations can be merely illustrated by the flutter phenomenon, coupling between a flexible structure, airplane wing for instance, and aerodynamic forces, Figure 1.5. For some airfoil and relative speed configurations, the system has a stable or unstable behavior.
Figure 1.5. Self-Sustained Vibrations – Case of Flutter

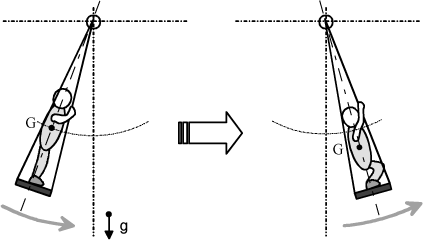
Parametric instabilities result from time variation of the system parameters (mass, stiffness, etc.). This case can be illustrated by the conventional example of a child on a swing who cyclically squats down or stands up to increase or decrease the swing amplitudes, Figure 1.6. As the position of his center of gravity varies, there is a variation frequency where the system is unstable, which is the objective in this example: the child wants to increase his swing amplitudes.
Figure 1.6. Parametric Vibrations – Example of Swing
The notions of vibratory resonance and instability are unfortunately sometimes mixed up: in both cases, they lead to great amplitudes and then to structure deterioration. However, the behavior mechanism is different, and the determination criteria are not obtained by the same methods. We propose to interpret and differentiate the resonance and instability phenomena through the analysis of the forces involved in a system.
By definition, the notion of resonance results from the analysis of the response of a system to an imposed excitation: this is known as forced response. For example, consider a system consisting of a mass, a spring and a viscous damper, both having a linear behavior, Figure 1.7. The system is excited by an external action F(t).
Figure 1.7. Modeling of a Single-Degree-of-Freedon System With Linear Behavior

Assuming that there is no spring prestress, the differiental equation which governs the system motion is written as follows:
[1.13] 
m, c, k positive magnitudes.
The solution of this differential equation corresponds to the superimposition of the solution of the general (or homogeneous) system xg and a particular solution xp:
[1.14] 
General solution xg may be of the overdamped, critical or underdamped type. In all of these cases, provided that m, c and k are positive, the system is stable. Damping ratio ξ and eigenfrequency ωp are usually defined such that:
[1.15] 
The system type will be specified according to the damping ratio:
[1.16] 
Depending on the system type, and introducing constants A, B or ϕ which depend on the initial conditions, solution xg(t) to the homogeneous system can be written:
[1.17] 
The shape of response xg(t) if the system is moved away from its equilibrium position, with no external excitation, enables the effect of damping to be analyzed, Figure 1.8.
Figure 1.8. Response to a Discrete Input – Effect of Damping

In the case of a harmonic excitation F(t), particular solution xp(t) of equation [1.13] is also harmonic, phase-shifted by ϕ, such that:
[1.18] 
In this case, amplitude x0 and phase shift ϕ of the response are shown to be defined by:
[1.19] 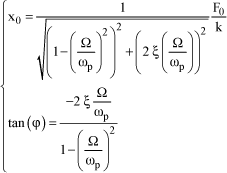
Amplitude transfer function H, ratio x0/F0, can be plotted as a function of excitation frequency Ω, Figure 1.9.
Figure 1.9. Transfer Function for Several Damping Ratio Values

By definition, resonance frequency Ωr corresponds to the transfer function maximum (if any). Thus, for a damping ratio ξ less than 70.7%, the resonance frequency is defined by:
[1.20] 
Damping ratio ξ has a significant effect on the amplitude as regards the resonant frequency, Figure 1.9. These amplitudes are not divergent. However, if damping is low, excessively large vibration amplitudes may lead to system breakage. The structure behavior to resonance can be interpreted by using a representation in the complex plane, similar to the notion of Fresnel rotating vector. Thus set the following in complex coordinates:
[1.21] 
By this variable change, equation of motion equation [1.13] becomes [BIE 92]:
[1.22] 
The plot of all effects, perceived as forces, in the complex plane enables several behaviors to be analyzed depending on whether the observation point is before or beyond resonance, Figure 1.10.
Figure 1.10. Fresnel Representation in Complex Plane
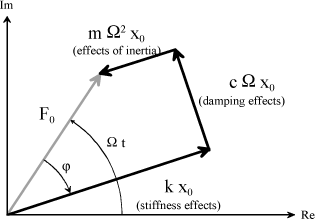
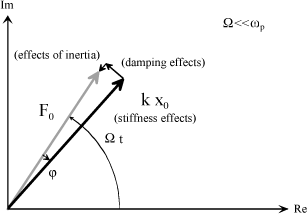
Significantly before resonance, the excitation frequency is such that: Ω<<ωp. Behavior equation [1.22] is then reduced to:
[1.23] 
The Fresnel representation shows that the external excitation force is mainly opposed to the effects of stiffness. It should be noted that angle ϕ is close to 0, the displacement is quite in phase with the excitation.
Figure 1.11. Fresnel Representation in Complex Plane – Ω<<ωp
The excitation frequency is assumed to be such that:  . Behavior equation [1.22] is then reduced to:
[1.24] 
Figure 1.12. Fresnel Representation in Complex Plane – Ω<<ωp
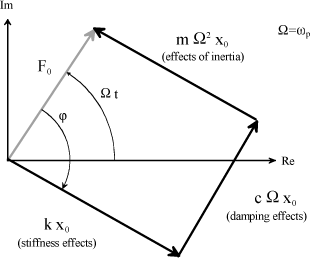
The Fresnel representation shows that the external excitation force is mainly opposed to the effects of damping. The effects of inertia and stiffness cancel each other out. Low damping is sufficient for a low-amplitude external force to cause large amplitudes of motion and hence damage to the structure. The displacement is in phase quadrature (90° phase shift) with the excitation.
The excitation frequency is assumed to be such that: Ω>>ωp. Behavior equation [1.22] is then reduced to:
[1.25] 
The Fresnel representation shows that the external excitation force is mainly opposed to the effects of inertia. The displacement is in phase opposition (180° phase shift) with the excitation.
Figure 1.13. Fresnel Representation in Complex Plane – Ω>>ωp

The blades of a helicopter rotor are generally linked to the hub by the equivalent of a balljoint. Each blade has three degrees of freedom, each having a function, are identified as pitch θ, lag δ and flap β, Figure 1.14.
Figure 1.14. Helicopter Blade Motion Parameterization

Equation setting of the lag motion of a blade shows that, in forward flight, the aerodynamic forces create a periodic excitation whose frequency corresponds to the rotation frequency.
Figure 1.15. Definition of Blade Speed on Helicopter
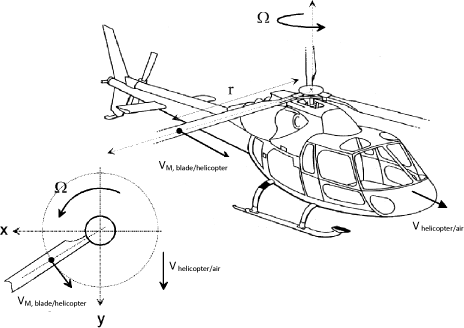
The air relative speed at a given point of the blade is defined as being the combination of the rotational motion of the blade in relation to the hub, and the uniform translational motion of the helicopter. The airstream is assumed to be stationary and the blade moving in a plane perpendicular to the axis of rotation. Speed U(r) can thus be defined as being the radial component of the blade/air relative speed at a point M. As a first approximation, this speed is a function of the azimuth, such that:
[1.26] 
where:
– V: helicopter forward speed,
– Ω: rotor rotational speed,
– r: longitudinal position of point M considered.
Using almost static modeling, the aerodynamic lift forces are expressed by:
[1.27] 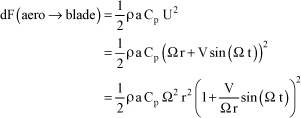
where:
[1.28] 
Aircraft forward speed V, where the lift is significant, is very low compared to the linear speed of the airfoil point considered (Ω r).
The aerodynamic force expression can be broken down into a Fourier series, showing that the blade is stressed at all the successive harmonics of the rotational speed.
Consider the primary harmonic at 1 Ω, with Ω being the rotor rotational speed [KRY 03], the equation of blade lag motion can be written in the following form:
[1.29] 
Where I is the blade lagging inertia, Kδ is the stiffness, and cδ the damping generated by the lead-lag damper, Figure 1.16. Ma corresponds to the amplitude of the moment of the aerodynamic forces.
Figure 1.16. Lead-lag damper Integrated with a Helicopter Rotor

Figure 1.17. Lead-lag Motion of a Helicopter Blade

The lead-lag damper (or adapter) is sized according to several criteria. In particular, resonance at 1 Ω must be avoided through adapter stiffness kδ and damping cδ. The damping ratio is low enough, in this type of application, to mix up, for this criteria, the values of resonant frequency Ωr and eigenfrequency ωp:
[1.30] 
As a matter of fact, it is necessary to analyze the eigenfrequency value ωp of the rotor for an excitation at 1 Ω, as well as for its harmonics.
The eigenfrequency and damping ratio for the lag motion are given by:
[1.31] 
It is usual and more convenient to define the characteristics related to Ω, i.e.:
[1.32] 
Figure 1.18. Lag Frequency Setting as Regards Rotational Speed and Related Harmonics

Technologically, there are several possibilities to set the eigenfrequency through Kδ as regards frequency Ω.
For hinged rotors, or fully articulated, the reduced frequency is set between 0.3/0.5.
For non-hinged rotors, hingeless or bearingless, the reduced lag frequency is set to 0.7/0.8 (soft in-plane), or to 1.4/1.6 (stiff in-plane).
Using equation [1.29], we can show that the dynamic lag response is of the following form:
[1.33] 
We show that the greater the damping, the lower the vibration amplitude, Figure 1.19.
Figure 1.19. Effect of Reduced Damping on Vibration Amplitudes

A method to size the damping as a function of the stiffness consists in defining a ratio, noted R, between the equivalent moment of the adapter and the moment created by the external force.
The following is thus shown:
[1.34] 
A value of R can thus be determined for a stiffness value of Kδ, and the reduced damping can thus be obtained as a function of the reduced frequency, [1.35]:
[1.35] 
We thus obtain curves R represented in Figure 1.20.
Figure 1.20. Reduced Lag Frequency and Reduced Damping Compromise for Several Values of R

To reduce the amplitude of the response, observe that it is possible to:
– increase damping;
– space the eigenfrequency from the excitation frequency.
For a reduced frequency of 1 and zero damping, the amplitude is infinite.
By increasing damping, the figure shows that, for 7% damping, the amplification is 5 (point A) whereas, for 45% damping, the amplification is only 1.25 (point B).
On a helicopter rotor, in order to have low amplification of the excitation forces, the first lagging mode is usually set below 0.7 Ω, Figure 1.20.
The force diagram can be represented as a function of the rotor rotation frequency, before, after or upon resonance.
Figure 1.21. Fresnel Representation in Complex Plane for a Lagging Blade
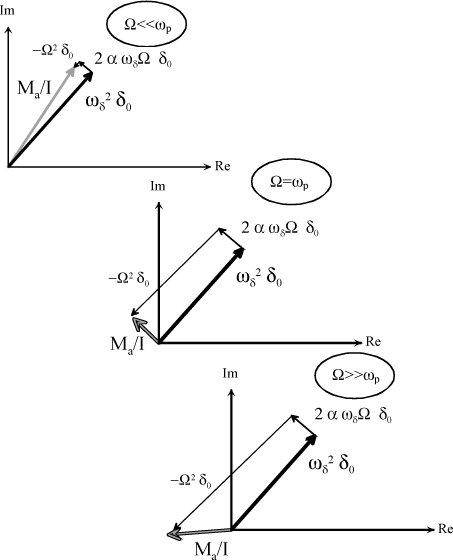
The notion of stability is defined by studying the free response of the system.
To illustrate the notion of stability, we consider the self-sustained vibrations for the case where the external actions are proportional to the speed: in some cases, the latter may be opposed to natural damping of the structure.
Take again the example of a single-degree-of-freedom structure, Figure 1.7, whose differential equation of motion is of the following form:
[1.36] 
Assume that the external forces, proportional to the speed, are of the following form:
[1.37] 
The structure behavior can be interpreted by using a representation in the complex plane:
[1.38] 
Thus, equation [1.36] becomes:
[1.39] 
The latter equation shows that, in the complex plane, there is a phase shift between the effects of inertia, the damping effects and the stiffness effects associated with the argument of complex p [BIE 92]. Note:
[1.40] 
All the forces can thus be drawn in the complex plane. Observe that the excitation is opposed to the damping effects and thus, depending on the value of coefficient α, may generate instability. In this case, inertia and stiffness have little effects.
Figure 1.22. Representation in Complex Plane

In order to analyze the stability of systems, several methods associated with the modeling type used can be distinguished.
Within the scope of mechanics or automatic control, the state representation is widely used. This concept was systematically introduced by R.E. Karman, and developed for the first spatial applications at the beginning of the 1960s. The state representation is an internal representation based on the state concept and applicable to time-variant and (or) nonlinear systems. In the studies exposed further on, only the systems which can be studied using linear models of the time-invariant type (LTI system) are considered. The latter are represented by a system of linear differential equations with constant coefficients.
It is sometimes necessary, or preferable, to use external models (of the input/output type) which use the minimum information to model the system behavior. This will be the case when the behavior of a structure is experimentally studied using vibratory measurements. In this case, we also consider the case of linear time-invariant systems (LTI). We will essentially use the models based on the notion of transfer functions. The latter models are represented by a transfer function for the single-input/single-output (SISO) systems and a transfer matrix for the multi-input/multi-output (MIMO) systems.
The mechanical systems studied are usually governed by second-order differential equations derived from the principles of mechanics (general theorems, Lagrange equation method, etc.) [DUT 97]. In the case of small movements about an equilibrium position, the equations of motion can be linearized and then written in a matrix form of the following type:
[1.41] 
Consider any matrices M, C and K a priori. Matrix M will then be assumed to be invertible. In most cases, matrix M results from the kinetic energy which is a positive-definite quadratic form. In this case, matrix M is symmetrical. Vector X represents the position vector, of dimension n corresponding to the number of degrees of freedom, such that:
[1.42] 
The most general method consists in using the method proposed by the automation engineers and which uses a state representation. To this end, the following matrix is introduced first:
[1.43] 
where:
– A: matrix, known as state matrix, of dimension [2n,2n],
– I: unit matrix of dimension [n,n],
– O: zero matrix of dimension [n,n].
From equation [1.41], the following system is obtained:
[1.44] 
With state vector Θ of dimension 2 n:
[1.45] 
and:
[1.46] 
The stability study is reduced to the study of the sign of real parts ak of eigenvalues sk of matrix A: stability is ensured when all the real parts of the eigenvalues are negative or zero [BIE 92].
Figure 1.23. Eigenvalues in Complex Plane and Stability Area

Depending on the values of imaginary part bk of the eigenvalues, the system can be oscillating or not. The type of motion, stable/unstable or oscillating or not, can be graphically analyzed in the Nyquist plane, Figure 1.24.
Figure 1.24. Eigenvalues in Nyquist Plane and Stability Area

The notion of dominant poles simplifies the study of the time response of a complex system [DUT 97]. All the eigenvalues (poles) of a stable linear system are contained in the left portion of the Nyquist plane. The dominant poles are the poles closest to the imaginary axis.
Figure 1.25. Notion of Dominant Poles
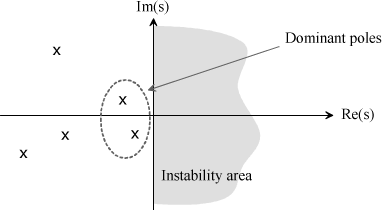
The study of the system can then be reduced to an equivalent system only presenting these poles.
Let us take the case of a complex system such as the helicopter can be. The latter is subjected to mechanical and aerodynamic vibations. Several subassemblies can be distinguished: the rotor, the fuselage and the power system. We can illustrate the notion of dominant poles from an instability phenomenon due to rotor/structure coupling (“ground resonance”).
The helicopter is subjected to aeroelastic coupling between all subassemblies. In order to prevent vibrations, the designers introduce a connection element, the lag adapters, between the blade and the rotor. This study is more detailed in Chapter 2. Here we will only retain the essential elements to illustrate the notion of dominant poles.
The following parameters are involved:
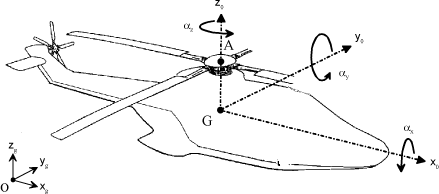
– x, y, z: fuselage center-of-gravity location with respect to the Galilean reference system,
– αx, αy, αz: fuselage rotation (roll, pitch, yaw),
– δi, βi: lag and flap angle of blade i,
– θi: rotation of power system components.
Which gives 19 independent kinematic parameters in total.
Figure 1.26. Blade Reference Systems
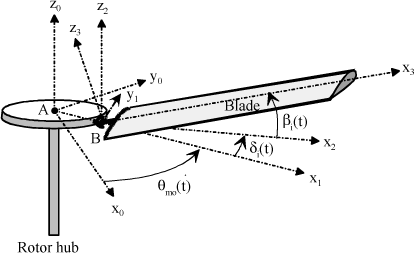
Figure 1.27. Fuselage Reference Systems
The system of dynamic behavior equations is then written in the following form [MAL 97]:
[1.47] 
X represents the position vector including the 19 parameters. Vector F represents the control vector. The notion of dominant poles can be used to simplify the model.
Figure 1.28. Reference Systems Related to Fuselage Simplified Kinematic System

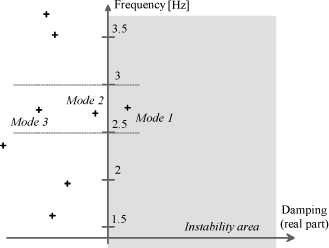
Figure 1.29. Poles of Helicopter on Ground Within 0–5 Hz Range
The poles of the complete system are obtained using the state system representation:
[1.48] 
The poles of the transfer system correspond to eigenvalues si of A. Simply observe the position of the poles in the complex plane to derive the system stability. Demonstrated in Chapter 2, the result shows that there are dominant poles.
During testing and analysis of the transfer functions of each parameter, it was demonstrated that resonance occurs at a frequency of 2.8 Hz for the modes with a high lag component. Result found by modeling, mode 1 is unstable, Figure 1.29.
The dominant poles can be determined in this case by studying the mode deformation. Thus, for each eigenvalue si, the associated eigenvector Vi can be determined.
To this end, solve equation:
[1.49] 
In order to determine the dominant poles, look at the amplitude of the eigenvector associated with each parameter. The result thus obtained for modes 1, 2 and 3 is illustrated in Figure 1.30.
Modes 1 and 2 are modes of coupling between the fuselage (roll and motion along y) and the cyclic flap and lag motions of the rotor. The first one is unstable and the second one is highly damped.
Mode 3 is a mode of coupling between the components of the power system and the collective lag motion of the blades.
To study the rotor stability, we could merely use an equivalent model only representing the motions of the rotor head (due to y and αx) coupled to the cyclic lag motions (δ1c and δ1s). These variables will be used in the chapter dealing with the instabilities due to rotor/structure coupling (Chapter 2).
Figure 1.30. Modal Deformations of Rotor/Structure Coupling (Case of Ground Resonance)

A matrix analysis method can be used [BIE 92] to determine the degrees of freedom which couple together and make the system unstable. As a rule, the system behavior equation has the following form:
[1.50] 
The solution of the homogeneous system of equations [1.50] has the following form:
[1.51] 
where:
[1.52] 
If the general solution is injected into the dynamics equation with no excitation, the behavior equation becomes:
[1.53] 
System which can be broken down into n equations of the following form, for each mode k:
[1.54] 
Each equation is a combination of an effect of inertia, a damping force and a stiffness force with an excitation force noted fk:
[1.55] 
This equation can be represented in the complex plane. Note θk the argument of eigenvalue sk.
Figure 1.31. Representation of Mode n in Complex Plane
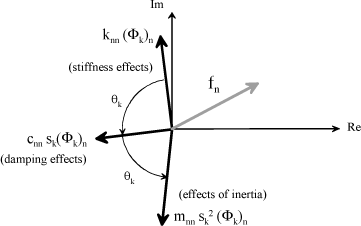
As angle θk is less than 90°, it can be observed that the real parts of the stiffness, damping and inertia effects are negative. Part fn has a real part which can be positive or negative, and can therefore be opposed to the damping effect or go in the same direction. For the nth degree of freedom, we will say that, if fn has a positive real part, it is destabilizing; otherwise, it is stabilizing for this degree of freedom.
From these different representations, matrices, termed force phasing matrices or FPMs, can be defined:
[1.56] 
where:
[1.57] 
The interest of this method, which uses force phasing matrices, lies in the possibility of identifying the paths of energy flow causing mechanism instability. To this end, it is necessary to:
– identify the most active degrees of freedom from the information given by the eigenvectors for the unstable modes involved;
– search for the greatest positive value in the force phasing matrices involving the most active degree of freedom identified in the preceding step. These elements are the drivers for the unstable motion.
We propose to illustrate the application of this method through the case of flap/lag coupling.
The reference systems and parameterization are indicated in Figure 1.32.
Figure 1.32. Blade Motion Parameterization

It can be shown that the linearized equations of blade flap and lag motion, for small angles, are given by [KRY 03]:
[1.58] 
where:

It can be observed through the equations that there is coupling due to effects of inertia which will affect the lag motion; this coupling is associated with the Coriolis effects ( ).
).
There is also coupling due to Coriolis effects in the flap equation ( ) but these effects are negligible and have not been considered.
Referring to reference system R1 related to the hub, the effects of inertia appear as a force known as Coriolis force. This force can be illustrated by the motion of an ice cube sliding with no friction over a disk subjected to constant rotation Ω. The ice cube is launched toward the center at a speed V0.
If the disk is stopped, the path is a straightline and its speed is uniform; no action is opposed to its motion. If the disk is rotating, it can be observed that the path is not rectilinear but deviated: these are the Coriolis effects, Figure 1.33.
Figure 1.33. Illustration of Coriolis Effects

The blade pitch θ is controlled through a control link rod. The kinematics of this control is such that a flap or lag motion results in a pitch change.
Assume that this behavior is almost static and linear, characterized by Kβ and Kδ. These couplings are due to the rotor kinematics design [KRY 03].
For example, for the pitch-lag coupling, Figure 1.34, the bank angle of the pitch control rod reduces the pitch for a forward lag motion when Kδ is positive. As regards kinematic flap-pitch coupling when the blade moves up, the pitch is reduced; this is the negative pitch-flap coupling. For a stabilizing effect on the helicopter, usually, pitch-flap coupling is negative and pitch-lag coupling is positive. The values are relatively low so as not to alter the rotor behavior. The coupling values are below 0.2 for the main rotor, and below 0.7 for the tail rotor.
Figure 1.34. Pitch-Flap and Pitch-Lag Coupling

Thus, this coupling is modeled through the following form:
[1.59] 
Thus, equations [1.58] are written in the following form:
[1.60] 
The system of equations can have the following matrix form:

where:
[1.61] 
[1.62] 
The search for eigenvalues sk is done by studying:
[1.63] 
And the search for eigenvectors Φk by:
[1.64] 
For this type of mechanism, it is useful to know parameters Kδ and Kβ which ensure stability for a given rotor. The following data are used:
[1.65] 
If parameters Kδ and Kβ are zero, it can be shown that the eigenvalues of the system have a negative real part and, consequently, the system is stable:
[1.66] 
The system can be analyzed for an unstable case. For example, let:
[1.67] 
Parameter scanning can be used to assess the effect of parameters Kδ and Kβ on system stability, Figure 1.35. The values usually applied to the rotor are very low while allowing for remaining within the stability area.
Figure 1.35. Rotor Stability Area. Plotting of Real Parts of Eigenvalues Versus Kδ and Kβ

Whenever the system responds to a causal behavior, it can be represented by Figure 1.36.
Figure 1.36. Schematization of a Transfer Function of a System

The relation between the cause (mechanical action) and the effect (vibration) can be set in the form of a ratio of two polygons of degrees m and n, respectively, through the Laplace transform of the system transfer function:
[1.68] 
By Routh criterion is meant algebraic criterion used to assess the stability of a system from the coefficients of denominator D(p) of its transfer function.
This criterion is very effective since it is not necessary to compute the roots of polynomial D(p).
This criterion results from a method used to count down the number of roots with positive or zero real part of polynomial D(p).
This method is itself derived from the study of the Hurwitz polynomials, and consists in forming Table 1.1.
Table 1.1. Routh Table

The first column is known as the pivot column. The first row contains the coefficients of pn-2k terms, in order of decreasing powers.
The second row contains the coefficients of pn-1-2k terms, and ends according to the parity of n.
The next rows are completed in compliance with the following formation laws:
[1.69] 
If necessary, an empty box is taken as equal to zero. The rows are computed until the first column is completed.
The criterion wording is as follows: the system is stable if and only if all the terms of the first column are strictly positive.
Among the method properties, the following will be retained:
– there as as many roots with positive real part as sign changes in the first column;
– rows of zeros appear to indicate the existence of pure imaginary roots (in pairs). In this case, which corresponds to an oscillating system, the table is continued by replacing the zero row with the coefficients obtained by deriving the polynomial reconstituted from the upper row, the pure imaginary roots being the imaginery roots of this bisquare polynomial reconstituted.
This criterion can be used to know whether a system is stable or not in simple and quick way. It provides information on stability but not on robustness of this stability. The transfer function expression must be known to implement the latter.
In the case of a polynomial of order 3, the criterion result can be stated more simply:
[1.70] 
The Routh criterion then comes down to the sufficient conditions for stability:
[1.71] 
In the same way, in the case of a polynomial of order 4:
[1.72] 
The Routh criterion comes down to the following sufficient conditions:
[1.73] 
The results of this criterion are used when developing examples in the next chapters.
Some criteria originate from the study of the isochronous transfer function: the excitation is of the harmonic type. The transfer function is thus a function of frequency ω.
Figure 1.37. Schematization of a System Isochronous Transfer Function

By definition, the Nyquist locus is a polar curve parameterized with frequency ω. It corresponds to the plot of the transfer locus in the complex plane, the Cartesian coordinates of which are Re(ω) and Im(ω). The curve is always oriented in the increasing ω direction.
The Nyquist criterion resulting from the Cauchy’s theorem is used to study the zeros of the denominator of transfer function H(ω). We propose to use the simplified left-hand criterion.
By representing the Nyquist locus of the open-loop transfer function, we can know the stability of the closed-loop system.
To this end, simply interpret the graphs represented in Figures 1.38 and 1.39 while checking that, for each pole, the curve passes on the right of point (−1,0) in the Nyquist plane, known as critical point.
Figure 1.38. Graphical Representation of Nyquist Locus
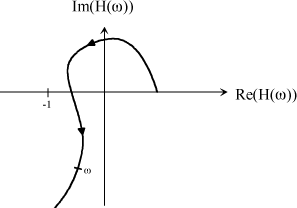
REMARK.– The number of encirclements about −1 is the number of strictly positive real roots. Example given in Figure 1.39.
Figure 1.39. Simplified Nyquist Criterion: Left-Hand Criterion

If the system studied is multivariable and described by its transfer matrix G(ω), the closed-loop system is stable if and only if, when ω describes the Nyquist contour, the number of encirclements about the origin and counterclockwise of equation det(I+G(ω)) is equal to the number of open-loop unstable modes.
Figure 1.40. Schematization of a Closed-Loop System

Due to the fact that the modulus and phase of the transfer function of a system are often accessed experimentally, it is more convenient to use the Black-Nichols chart.
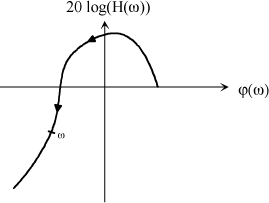
The Black-Nichols locus represents the transfer locus in a plane whose abscissa is the argument of the frequency response in degrees (φ(ω) deg) and whose ordinate is the modulus of the frequency response in decibels. The curve of the transfer locus in the Nichols-Black plane is also a curve parameterized with frequency ω and must therefore be graduated accordingly. It is therefore always oriented in the increasing ω direction, Figure 1.41.
The major advantage of such a representation is related to the additivity property of the amplitude expressed in decibels, and of the phase. This allows for easy graphical representation of the transfer function products.
Figure 1.41. Graphical Representation of Nichols-Black Locus
In the particular case of a mechanical system where all forces, including interforces, other than the connection forces, are derived from a potential, an analytical criterion can be used without having to develop the linearized equations of motion. The philosophy of the method lies in the mathematical extension of a fundamental observation of physics: “if the total energy of a system is dissipated continuously, then the system (whether linear or nonlinear) will have to finally meet an equilibrium point”. Stability can be analyzed by a single scalar function corresponding to the total energy.
The basic procedure consists in generating a scalar function (Lyapunov function) of the energy type for the dynamic system, and examining the relevant time derivative (Lyapunov derivative). A conclusion about stability can thus be drawn without having to use the explicit solution of the nonlinear differential equations.
Here we propose the analysis of a special case: the Lejeune-Dirichlet’s theorem.
This theorem expresses a sufficient condition of stability for special assumptions.
The parameters kinematically independent of the system whose stability is to be defined are noted qi. All connections are assumed to be perfect. All forces, including interforces, other than the connection actions, are derived from a function noted U.
If Lagrange function L0 admits a strict local minimum at qie, the position defined by qie is a stable parametric equilibrium:
[1.74] 
where:
– U: force function of the mechanical actions,
– T: Galilean kinetic energy of the system.
From the preceding theorem, we can say that, in the case of a strict equilibrium, with respect to a Galilean reference system, the equilibrium position is a stable equilibrium position if the force function presents a strict local minimum.
The equilibrium positions are thus defined as follows:
[1.75] 
Stability is ensured if:
[1.76] 
This condition is a sufficient but not necessary condition.
Consider the conventional case of a two-parameter system represented in Figure 1.42.
Figure 1.42. Typical Two-Degree-of-Freedom System
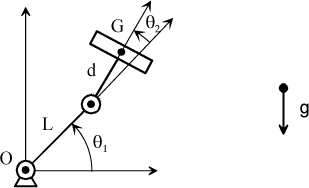
Search for the equilibrium positions and related stability.
To this end, express the potential energy as follows:
[1.77] 
The equilibrium positions are defined by:
[1.78] 
i.e.:
[1.79] 
The following is thus obtained:
[1.80] 
It is thus possible to check that solutions (π/2.0) and (−π/2.0) are equilibrium positions.
The second derivatives can then be defined:
[1.81] 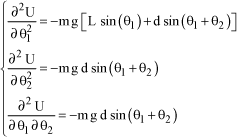
For equilibrium position (π/2.0), the following is obtained:
[1.82] 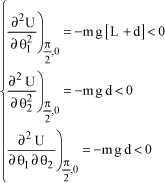
The criterion does not allow to draw a conclusion about stability of this position. For equilibrium position (−π/2.0), the following is obtained:
[1.83] 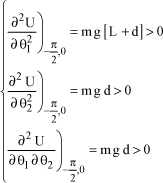
The criterion allows to conclude that this position is stable.
This chapter deals with a mechanical system having a single degree of freedom, noted q(t), which may be either a translational motion or a rotational motion. The principles of mechanics (general theorems or others) can be used to define a linearized equation of motion which usually takes the following form:
[1.84] 
Coefficient a represents the mass or inertia depending on whether the solid is moving by translation or rotation. This magnitude can therefore be considered as being positive. Coefficients b and c may have different origins: action of a spring, gravity, damper, aerodynamic forces, etc.
F(t) represents, when existing, the part of the mechanical actions which is not related to position q(t). For dynamics engineers, it forms the forced excitation.
The direct method to define the stability consists in searching for the solution to differential equation [1.84] without the second member (homogeneous system). The latter has the following general form:
[1.85] 
Since this solution must verify the differential equation without the second member, r must be the solution to the following characteristic equation:
[1.86] 
The type of solution depends on the sign of determinant Δ:
[1.87] 
Consider the case of the positive or zero determinant. This implies:
[1.88] 
It is then possible to show that characteristic equation [1.86] has two solutions defined by:
[1.89] 
Motion q(t) is thus defined by:
[1.90] 
Constants A and B are defined by the initial conditions. It can be observed that the motion is of the exponential type. Stability is ensured whatever the initial conditions if the values of r1 and r2 are negative or zero. As the value of a is always positive, this comes down to:
[1.91] 
We propose to analyze the case of a system where the differential equation is of the following form:
[1.92] 
The stability criterion then gives:
[1.93] 
In this case, it can be seen that value c is negative. Some work talk about “negative stiffness”.
We propose to illustrate the preceding case through the example in Figure 1.43.
Figure 1.43. Inverted Pendulum System

The parameter setting used is as follows:
[1.94] 
We can use the fundamental principle of dynamics to show that the equation of small motions about the equilibrium position θe=0 is written:
[1.95] 
The stability criterion then gives:
[1.96] 
It can thus be observed that, if the action of the spring prevails over the action of gravity, the system is stable, or else it is unstable.
Consider the case of the strictly negative discriminant. This implies:
[1.97] 
In this case, the solutions of characteristic equation [1.86] are:
[1.98] 
In this case, the stability can be defined from the sign of the real part of solutions ri. As the value of a is positive, we deduce the stability criterion:

Some works talk about “negative damping” to define instability in this case.
The typical illustration used in this case is demonstrated with further details in Chapter 5.
It can be shown that the vibratory motion of an airfoil perpendicularly to an airstream causes the incidence between air and airfoil to vary. This variation results in variations of aerodynamic forces proportional to the vibration velocity.
Figure 1.44. Modeling of an Airfoil in an Airstream

It can thus be shown that the equation of motion of the airfoil can be written as follows:
[1.99] 
In this case, the discriminant is calculated as follows:
[1.100] 
The values involved in this type of application imply that this discriminant is negative. Under such conditions, instability may occur from a given speed.
It is necessary not to exceed a wind velocity such that:
[1.101] 
Let the single-degree-of-freedom system whose nonlinear behavior equation, generally resulting from the fundamental principle of dynamics for mechanics problems, be written:
[1.102] 
Among the solutions specific to this equation, we will retain the fixed points x0, or equilibrium positions, which correspond to states not dependent on time. They are obtained by solving:
[1.103] 
From these specific solutions, it is useful to analyze the stability of these equilibrium positions. To this end, we use a state representation by setting:
[1.104] 
Equation [1.102] is thus written in the following form:
[1.105] 
We can illustrate, in very simplistic way, the notions of stability and instability of a fixed point through the phase diagram, representation of x2 versus x1.
A stable fixed point attracts the paths in all directions of space whereas the unstable fixed point repels them in at least one direction.
Figure 1.45. Illustration of Notion of Stability and Instability Through Phase Diagram

The equation can be analyzed through a geometric approach by causing the dynamics to appear in the form of a trajectory in the phase diagram, trajectory which obviously depends on the initial conditions.
The set of possible trajectories is known as phase portrait. An initial condition xi, which defines the initial energy, determines a single trajectory.
In the absence of dissipation, any system, linear or not, has a permanent rating, provided that it is not in equilibrium position. The motion amplitude is a direct function of the energy given to the system.
In the presence of dissipation, in order to obtain self-sustained motions, the energy loss must be compensated for by dissipation through external sources which maintain the considered system out of equilibrium.
Figure 1.46. Illustration of Possible Trajectories in Phase Plane

When the system is moved away from its equilibrium point and when motions, saturating in periodic permanent rating, start developing, we talk about limit cycle in the phase space.
For a stable conservative system, the motion amplitude is a function of the energy contained in the initial conditions. This is not the case of the limit cycles.
Let us consiter again the case of flutter, the equation of which [1.99] can be written as follows:
[1.106] 
where:

The sign of cequ then defines the stability. From the formalism proposed, the following is obtained:
[1.107] 
It can be observed that there is a fixed point:
[1.108] 
The system resolution can be used to establish the trajectory in the phase diagram, Figure 1.47.
Figure 1.47. Trajectory in Phase Diagram for a Pendulum Damped Around the Stable Equilibrium Position

The preceding stability criteria have been determined in the case of systems of differential equations with constant coefficients. This is not always the case. We may be brought to study the stability of linear systems whose equations have nonconstant coefficients of the following type:
[1.109] 
In a number of cases, we can use the Mathieu’s equation which is of the following form:
[1.110] 
This type of equation requires special solutions, the stability of which can be studied as a function of pair β and γ.
Figure 1.48. Stability Area of Mathieu’s Equations

Among the mechanical problems usually encountered, the Mathieu’s equation is often met in the following form:
[1.111] 
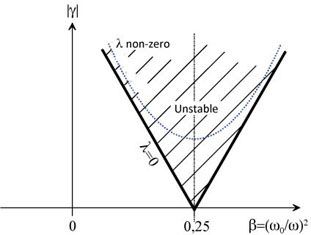
Let us consider the case where damping is nil, λ=0. For this type of equation, we seek to define sability as a function of parameters ω, ω0 and ε:
[1.112] 
By transformation, we can set the equation in the form of a state system:
[1.113] 
where:
[1.114] 
Function a(t) is a periodic function. This equation can be solved piece by piece, by approximating matrix A such that:
[1.115] 
where:
[1.116] 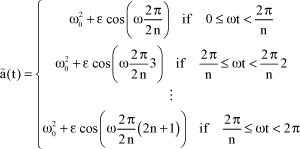
The approximation made can be represented by the graph in Figure 1.49.
Figure 1.49. Piecewise Approximation of a Function
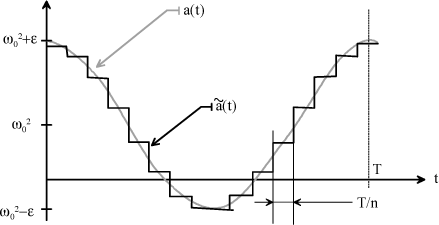
In the case where there is no damping (λ=0) and ε<<1, the stability criterion is reduced to:
[1.117] 
Criterion which is reduced to:
[1.118] 
Figure 1.50. Stability Area of Mathieu’s Parametric Equation

In the more general case, with non-zero damping and any ε, the stability area can be defined graphically by Figure 1.51.
Figure 1.51. Stability and Instability Area in Mathieu’s Equation
The notion of parametric stability can be illustrated by the study of the lag motion of a blade with a nonlinear stiffness. In this system, let us consider a linear stiffness k(t), varying with time.
Figure 1.52. Typical Helicopter Blade and Nonlinear Lag Adapter

Stiffness k(t) is assumed to be expressed by:

The equation of motion of the blade at δ(t), while neglecting structure damping, is:
[1.119] 
where:
– I: blade lagging inertia,
– ms: blade static moment,
– e: eccentricity,
– Ω: rotor rotational speed.
We obtain a differential equation of the Mathieu type.
The preceding equation can be written in the following form:
[1.120] 
where:
[1.121] 
In the case studied, ε is a positive magnitude.
When placing in the situation where (ω/ω0)=1, the system is always unstable whatever the value of ε. For a positive ε, the value of ω must differ from ω0, as shown in Figure 1.53.
Figure 1.53. Stability Area of Mathieu’s Parametric Equation

Let us now study the case where ω = 0.25 ω0. In this condition n = 1, the system is unstable. This instability can be explained as follows: according to this relation, when n = 1, the frequency of the disturbances applied to the system is twice the system eigenfrequency.
Integer n can thus be characterized as being the order of parametric resonance of the system. Thus, when n = 1, we have a first-order parametric resonance system.
In the case of an active control system with cyclic stiffness variation, it is necessary to study the effect on stability as shown in the preceding example.
When a structure is unstable, it is necessary, in most cases, to find a means to make it stable. To this end, we can either modify the system structurally or control stability through an external actuator.
The first way of solution concerns the passive methods. The latter consist, depending on the system, in modifying the stiffness, damping or mass distribution.
Thus, very intuitively, the engineers of the airplane of Lindbergh, The Spirit of Saint Louis, saw, as from the first tests, the necessity of rigidifying the wings so as to avoid flutter (floating-type instabilities), and thus lead to the success we know.
The second way of solutions concerns the active methods. The latter consist, from sensors and actuators, in controlling the structure so as to make the system stable. This will be the case, for example, of a torsional system where the behavior can be made stable by a feedback system; through the measurement of the torque transmitted by a shaft, the quantity of fuel injected into the engine can be modified.
It is not sufficient for a system to be stable, it must be sufficiently stable. It is essential to define criteria in order to judge the margins as regards instability.
The principle is to determine a control such that the system poles of the transfer function of the closed-loop system are suitably located in the complex plane and meet specifications, among other things, of stability.
As the poles of the transfer function are the eigenvalues of the state matrix, the purpose is therefore to achieve a servomechanism which suitably modifies the system state matrix.
The eigenvalues must have strictly negative real parts for the stability to be ensured.
The study of robustness of a corrector is generally made in the frequency domain where the gain and phase margins or else the modulus and delay margins are defined. Robustness is then a quantitative notion which defines the distance to instability [DUT 97].
A system is particularly all the more stable that its locus of open-loop transfer passes far from the critical point. To quantify this aspect, we define the following stability margins: gain margin and phase margin.
The stability margins can be defined in either the Nyquist plane, or the Black plane or the Bode diagrams. In practice, the Black plane and Bode diagrams are more used as there is direct access to the modulus and phase of a system experimentally.
Here we propose to understand what makes a system unstable in order to introduce the notion of phase margin and gain margin.
Figure 1.54. Modeling of a Servomechanism Causing Self-Sustained Oscillations

Let us imagine an input r(t) corresponding to one half-period of a sinusoid such that:
[1.122] 
where:

Figure 1.55. Time Representation of Command r(t)

Within the scope of the servomechanism proposed in Figure 1.54, signal r(t) will undergo a 180° delay. Output signal b(t) will therefore be the same as input signal r(t) but offset to the right by one half-period.
Hence:
[1.123] 
when:
[1.124] 
The time change of all variables will have the form represented in Figure 1.56.
Firstly, initial signal r(t) is offset by T/2, in other words, undergoes a 180° phase shift, to give b(t).
Then, signal b(t) returns to the subtractor through the unitary feedback loop. In passing, its sign changes. We therefore have:
[1.125] 
when:
[1.126] 
Figure 1.56. Time Change of All Variables in the Case of Self-Sustained Oscillations

The system produces self-sustained oscillations; two conditions are necessary for this purpose:
– the system must not change the initial amplitude, in other words, the gain must be zero:
[1.127] 
– the offset must be equal to one half-period, i.e., to a 180° phase shift:
[1.128] 
Let us examine what happens when the gain is not zero by taking two cases.
CASE 1.– M(ω)=0.5
Figure 1.57. Time Change of All Variables in the Case of Signal Attenuation
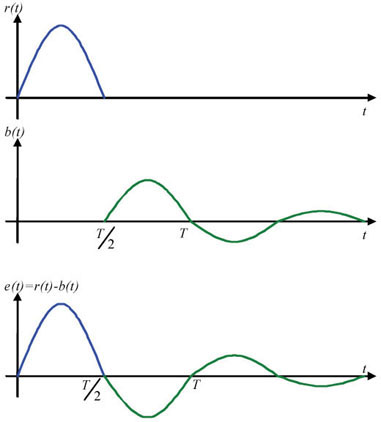
Firstly, initial signal r(t) undergoes a phase shift of T/2, and has its amplitude reduced by half.
Then, signal b(t) returns to the subtractor through the unitary feedback loop. In passing, its sign changes and it is again in phase, except that its amplitude is no longer the same. The signal will therefore be reduced again, and so on, until reaching zero.
CASE 2.– M(ω)=2.0
Figure 1.58. Time Change of All Variables in the Case of Signal Divergence

Firstly, initial signal r(t) undergoes a phase shift of T/2, and has its amplitude doubled.
Then, signal b(t) returns to the subtractor through the unitary feedback loop. In passing, its sign changes and it is again in phase, except that its amplitude has doubled. The signal will therefore be doubled again, and so on, until the system no longer resists. The output has diverged.
Intuitively, we can show that, if M(ω)<1, the system is stable and the equilibrium position is regained, and if M(ω)>1, the system is unstable, the signal diverges.
From these few examples, we can realize that the 180° phase shift is critical. In practice, the notion of gain margin and phase margin is used to move as far as possible from this domain.
The phase and gain margins at the Nyquist locus are defined as follows:
– phase margin mϕ is the difference between the phase of the point of the OLTF of modulus 1 (draw a circle of origin O and radius 1, all points of this circle have a modulus equal to 1) and the phase of the −180° critical point;
– the inverse of gain margin mg is measured along the real axis, between the imaginary axis and the point of intersection of the OLTF with the real axis (the phase is equal to −180° at this point). Just convert this difference to dB to obtain the gain margin.
Figure 1.59. Phase and Gain Margins on Nyquist Diagram

System stability is more certain when this curve fully remains within the radius 1 circle. But having an integrator in the loop is sufficient for the locus to go out of the circle when the frequency tends to 0. However, it is sometimes necessary to have an integrator in the control loop in order to have an input equal to the output.
The Bode representation of an open-loop transfer function comprises two curves as a function of frequency ω: the first one represents its modulus expressed in dB, and the second one its phase.
Here is again the notion of phase margin mϕ, that is the safety margin prior to reaching 180° once the zero gain is reached, and the notion of gain margin mg which will give the safety margin prior to reaching 0 dB for a phase shift of 180°.
Figure 1.60. Phase and Gain Margins on Bode Diagram

As previously said in the introduction, on some systems, it is necessary to ensure stability through an active method. For this purpose, a controller is used, with which other roles can be associated, such as to guarantee the static and dynamic accuracy, to get desired response times; criteria which are applicable only when the system is stable.
Figure 1.61. Modeling of a Feedback System

The closed-loop control principle is illustrated in Figure 1.61 which defines the feedback control structure. Term “closed-loop system” is then used by opposition to open-loop systems. A closed-loop system checks that the system response corresponds to the reference input whereas an open-loop system controls without checking the effect of its action. The closed-loop control systems are thus preferable when non-modelizable disturbances and/or unpredictable parameter variations are present, which is the case of most of the cases developed in the next chapters.
The inverted pendulum system, highly used as an educational tool and very widely used to test the system control algorithms, is an example which illustrates feedback stabilization. The acrobat uses vision as a means to measure the pendulum position, and the motion of his body as an actuator. This system is similar to the system of inverted pendulum positioned on a trolley.
Figure 1.62. Illustration of Inverted Pendulum
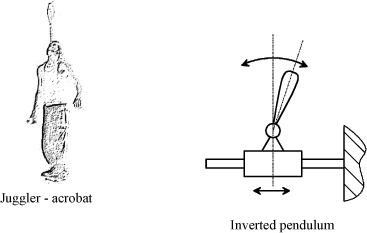
This type of application allows for the implementation of several strategies to make the system stable. Several criteria condition the success of a strategy: has the system a behavior which can be linearized, have we enough information on the structure motion, what is the type and quality of the information measured?
The following can thus be mentioned: robust methods, fuzzy logic methods, as well as neural network system methods.
The robust methods, through state feedback or transfer function, of the PID type or others, are used to reinject a disturbance with contrary effects through the measurement of one or more magnitudes of the system. Generally, the principle consists in amplifying, deriving or integrating the measured value.
Fuzzy logic is very close to the “everyday” human thought process. It assesses the input variables (fuzzification) as well as the output variables, and prescribes a set of rules intended to determine the outputs versus the inputs (defuzzification). Fuzzy logic proves to be effective for the complex systems in which modeling is difficult, even impossible, for the systems having many continuous or discontinuous inputs/outputs and nonlinear responses, or when human observation has created inputs or rules for the system control.
Figure 1.63. Fuzzy Logic Control
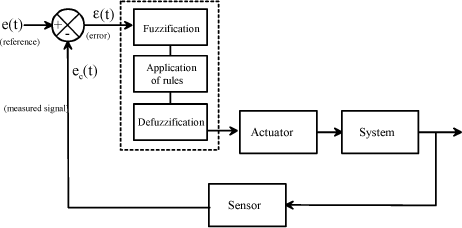
We will only develop robust control techniques to provide the desired performance. Robustness is a qualitative aspect. It characterizes the capability of a servomechanism to maintain its performance despite the changes in the operating conditions.
Numerical controllers have a number of advantages but are not very robust when considering the truncation errors which accumulate and may be amplified.
Series correction is the most commonly used. It acts on both stability and accuracy, in fixed setpoint control as well as follow-up control. Parallel correction does not allow for the introduction of an integration. It mainly acts on stability.
It is also used to linearize the parallel element. The anticipating or predictive correction, whose compensators are not easily achieved, does not act on stability but compensates for the error due to the reference magnitude or that due to a disturbing magnitude.
In the complex cases where several disturbances occur, including some which cannot be measured, the implementation of compensators is tedious and imperfect.
In the following example, a transfer function corrector Hc is series-connected to the system defined by Hs.
Figure 1.64. Series-Connected Corrector

Figure 1.65 below shows an element Hc of the corrector which is parallel-connected.
Figure 1.65. Parallel-Connected Corrector
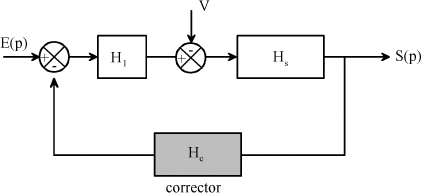
The purpose of this part is to give the basic elements of robust correctors. The schematization used is given in Figure 1.66.
Figure 1.66. Schematization of Unitary Feedback Servomechanism

The proportional action represents the minimum action essential to a correction. It corresponds to a constant gain introduced in the action system of the closed-loop system. In this case, the function of the corrector is to set up the following law:
[1.129] 
The transfer function of the proportional P corrector is given by:
[1.130] 
If gain kp is less than 1, attenuation increases stability by lowering the gain curve but to the detriment of accuracy. If gain kp is greater than 1, the accuracy is increased to the detriment of stability (reduction of gain margin and phase margin). An excessively high gain may lead to instability.
The main effect of the P corrector on the closed-loop system consists in:
– ensuring a given permanent rating error;
–imposing a given response time.
The following example, simplified, illustrates the principle of proportional P control by using the mechanical energy, based on the principle of the Watt’s governor; system specially used to control turbomachines, Figure 1.67.
Figure 1.67. Location of a Corrector in a Turbine Control System

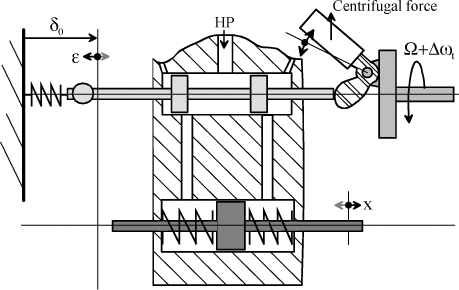
Figure 1.68. Governing With Flyweight System – Schematic

Under the action of the centrifugal effects and calibration spring, the flyweight system finds an equilibrium position function of the speed, Figure 1.68:
[1.131] 
The lever arm system enables proportional amplification of the displacement to be obtained:
[1.132] 
It can thus be shown that a small speed variation causes a small displacement of the extension rod according to a proportional law. This rod controls the quantity of fuel injected into the turbine combustion chamber:
[1.133] 
The following example illustrates the principle of P control by using the electrical energy.
Figure 1.69. Proportional Corrector Setting-up – Electrical Energy

Using the nodal laws and mesh laws, the following can be established:
[1.134] 
Thus, the transfer function of this corrector can be defined as follows:
[1.135] 
Figure 1.70. Transfer Function of an Integrator I Corrector

a) Pure Integrator Corrector (I)
The function of a pure integrator is to establish the following input/output law:
[1.136] 
Thus, the transfer function of an integrator is generally written as follows:
[1.137] 
This transfer function can be analyzed through the Bode diagram (Figure 1.70).
Let us take again the case of a turbomachine control system associated with another type of control.
Figure 1.71. Integration-Type Control – Mechanical System – Schematic
The piston system, by neglecting its inertia and frictions, has a behavior equation which can be expressed by:
[1.138] 
The value of Ti depends on the fluid pressure, restriction, spring and piston surface area.
The transfer function of this corrector can be defined as follows:
[1.139] 
The following example illustrates the principle of integral I control by using the electrical energy.
Figure 1.72. Proportional Corrector Setting-up – Electrical Energy

Using the nodal laws and mesh laws, the following can be established:
[1.140] 
Thus, the transfer function of this corrector can be defined as follows:
[1.141] 
b) Proportional-Integrator Corrector (PI)
The integrator corrector is generally associated with a proportional corrector:
[1.142] 
The transfer function of this type of corrector is thus:
[1.143] 
Figure 1.73. Transfer Function of a Proportional-Integrator PI Corrector

It is thus possible to cumulate both effects, integrator and proportional, on the control system of a turbomachine.
The behavior law related to the rod is obtained using the properties of the triangle, by:
[1.144] 
Figure 1.74. PI-Type Control – Mechanical System – Schematic
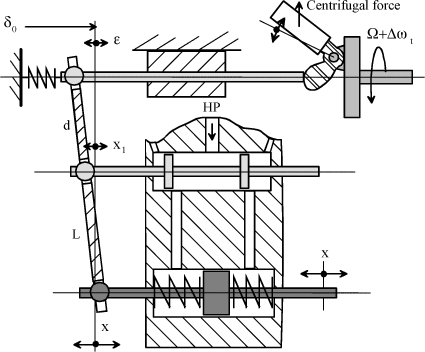
The relation related to the slide valve system, is given by:
[1.145] 
By removing slide valve motion x1, the following is thus obtained:
[1.146] 
where:
[1.147] 
Thus, the transfer function of this corrector can be defined as follows:
[1.148] 
The following example illustrates the principle of PI control by using the electrical energy.
Figure 1.75. Proportional Corrector Setting-up – Electrical Energy

The transfer function of this corrector can be defined as follows:
[1.149] 
a) Pure Differentiator Corrector (D)
The control law has the following form:
[1.150] 
This type of corrector is purely theoretical, a physical system cannot have a numerator of a degree greater than the degree in the denominator. The theoretical transfer function would be:
[1.151] 
Figure 1.76. Transfer Function of a Differentiator D Corrector

b) Proportional-Differentiator Corrector (PD)
The derivation function is associated with a proportionality function. The control law is given by:
[1.152] 
The transfer function of this PD corrector is:
[1.153] 
The PD corrector causes a gain and phase increase toward the high frequencies.
Figure 1.77. Transfer Function of a Proportional-Differentiator PD Corrector
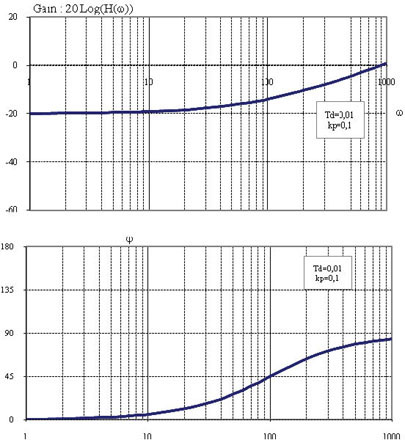
The following example illustrates the principle of PD control by using the electrical energy.
Figure 1.78. Proportional Corrector Setting-up – Electrical Energy
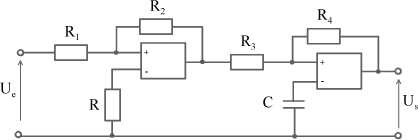
The transfer function of this corrector can be defined as follows:
[1.154] 
c) Phase-Advance Corrector
The proportional-derivative corrector (PD) cannot be physically achieved. It is replaced with a phase-advance corrector which has an identical effect within a wide frequency band. The transfer function of the phase-advance corrector has the following form:
[1.155] 
The interest of this corrector is that it does not too much modify the behavior at low and high frequencies while adding a positive phase around a critical operating point.
This type of corrector produces a maximum phase ϕa at frequency ωm, which are expressed by:
[1.156] 
Or else:
[1.157] 
These relations are very useful for the phase-advance controller design which is often related to the phase and gain margin specifications.
Figure 1.79. Transfer Function of a Phase-Advance Corrector
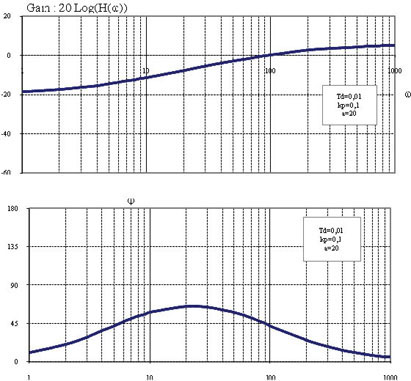
The interest of the PID corrector is to combine the effects of the PD and PI correctors. The control law has the following form:
[1.158] 
The transfer function of this type of corrector can be written as follows:
[1.159] 
For a satisfactory setting of Ti and Td, the increase of the static accuracy due to the integration of PI can be observed. The PD effect improves dynamic accuracy and stability. Adjustment of a PID is usually complex, practical adjustment methods give good results.
Figure 1.80. PID-Type Corrector

Adjustment of the correctors is not limited to system stabilization. The quality of a system can be assessed through its performance: accuracy, exceedance, rapidity, etc. The latter can be assessed by studying the response to an echelon excitation.
Figure 1.81. System Performance Data on an Echelon Excitation
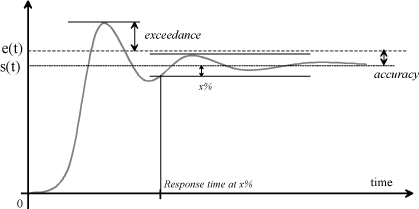
The accuracy measures the difference, under steady-state conditions, between setpoint e(t) and output s(t). The smaller the difference ε, the more accurate the system.
Exceedance: the exceedance measures the difference between the highest output value and the setpoint. If the exceedance is too great, problems of resistance may occur.
Response time or rapidity: rapidity can consider two times, the response time which usually measures the time for the system to reach 95% of its value under steady-state conditions. Another time which can be considered is the rise time which corresponds to the time for the system to reach the setpoint for the first time.
Effect of phase on rapidity: the phase shift, for a sine-wave signal, is the shift between the input signal and the output signal. In other words, it notes the delay of the output with respect to the input. The smaller this phase shift, the more rapid the system reaction. Hence the interest of some correctors which add phase (PD). These correctors derive the input signal so as to transmit a very high signal to the system.
As a matter of fact, the derivation of an echelon is a frequency rapidly sensed by the system.
Similarly, the higher the phase when the gain is zero, the greater the chances of obtaining oscillations. Merely take a second-order system and observe that, when damping decreases, the phase shift significantly increases after the resonance peak, and there are oscillations. These oscillations are explained by the fact that the system is not very rapid and has some inertia.
But if damping is excessively increased, some rapidity is lost.
Accuracy is a characteristic sought for the system. The interest of setting the system in closed-loop configuration is to attempt to fight against any causes of alteration of the accuracy through the measurement of the difference. In order to analyze the accuracy, it is necessary to represent the system by a diagram with equivalent unitary feedback, the input and output are of the same type, Figure 1.82.
Figure 1.82. Diagram With Equivalent Unitary Feedback

The transfer function is noted H(p) such that:
[1.160] 
where n  α+m.
α+m.
The position error, or static error, is computed from the Laplace transform final value theorem:
[1.161] 
The static error therefore depends on the type of input (step, ramp, parabolic, etc.) and the class of the transfer function (value α), Table 1.2. The system static gain is noted e0:
[1.162] 
Table 1.2. System Accuracy Versus System Class and Input Type

REMARK.– If these errors have no finite values (±∞), this means that the output diverges and the system is unstable.
Figure 1.83. Static and Tracking Errors

The response time corresponds to the time to reach, subsequent to a sudden variation of the setpoint (step), the setpoint to within x% and no longer leave it. Generally, the response time is defined at 5%.
Let us take the example of a second-order system, the transfer function of which is:
[1.163] 
The closed-loop transfer function is given by:
[1.164] 
where:
[1.165] 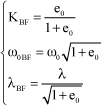
It can be observed that the closed-loop system is also a second-order system. Damping ratio λBF has a value lower than that of damping ratio λ.
If damping λ is greater than 70.7%, closed-loop setting can improve the response time.
In order to evaluate the response time at x%, it is necessary to assess, from the transfer function, the time response to an echelon excitation when λBF<1:
[1.166] 

Thus, the response time at 2% is about:
[1.167] 
Exceedance only concerns systems of at least the second order. The latter can be defined by the time to reach its first maximum. For the example of the second order proposed, and by derivation of time function [1.166], the following can be shown:
[1.168] 
The value reached is thus:
[1.169] 
It has been observed that a second-order closed-loop system gives another second-order system [GRO 01].
Moreover:
– if gain e0 increases, KBF tends to 1, hence toward good accuracy, but then λBF decreases, and the system is significantly less damped;
– if looking at the frequency responses of the closed-loop transfer function (CLTF), it can be observed that the cutoff frequency increases, the phase margin decreases: damping reduction is found again.
Figure 1.84. Frequency Responses of Second-Order Closed-Loop System
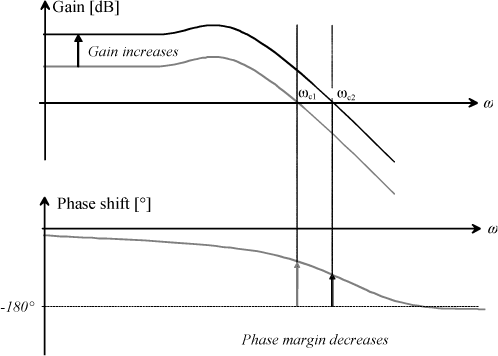
To conclude, the stability margin and exceedance limitation, in closed loop configuration, are improved by a decrease of the open-loop static gain, whereas rapidity and accuracy are altered.
Conversely, an increase of the open-loop static gain improves rapidity and accuracy in closed-loop configuration, but makes the system less stable and increases exceedance.
The reader can make again the connection between all configurations on the transfer function as a function of damping, Figure 1.85.
Figure 1.85. Bode Diagram as a Function of Damping
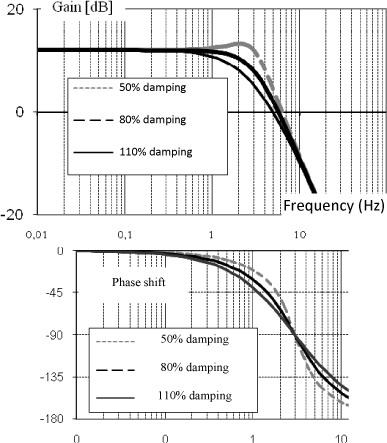
Figure 1.86. Response to a Step as a Function of Damping
