Chapter 3. Finding or Building a Dataset
Many introductory exercises on machine learning or artificial intelligence (AI) provide datasets for use, as is done in this book. When faced with your own implementation, this will likely not be the case. Sourcing and transforming input data that can be modeled to solve a specific problem is a challenge in and of itself.
A common colloquialism in data science is GIGO, which stands for “garbage in, garbage out,” which refers to the fact that a model can be only as good as the data on which it was trained. This chapter covers available options for sourcing premade datasets or designing and building your own.
Be aware that every step in this process is highly subjective to your individual data and solution requirements, so it’s a little high-level in places. Many practices in data-wrangling are honed only with experience.
Planning and Identifying Data to Target
Some refer to the dataset planning phase as a design process, and this is no exaggeration. One of the easiest mistakes to make in the machine-learning process is not selecting the appropriate input data for the job—not necessarily data of poor quality or provenance, but even data that does not sufficiently correlate with the outcome the model is looking to predict.
Not all machine-learning problems are solved outside of the technical aspects. Although it might seem intuitive that to predict the weather will require records of historical temperature, humidity, and outlook data at least, other problems might not be so simple.
What if instead a model were needed to predict human behavior? In a local university’s AI fundamentals class one of the first problems posed is a discussion on how to design a model that would predict a child prankster’s likelihood of acting up on any certain day at school. A purely theoretical exercise, the same ideas usually come up each semester. Along with recording whether they offended on a certain day, we should also record the day of the week, what they had for breakfast, whether they slept enough, whether they were grounded, what the weather was like, whether their best friend was at school that day, and the list goes on.
But where does the list of factors that might affect the moods or movements of a sentient being end? It doesn’t, really.
You could easily be sucked down a rabbit hole of trying to model the Butterfly Effect. So, although the data-preparation process leading up to model training can be generalized to something like this:
get data → clean data → transform data → train
The lack of a perfect solution necessitates a more flexible process. Something more like this:
investigate available data sources → get data → explore data → clean data → explore data → transform data → explore data → train
In this process, at any point of exploration it is possible to decide to return to the beginning.
It is very common for real-world projects to reach the stage of exploring transformed data multiple times before finally going ahead—using the knowledge gained to try a different approach to transformation or realize some different variable should have been included in the data in each iteration.
There are no clear methods to prescribe here, just a recommendation to generously employ whatever brainstorming techniques you have available to you. However, there are some common mistakes that you need to avoid when it comes to the overall logic applied to the data and problem at hand:
-
Negation as failure
-
Closed-world assumptions
Let’s examine each.
Negation as Failure
This term is used to describe the problems that can arise with defaulting to negative where positive cannot be proven.
For example, the logical difference between using an if/else (defining some catch condition for the positive case, else default to negative) compared to an if/else if (defining two catch cases, else default to no action) might seem minor. But the issues caused if the problem this logic is modeling were not so clearly defined can be extensive. For example:
ifinput=="Y"{("Answer was yes.")}else{("Answer was no.")}
Although this might be safe if input only had two buttons, such code would register any input as a no. This means y would be a no, as would yes, or any other character or symbol, likely even just a line break. The answer it is looking for is either Y or N, but the context it exists in is not so neatly partitioned.
Closed-World Assumptions
This term describes inaccurate assumptions that the information possessed about a thing encapsulates or is indicative of the whole. For example, a list that is treated as exhaustive when not in the real world:
letyesResponses=["Y","y","yes","Yes"]letnoResponses=["N","n","no","No"]ifyesResponses.contains(input){("Answer was yes.")}elseifnoResponses.contains(input){("Answer was no.")}else{("Answer was not yes or no.")}
A better approach? Probably. A perfect one? Not by a long shot. An ideal system would be one that could replicate what the human mind goes through when hearing a verbal yes/no response: was the noise within some given threshold of familiarity to any term that individual has heard used for either yes or no before? If yes, assume that’s what they meant or that it is unfamiliar slang. Else, clarify because it’s almost certain that they meant one of them in response to a yes/no question, right? Easy. For a human, anyway.
Aside from simple logic errors, errors in reasoning can vary broadly. Most solutions boil down to ensuring that the design and input of a system is as accurate and complete a representation of the phenomena you are trying to model or predict as possible. No easy task, but a worthy one.
Remember, aside from image-based data (photographs, spectrograms, video frames, etc.), the vast majority of datasets you would construct or use are going to be—or need to be transformed into—tables of values. Think to yourself: if all previous observations in your problem space had to fit into a single table, what would be the column headings and types?
Finding a Dataset
It’s good to have some idea of how and where to look for a dataset with which to get started. Both of these are very subjective in the broad field of AI and the vast range of problems it can be applied to, but some general truths and recommendations exist.
Where to Look
For the common problems, there are a bunch of places where you can start your search:
Google Dataset Search is to datasets what Google Scholar is to research papers. Or what Google Search is to, well, everything, everywhere. It’s a great first stop to get a feel for what is out there on a particular topic. Google also curates a general public data repository of its own, called Google Public Data, as does Amazon with its AWS Data Registry.
Kaggle.com is an online community dedicated to data science. It has a large repository of community- and organization-contributed datasets on a huge range of topics to use for whatever you like. This site is also a great resource for learning the minutiae of data analysis by participating in competitions or discussions.
Research organizations will often release scientific data for public use. This is particularly useful if you require sensitive human data that you can be confident has been appropriately anonymized. In Australia we have bodies like the Australian Bureau of Statistics, Commonwealth Scientific and Industrial Research Organisation (CSIRO), and even an online portal for all OF our government data called data.gov.au.
Elsewhere in the world, notable bodies include NASA, NOAA NIST, the CDC, WHO, UNICEF, CERN, the Max Planck Institute, CNR, the EPA, and many more. So much great science to go around!
Similarly, many countries have a central government data repository such as data.gov (USA), open.canada.ca, data.govt.nz, data.europa.eu, and data.gov.uk, just to name a few.
Some companies with a nonscientific purpose even release data repositories if they reach a size at which they are able or required to conduct research in-house. Some great examples of this are the World Bank and the International Monetary Fund (IMF), which have grown to become primary sources of open financial and populace data.
Sourcing data from a reputable organization—where permitted—is a great way to ensure quality in both accuracy and coverage as well as value types and formats that are appropriate for use.
Journalism sites such as FiveThirtyEight and BuzzFeed make available the data gained from public surveys or that was collected for key articles, representing everything from important social and political data that might concern public well-being—online censorship, government surveillance, firearms, health care, and more—to things like sports scores or opinion polls.
Reddit’s /r/datasets (yes, really) is a great place to look if you’ve got something in mind but need human help to find it; you can either browse what interesting things people have posted or ask for assistance on a particular problem. There’s even great meta-information like the time someone posted an exhaustive list of every open data portal ever. While you’re there, /r/MachineLearning is also good.
Tip
Random enthusiasts can sometimes also really come through for you, too. A personal favorite website of the authors’ is Jonathan’s Space Home Page, wherein an astrophysicist from the Harvard-Smithsonian Center for Astrophysics maintains extensive lists of everything launched into space. Just as a side project. It’s amazing.
Another great source of slightly unusual data is the Online Encyclopedia of Integer Sequences (OEIS) which is a giant collection of various number sequences and additional information about them such as plots, or the formulae used to generate the sequences. So if you were ever curious about the Catalan numbers or want to know about the Busy Beaver Problem, OEIS has you sorted.
There are also countless websites dedicated to being a central registry of datasets in areas such as open government, academic data used in key research publications, and all sorts of other things.
This has probably illustrated the point by now: data is everywhere. We generate more every moment and a not insignificant number of people and organizations have dedicated themselves to making that useful for all of us. Personal tastes in data sources are established only with time and experience, so explore and experiment widely.
What to Look Out for
Have a clear plan of what you are looking for to model the problem you are solving before you begin your search. In potential data to include, consider the following:
-
The values and types of values present in the data.
-
The person or organization that collected the data.
-
The methods used (if known) to collect the data.
-
The time frame during which the data was collected.
-
Whether the set alone is sufficient for your problem. If not, how easily could other sources be incorporated?
Preprepared datasets will often need some modification to be appropriate for other uses. In this way, even if it could be assumed that the data is already clean (which should be verified just in case), some data transformation might still need to occur. To ensure quality output, you should observe the usual data preparation steps from this point.
Remember, it might come to a point at which some additional or differently formatted information is required to yield the desired outcome. A prebuilt dataset is a nice starting point, but it should never be exempt from scrutiny: an unsuitable dataset should be modified or replaced even if that will involve significant work in the short term.
Building a Dataset
To make a dataset from scratch, you must obtain raw data from somewhere. These efforts generally fall into three main camps: recording data, collating data, or scraping data.
Data Recording
Data recording is first-class data collection: you are doing the observation of some phenomena and attributes yourself and recording unique data that is all your own. This could be done with physical devices such as sensors or cameras, or with digital observation such as web trackers or crawlers.
You might collect data about actions or environmental conditions occurring in a specific place, record images of different objects you want to recognize, or chronicle the traffic of a web service to predict user behaviors.
You can use these methods to create highly targeted datasets on topics that might not have been observed previously, but this is the most time-consuming path to take. The quality of the data collected is also up to the quality of the devices or methods used to collect it, so some expertise is recommended.
Data Collation
Data collation is the practice of combining multiple sources of information to create new data to analyze. This could be built with methods like extracting figures from reports, merging data from different online sources, or querying APIs. It’s taking data that exists in many places and bringing it together in a useful fashion.
Collating data can be almost as time consuming as recording or generating your own in some cases, but it is more likely to enable creation of sets of data about phenomena that occur in difficult-to-reach places such as overseas or within private organizations. A company that does not share its initial dataset for a problem might publish multiple papers with all the figures in them. Or, a site that does not allow you to download a record of every user that has done Y might allow countless queries for has user X done Y?
The quality of data collated is also only as high as the level of attentiveness taken in combining sources. Traps such as incorporating sources that use different measurement units or simple transcription errors can compromise the entire venture.
Data Scraping
Data scraping is a method of collecting a large amount of information that exists but might not be being observed in a way that it is generating structured data suitable for use. This is the primary way social media analysis used to be done (particularly by third parties), but many platforms have cracked down on people’s ability to scrape data or use data that was scraped from their services.
Scraping is performed with software that loads, observes, and downloads enormous amounts of content—often indiscriminately—from the web target, which then can be adapted for use. You really have to know what you are looking for.
Preparing a Dataset
Raw data is almost never useful on its own. For it to be practically useful, you need to prepare it.
Getting to Know a Dataset
As discussed previously, a key and repeated phase of data preparation is data exploration. A set of data too large to have each value manually read, checked, and edited by a human still needs verification of its quality and suitability before entrusting it to make a model worth the time and computation required.
Methods as simple as dumping a sample of a large dataset into a spreadsheet program and just having a look at what kinds or ranges of values occur in each column can identify errors such as irresponsible default values (say, using zero instead of NULL where no measurement was available) or impossible ranges or incompatible merges (data seemingly grouped from multiple sources for which different units were used in each; e.g., Fahrenheit versus Celsius).
Data analysis tools are available in abundance. Where a dataset is too large to be opened in a spreadsheet program, scripts in Python or applications like RStudio have powerful functionalities capable of visualizing, summarizing, or reporting on data. Using whatever you are comfortable with, aim to at least identify the format and general distributions of values for different attributes.
Image datasets are not so easily observable, but definitely worth the time to at least scroll through them to have a look at the general quality of imagery and what kinds of cropping methods have been used. Tools like Turi Create’s visualizations features, which we discussed in “Understanding the pieces of Turi Create”, are incredibly useful for getting to know your data. Figure 3-1 shows an example.
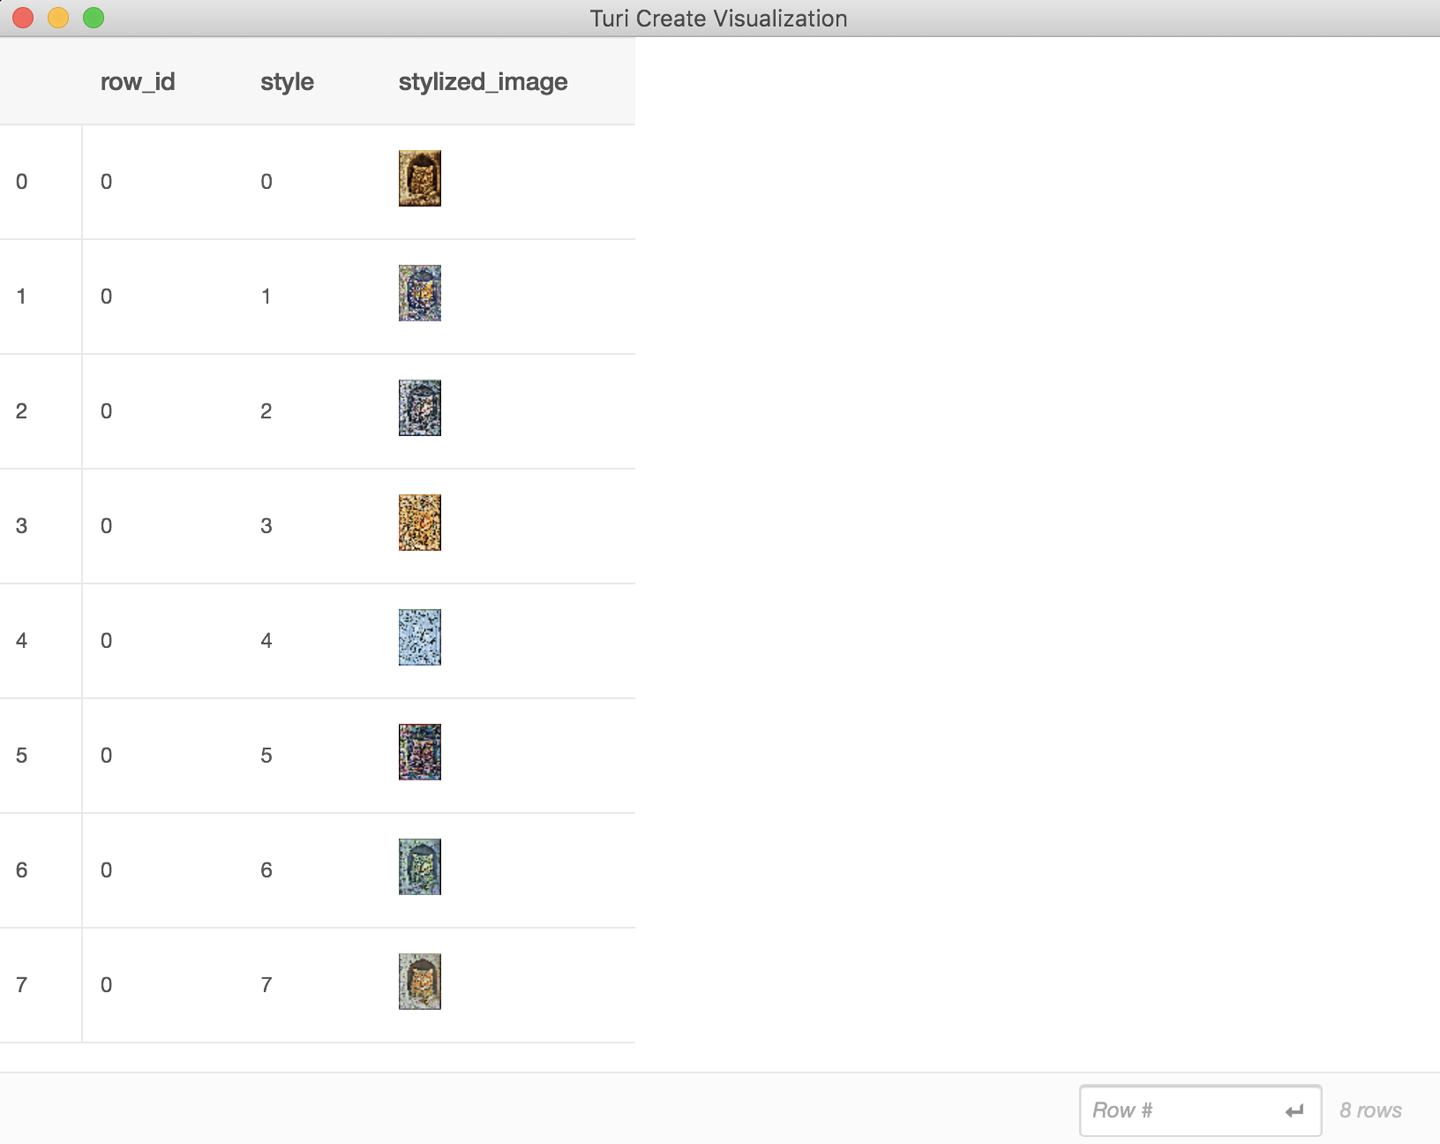
Figure 3-1. Getting to know your data with Turi Create
Cleaning a Dataset
In getting to know a dataset, it’s likely that you will come across something about it that is not right. Recording is an imperfect craft and, like anything humans do, can yield errors. Errors to look for will fall into a few categories:
-
Uniform-value error
-
Single-value error
-
Missing values
Uniform-value error covers circumstances that would cause an entire column or set of values to be inaccurate, such as when an instrument was used to record something that was miscalibrated by a uniform amount, temperature measured from beside something that generates additional heat, weighing using scales that were not zeroed ahead of time, and so on. This also includes when data from various sources was improperly merged without transformation: a simple zip of one set of data from the United States and one from the United Kingdom and now the system thinks it’s totally reasonable to be 100 degrees Celsius.
Single-value error is another term used to describe outliers or inconsistent miscalibration that cause inaccurate or totally illogical values in only a small number of cases. Occurrences such as a sensor that overloaded one day, producing a value 1,000% higher than theoretically possible should be reasonably evident.
Missing values can occur when there were issues in the method used to record data or the dataset had been through some malformed transformation at some point in its lifetime. These might be simply a nil or NULL value, or something less helpful such as the string "NONE" or a default value such as zero. It could even just be nonsense characters. We’ve seen everything.
Uniform error can usually be remedied by scaling or converting the entire set of values by the uniform error value—if it can be discerned. Single-value errors and missing values require that you either guess the value that needs to be replaced using some viable method, or remove the row/observation entirely to prevent the error.
You can guess the value by getting the mean of all other values in that column, using the value in that column for the observation nearest to that with the missing value, or some application-specific method that uses knowledge of other attributes.
Transforming a Dataset
There are two main reasons to transform data before use: to meet format requirements of the algorithm(s) to be used, and to improve or extend the current data with new inferred attributes. For both of these purposes, there are three transformations that are commonly applied to data:
- Normalization
-
A method applied to numerical data to bind the upper and lower bounds to a scale that will make them easier to work with.
An example of this is when observations with numerical data need to be compared with some measure of dissimilarity. If you were trying to assess the health of, say, different fish based on their length, weight, age, and number of missing eyes, presumably anyone would agree that comparing two fish by different metrics (i.e., one eye versus by one year of age or one centimeter in length) would give different results than comparing them by the same metric.
Normalizing positive-only values is simple:
funcnormalise(_value:Double,upperBound:Double)->Double{return(value/upperBound)*1.0}length=normalise(length,upperBound:maxLength)weight=normalise(weight,upperBound:maxWeight)age=normalise(age,upperBound:theoreticalAgeLimit)eyesDifferent=normalise(eyesDifferent,upperBound:2) - Generalization
-
A method by which specific values will be replaced with higher-level concepts to better group observations.
Examples of this usually occur when the method for recording some attribute was more precise than need be. For example, if you had GPS statistics of a person’s movements, you might generalize latitude and longitude to an address, thus preventing a system that regarded every minor movement as a change of location. Or, turning numerical measurements into bands of humans, meaning that instead of individuals’ height measurements in millimeters, the relevant factor might be when they are grouped into below-, near-, or above-average height.
- Aggregation
-
A method by which some complex attributes are summarized to allow more efficient analysis.
An example of this is instead of analyzing passages of text as
(Attribute: Text, Classification: Class), keywords (or even word frequencies) can be extracted from the text to present only the most relevant or unique aspects to link with the classification it was given.
Before, between, or after these steps might come a different type of data transformation, wherein data is not just changed, but expanded or reduced:
- Feature construction
-
A method by which new attributes are created, often through inference or combination of other values already present.
An example of this are things like generalization or aggregation in which the original value is also kept, or, more commonly, when two or more values present can tell you (or enable discovery of a third). For instance, if you have a company’s name and country of operation, you can look up its business registry number, or if you have someone’s height and weight you can construct their BMI.
- Data reduction
-
A method by which some attributes are removed, either due to correlating with another attribute or because they’re irrelevant to the problem you are trying to solve.
For example, if you have someone’s address, postcode, and area code, at least one of those pieces of information is redundant. Maybe—as in the case for feature construction—you have some algorithmic reason for wanting to analyze both, but it’s unlikely. High correlation between two or more attributes indicates that they might cause errors in analysis and are candidates for removal.
Verifying the Suitability of a Dataset
After you have reached this point, you should take one more long, hard look at both the problem you are trying to solve and the dataset you propose to use for the job. In the wide world of data analysis that precedes AI applications, there are less strict rules than maybe you would like, but you will often know whether a solution seems off or a dataset doesn’t seem to tell the story you want.
Trust that little voice, because the work wasted if you turn back beyond this point becomes much more substantial.
Explore your data again. Skim it, visualize it, test your solution with tiny subsets of the data—do whatever you need to. If it still feels correct, move forward.
Apple’s Models
We’ve mentioned this a few times now, but it always pays to mention it again: Apple provides a website with an entire collection of useful models. If you want to build a feature that can be accomplished with one of Apple’s models, it’s probably going to be quicker or easier to get it done by using one of those models.
As of this writing, Apple has models available to do the following:
-
Predict depth from an image (FCRN-DepthPrediction)
-
Classify the dominant object in an image (MobileNetV2, Resnet50, and SqueezNet)
-
Segment pixels in an image into classes (DeeplabV3)
-
Detect and classify multiple objects in an image (YOLOv3)
-
Generate answers to textual questions based on a supplied piece of text (BERT-SQuAD)
If your task can make use of one of these, go nuts! Make it happen, and don’t worry about trying to find a dataset and create or train your own model. Just use a premade model and be happy.
We’ll be using one or two of the models provided by Apple in some of the tasks that we cover in Part II.