Capital asset pricing model (CAPM)

The capital asset pricing model (CAPM) is a method of expressing the relation between risk and return for all types of equity. It brings together the risk of a security (often shares) – or a portfolio of securities – and the required return of a security given its risk. The risk of any type of equity is considered to consist of systematic risk, sometimes referred to as market risk or undiversifiable risk, and unsystematic risk, sometimes referred to as company or investment specific risk. According CAPM any provider of equity (either the company owner or an investor) will expect returns that are larger than the risk-free rate (the interest rate) plus the systematic risk of the investment. This premium is expressed with the so-called beta (β). Beta is the measure of risk involved with investing in a particular security relative to the market risk and the risk-free rate.
In any provision of equity (= an investment) there are risks involved, as the actual return on the investment could be different from the expected return. Upon taking an investment decision, the risk element is to be taken into account in relation to the return on investment that is expected. The CAPM is often used in deciding whether or not to invest in a company and in calculating what return should be expected on that investment. It can be used by both company owners and external investors (e.g. venture capitalists). However, the model is better known for its use with regard to investments in a portfolio of companies: a portfolio of shares. It is used by banks, pension funds and other institutional investors.
According to the CAPM, the relationship between the expected return of an individual security (share) and its market risk can be expressed as (Figure 26.1):
r = rf + β (rm – rf)
where
| r | = | expected return from an individual security (share) |
| rf | = | risk-free rate |
| β | = | beta coefficient (measure of the market risk of an individual security) |
| rm | = | expected return from an investment in all securities (shares) available on the market (market return). |
The CAPM states what the security-appropriate required return should be. In other words, what the appropriate discount rates should be for that security, i.e. the rate at which future cash flows produced by the investment should be discounted given that security’s relative riskiness. The riskiness is expressed using the security’s beta (β). The market as a whole has – by definition – a beta of 1, as β reflects the specific sensitivity of a security to the non-diversifiable market risk. β > 1 signifies more than average ‘riskiness’; β < 1 indicates lower than average ‘riskiness’. Although the risk-free rate is presented as a steady factor in the formula, this rate is not fixed and will change with changing economic conditions.
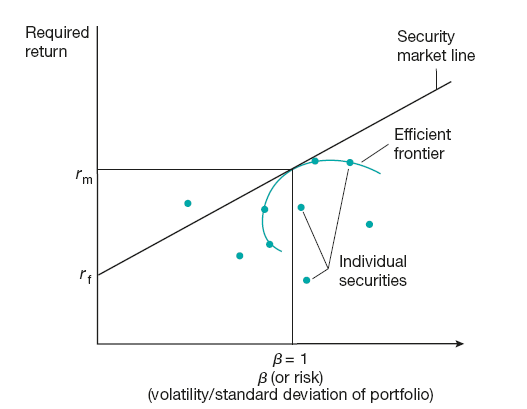
Figure 26.1 Expected return vs market risk
The CAPM can also be – and is mostly – used to calculate the optimal set of securities in a portfolio. The CAPM assumes that the risk–return profile of a set of securities can be optimised, with an optimal portfolio being the set of securities with the lowest possible level of risk for its level of return on all securities in the portfolio. Additionally, as each additional asset introduced into a portfolio further diversifies the portfolio, the optimal portfolio must comprise every asset, with each asset value-weighted to achieve the above. The CAPM assumes that investors will want to hold fully diversified portfolios, as they tend to be risk-averse. This means that investors are assumed by CAPM to want a return on an investment based on its systematic risk alone, on its β. And as the unsystematic risk is diversifiable, the total risk of a portfolio with enough diversification through its securities can be viewed as equal to β.
A combination of assets, i.e. a portfolio, is referred to as ‘efficient’ if it has the best possible expected level of return for its level of risk. When the portfolio does not include any holdings of risk-free assets, a so-called ‘efficient frontier’ can be found. This efficient frontier represents portfolios for which there is the lowest risk for a given level of expected return. Equivalently, a portfolio lying on the efficient frontier represents the combination offering the best possible expected return for given risk level.
Today, the CAPM is still a popular model with investors, due to its simplicity and utility in a variety of situations and even though there are more modern approaches to asset pricing and portfolio selection. Although its construction requires many assumptions, most of these can be relaxed without changing the basic results of the model. In spite of doubts some have with the model, the use of β coefficients is widely spread (as they are frequently published) in the world of financial professionals and professional investors.
Arnold, G. (2010), The Financial Times Guide to Investing: the Definitive Companion to Investment and the Financial Markets, 2nd edn. London: Financial Times/Prentice Hall.
French, C.W. (2003) ‘The Treynor capital asset pricing model’. Journal of Investment Management 1(2), 60–72.
Schlosser, M. (1989), Corporate Finance: a Model Building Approach. London: Prentice Hall.