Chapter 6. Laboratory: Separating Mixtures
Laboratory 6.1: Differential Solubility: Separate Sand and Sucrose
Differential solubility was one of the earliest methods developed for separating mixtures. Differential solubility depends on the fact that different substances have different solubility in different solvents. In this lab, we’ll examine the simplest example of differential solubility: separating a mixture of two compounds, one of which is freely soluble in water and one of which is insoluble in water.
Procedure
If you have not already done so, put on your splash goggles, gloves, and protective clothing.
Weigh about 10.0 g of dry sand and about 10.0 g of sucrose and add both of them to a beaker. Record the masses on lines A and B of Table 6-1.
Stir the mixture or swirl the beaker until the sucrose and sand are thoroughly mixed.
Add about 25 mL of water to the beaker, and stir thoroughly to dissolve the sucrose.
Weigh a piece of filter paper and record the mass in Table 6-1.
Weigh the second beaker and record the mass in Table 6-1.
Set up your filter funnel over the second beaker, using the filter paper you weighed in the preceding step.
Swirl the contents of the first beaker to keep as much sand as possible suspended in the liquid, and pour the liquid through the filter funnel.
Use the wash bottle to rinse the beaker with a few mL of water and pour that water with any remaining sand through the filter funnel, collecting the filtrate (the liquid that passes through the filter paper; the solid remaining in the filter paper is called the filtrand) in a second beaker. Repeat if necessary until all of the sand has been transferred from the first beaker to the filter funnel.
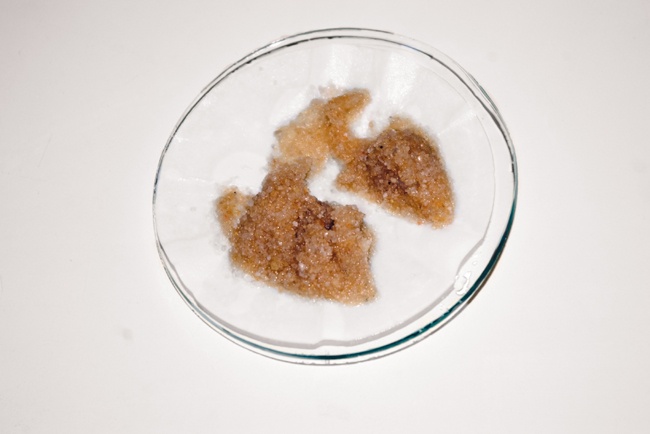
Remove the filter paper from the funnel, being careful not to lose any of the sand. Place the filter paper on a watch glass, as shown in Figure 6-1, and heat it gently under a heat lamp or in a microwave or conventional oven until all moisture is driven off.
Weigh the filter paper and record the mass of the filter paper plus sand in Table 6-1. Calculate the mass of the sand.
Place the second beaker on the hot plate and bring it to a gentle boil. Continue boiling the solution until nearly all of the water has been vaporized. As the volume of the solution is reduced, the sugar begins to crystallize. Use the stirring rod to break up any large masses of crystals as they form. Reduce heat and continue heating gently until the sucrose remaining in the beaker appears dry. Be careful not to overheat the sucrose and char it.
After allowing it to cool completely, weigh the second beaker and record the mass of the beaker plus sucrose in Table 6-1. Calculate the mass of the sucrose.
Caution
Although the chemicals used in this laboratory session are not hazardous, it is a matter of good laboratory practice to wear splash goggles, gloves, and protective clothing at all times. Be careful when heating the mixture with the hotplate.
Dr. Paul Jones Comments
Make observations of the physical appearance of the sand and sugar. Does it change as you go through the process? This is a good rule of thumb to consider during any physical or chemical manipulation.
Item | Mass |
A. Sand, initial | ________.___ g |
B. Sucrose, initial | ________.___ g |
C. Filter paper | ________.___ g |
D. Second beaker | ________.___ g |
E. Filter paper + sand | ________.___ g |
F. Second beaker + sucrose | ________.___ g |
G. Sand, final (E – C) | ________.___ g |
H. Sucrose, final (F – D) | ________.___ g |
Review Questions
Laboratory 6.2: Distillation: Purify ethanol
Distillation is the oldest method used for separating mixtures of liquids. Distillation uses the fact that different liquids have different boiling points. When a mixture of liquids is heated, the liquid with the lower (or lowest) boiling point vaporizes first. That vapor is routed through a condenser, which cools the vapor and causes it to condense as a liquid; the liquid is then collected in a receiving vessel. As the original liquid mixture continues to be heated, eventually some or all of the lower-boiling liquid is driven off, leaving only the higher-boiling liquid or liquids in the distillation vessel.
I say “some or all” because distillation is an imperfect method for separating mixtures of liquids that form azeotropes. An azeotrope, also called a constant boiling mixture, is a mixture of two or more liquids at a specific ratio, whose composition cannot be altered by simple distillation. Every azeotrope has a characteristic boiling point, which may be lower (a positive azeotrope or minimum-boiling mixture) or higher (a negative azeotrope or maximum-boiling mixture) than the boiling points of the individual liquids that make up the azeotrope.
For example, ethanol forms a positive azeotrope with water. The boiling point of a mixture of 95.6% ethanol (by weight) with 4.4% water is 78.1°C, which is lower than the boiling point of pure water (100°C) or pure ethanol (78.4°C). Because the azeotropic mixture boils at a lower temperature, it’s impossible to use simple distillation to produce ethanol at concentrations higher than 95.6%. (More concentrated ethanol solutions can be produced by using drying agents such as anhydrous calcium chloride that physically absorb the water from a 95.6% solution of ethanol. These solutions must be stored and handled carefully; otherwise, they absorb water vapor from the air until they reach the 95.6% azeotropic concentration.)
Ethanol also forms azeotropes with many other liquids, including some that are poisonous or taste bad. This allows production of denatured ethanol, which is toxic, cannot be drunk, and can therefore be sold cheaply without cannibalizing sales of (and taxes on) much more expensive potable ethanol, such as vodka and other distilled beverages.
In this laboratory, we’ll use distillation to increase the concentration of an ethanol solution. At 25°C, pure water has a density of 0.99704 g/mL and pure ethanol a density of 0.78736 g/mL. Solutions of ethanol and water have densities between these figures. If you add the densities of the pure liquids and divide by two, you get 0.89220 g/mL, which you might assume is the density of a 50/50 ethanol-water mixture. As it turns out, that’s not true. Ethanol and water do not mix volumetrically; that is, if you mix 100 mL of pure ethanol with 100 mL of pure water, you do not get 200 mL of solution, for the same reason that dissolving 100 mL of sucrose in 100 mL of water does not yield 200 mL of solution.
Nonetheless, it’s possible to determine the concentration of ethanol by measuring the density of the solution and comparing that value to ethanol-water density tables available in the CRC handbook and similar publications. We’ll measure the density of the starting solution and the resulting distillate and compare those values to published values to determine the ethanol concentrations of the two solutions.
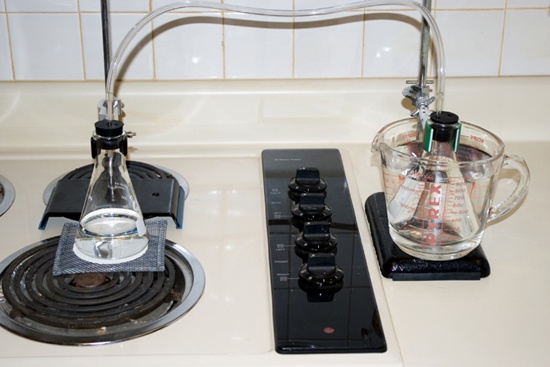
Figure 6-2 shows the distillation apparatus that I used for this laboratory session. Note that both flasks are securely clamped to prevent tipping, and that the stopper in the receiving flask (right) has an open hole to vent the flask and prevent pressure buildup. The receiving flask sits in a large container of ice water. As the alcohol vapor passes through the tubing and into the receiving flask, it condenses immediately when it contacts the cold air in the receiving flask.
Procedure
If you have not already done so, put on your splash goggles, gloves, and protective clothing.
Weigh the volumetric flask on your balance and record the mass in on line A of Table 6-2.
Transfer 100.00 mL of ethanol to the volumetric flask and reweigh the flask. Record the mass on line B of Table 6-2.
Subtract line A from line B and record the result (the mass of the 100 mL of ethanol) on line C. Divide line C by 100 to give the density of the ethanol in g/mL and record this value on line D.
Empty the ethanol from the volumetric flask into the distillation vessel and add about 100 mL more ethanol. Add one or two boiling chips to the flask.
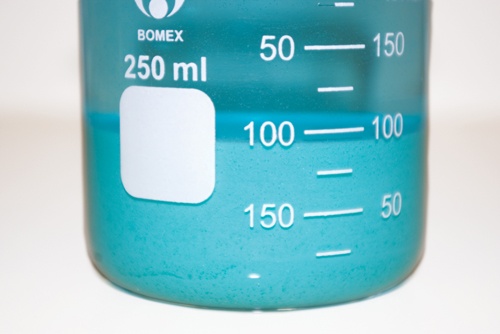
Reassemble the distillation apparatus, using the 250 mL beaker as the receiving vessel.
Turn on the hotplate and bring the ethanol to a gentle boil. As the ethanol begins to boil, the temperature indicated by the thermometer in the distillation apparatus will begin to climb rapidly until it stabilizes at the temperature of the ethanol-water vapor.
Continue the distillation until more than 100 mL of distillate has collected in the receiving vessel. (Make sure that the indicated temperature does not climb above the stable value; if it does, that indicates that the ethanol has been eliminated from the distillation vessel and what you’re transferring to the receiving vessel is pure water. If that occurs, start again using more of the original ethanol mixture.)
Allow the distillate to cool to room temperature.
Transfer 100.0 mL of the distillate to the volumetric flask, weigh the flask and contents, and record the mass on line E of Table 6-2.
Subtract line A from line E to determine the mass of the distillate, and record this value on line F of Table 6-2.
Divide line F by 100 to give the density of the distillate in g/mL and record this on line G.
Disposal
You can retain the distilled ethanol and use it as fuel for your alcohol lamp or for any other purpose that requires denatured ethanol where concentration is not critical, or you can safely pour it down the drain. If you retain the distillate, label it properly.
Data | |
A. Volumetric flask | _________.___ g |
B. Volumetric flask with 100 mL 70% ethanol | _________.___ g |
C. Mass of 100 mL 70% ethanol (B – A) | _________.___ g |
D. Density of 70% ethanol (C/100) | _________.___ g/mL |
E. Volumetric flask with 100 mL distilled ethanol | _________.___ g |
F. Mass of 100 mL distilled ethanol (E – A) | _________.___ g |
G. Density of distilled ethanol (F/100) | _________.___ g/mL |
Review Questions
Laboratory 6.3: Recrystallization: Purify Copper Sulfate
In this lab, we’ll use a procedure called recrystallization to purify crude copper sulfate. Crude copper sulfate is a mixture of copper sulfate with various impurities that may include copper carbonate, copper oxides, and other copper compounds. You can obtain crude copper sulfate at a hardware or lawn and garden store, where it is sold as a root killer or for pond treatment.
Many chemicals besides copper sulfate are available inexpensively in impure forms, such as technical and practical grades. Although these chemicals may be insufficiently pure for general lab use, many of them can be purified to the equivalent of laboratory grade or even reagent grade by using recrystallization.
Successful recrystallization depends upon two factors. First, crystals are the purest form of a chemical, because there is no room for impurities in the crystalline lattice. As crystals grow in a solution of an impure chemical, the impurities remain in solution. Second, some chemicals are much more soluble in hot water than in cold. For example, the solubility of copper sulfate pentahydrate, the chemical that we’ll purify in this lab, is 203.3g/100mL at 100°C, versus only 31.6g/100mL at 0°C.
In other words, a saturated solution of copper sulfate at 100°C contains about six times more copper sulfate than the same amount of solution at 0°C. If we saturate boiling water with impure copper sulfate and then cool that solution to 0°C, about 5/6 of the copper sulfate crystallizes in pure form, leaving the impurities in solution (along with about 1/6 of the original copper sulfate).
Once the crystals have formed, they can be separated from the supernatant liquid by filtration or by decanting off the liquid. In either case, some of the contaminated liquid remains mixed with the purified copper sulfate crystals. You remove this last bit of contamination by rinsing the crystals with a small amount of ice-cold water or another solvent that is miscible with water, such as acetone, leaving only purified copper sulfate crystals.
We’ll use acetone for the final rinse, because copper sulfate is almost insoluble in acetone. If we used ice-cold water, some of our purified copper sulfate would dissolve in the rinse water, lowering our final yield. Using acetone flushes away impurities without dissolving the copper sulfate crystals. Volatile organic solvents like acetone also evaporate faster and more completely than water.
Procedure
If you have not already done so, put on your splash goggles, gloves, and protective clothing.
Place a weighing paper on the balance pan and tare the balance to read 0.00 g. Add the crude copper sulfate pentahydrate until the balance indicates about 250 g. Record the mass of the crude copper sulfate to 0.01 g on line A of Table 6-3. If the maximum capacity of your balance is less than 250 g, weigh multiple samples until you accumulate about 250 g total. Transfer the copper sulfate to the second 250 mL beaker.
Set your balance to read 0.00 g and weigh a piece of filter paper. Record the mass of the filter paper to 0.01 g in Table 6-3, and use a pencil to write the mass on the filter paper itself.
Fan-fold (flute) the massed filter paper and set it aside for later use.
Set up your filter funnel with another piece of fan-folded filter paper over one of the 250 mL beakers.
Use the 100 mL graduated cylinder to measure 150 mL of hot tap water, and add it to the copper sulfate in the 250 mL beaker.
Place the beaker on the hotplate and bring the water to a gentle boil. Stir the solution until all of the crude copper sulfate has dissolved. Any solid matter that refuses to dissolve is an insoluble impurity and can be ignored.
Dr. Paul Jones Comments
I wouldn’t say that it can be “ignored.” As described in the following step, any insoluble residue should be trapped via hot filtration and discarded. Don’t add more water to try to dissolve it. Also, hot filtration works best if you heat the receiving vessel up prior to filtration. Use a little boiling water to heat the filter paper and funnel. This reduces crystallization on the paper.
Using the beaker tongs, pour the hot copper sulfate solution through the filter paper as quickly as possible. Some copper sulfate may recrystallize when it contacts the cooler filter paper, funnel, or receiving beaker, but it should go back into solution as you continue to pour the hot solution through the funnel.
As the solution cools, copper sulfate will begin crystallizing. Slow cooling produces larger crystals, and fast cooling smaller crystals. Smaller crystals are easier to handle and weigh, so we want to produce crystals as small as possible. Our goal, then, is to cool the solution as fast as possible from the boiling point to near the freezing point. To do that, place the beaker of hot solution in an ice bath (a larger container full of crushed ice) or a freezer.
As the solution cools, stir it periodically with the thermometer. While you’re waiting for the solution to cool to 0°C, remove the used filter paper from the filter funnel, rinse the funnel clean, and put in the fan-folded filter paper that you weighed earlier. Also rinse the original 250 mL beaker clean and place it under the funnel.
When the solution has cooled to 0°C, use the stirring rod to free any crystals that have grown on the sides of the beaker. Swirl the contents of the beaker gently to keep the crystals suspended in the solution, and pour the solution through the filter funnel.
Use a few mL of acetone to rinse any remaining crystals from the beaker and pour the acetone through the filter funnel, trying to make sure it wets all of the crystals in the filter paper.
Carefully remove the filter paper and set the purified copper sulfate crystals aside to dry.
When the filter paper and copper sulfate is completely dry, weigh it and record the mass of the filter paper and copper sulfate crystals in Table 6-3.
Transfer the purified copper sulfate crystals to a labeled bottle, and retain them for use in later laboratory sessions.
At this point, we have (assuming no losses) about 200 g of pure copper sulfate crystals on the filter paper and about 50 g of crude copper sulfate dissolved in about 150 mL of solution. Rather than waste that 50 g of crude copper sulfate, we’ll use it to produce some crude copper carbonate, which we’ll use in a later laboratory session.
Copper sulfate is fairly soluble in water, as are sodium carbonate and sodium sulfate, but copper carbonate is extremely insoluble in water. We’ll take advantage of these differential solubilities to produce, separate, and purify copper carbonate. By reacting the waste copper sulfate solution with a solution of sodium carbonate, we precipitate nearly all of the copper ions as the insoluble carbonate salt, leaving sodium sulfate in solution.
Weigh about 50 g of sodium carbonate heptahydrate and transfer it to the empty 250 mL beaker.
Use the graduated cylinder to measure about 100 mL of warm tap water and transfer it to the beaker with the sodium carbonate. Stir until the sodium carbonate dissolves.
Pour the 100 mL of sodium carbonate solution into the beaker of copper sulfate solution, with stirring.
Put a fresh piece of fan-folded filter paper into the filter funnel and place the empty beaker beneath the funnel. Swirl the contents of the beaker to keep the precipitate suspended in the solution and pour the solution through the filter paper.
Rinse the precipitate three times with about 50 mL of water each time. This step removes nearly all of the sodium sulfate from the precipitate, as well as any other soluble salts formed by trace contaminants in the original waste solution.
Carefully remove the filter paper and set the copper carbonate aside to dry. If you have sufficient acetone, you can do a final rinse with 25 mL to 50 mL of acetone to remove nearly all of the water and allow the copper carbonate to dry faster.
Transfer the copper carbonate to a labeled bottle, and retain it for use in a later laboratory session.
Item | Data |
A. Crude copper sulfate | _________.___ g |
B. Filter paper | _________.___ g |
C. Filter paper plus purified copper sulfate | _________.___ g |
D. Purified copper sulfate (C – B) | _________.___ g |
Review Questions
Laboratory 6.4: Solvent Extraction
Solvent extraction, also called liquid-liquid extraction or partitioning, is a procedure used to separate compounds based on their solubility in two immiscible liquids—usually water and an organic solvent. During solvent extraction, one or more of the solutes in one of the liquid phases migrates to the other liquid phase. The two liquid phases are then physically separated and the desired product is isolated from the phase that contains it.
Solvent extraction is one of the most commonly used laboratory purification methods, particularly in organic chemistry labs. Solvent extractions done in chemistry labs are usually small-scale, batch-mode operations using a separatory funnel. Solvent extraction is also widely used in industrial operations. Some industrial applications use batch-mode extraction, albeit usually on a much larger scale than laboratory solvent extractions. Other industrial applications use continuous-mode solvent extractions, often on a gigantic scale, where the two solvents are continuously added to and removed from a large reaction vessel.
In some solvent extractions, the desired product migrates from the original liquid phase to the second liquid phase. In other solvent extractions, impurities migrate from the original liquid phase to the second liquid phase, leaving the product in the original liquid phase. The phase that contains the desired product is called the product layer. The phase that contains impurities, excess reactants, and other undesirable compounds is called the waste layer. Many first-year organic chemistry students come to grief by discarding what they think is the waste layer, only to learn later that they actually discarded the product layer.
In this laboratory, we’ll use solvent extraction to isolate the iodine present in Lugol’s solution, an aqueous solution of iodine and potassium iodide.
Dr. Paul Jones Comments
Maybe you’re relying on them learning the hard way, which to be honest really is the only way to learn this lesson, but I like to explicitly tell students not to throw anything away until they have gotten the product they want/expect. But, yes, no one listens. Alas, the life of a teacher. They think you’re an idiot as long as you’re in their presence and only after they’re miles and years away do they realize you weren’t a boob.
Procedure
If you have not already done so, put on your splash goggles, gloves, and protective clothing.
Fill a test tube about halfway with water.
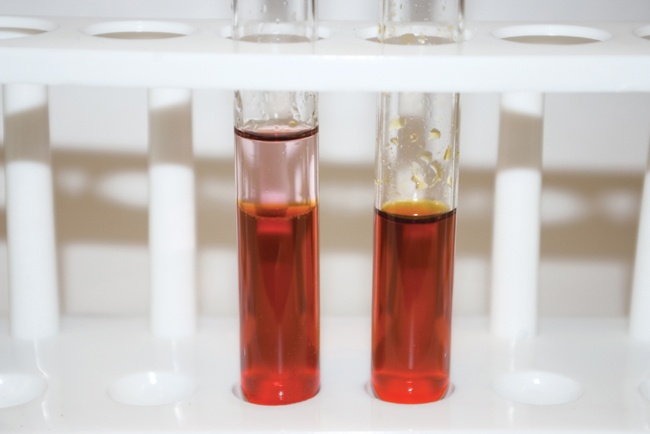
Add about 1 mL (~20 drops) of Lugol’s solution to the test tube. Stopper the tube and agitate it until the contents are thoroughly mixed. Record anything unusual about the appearance of the aqueous solution on line A of Table 6-4.
Use the eyedropper to carefully add about 1 mL of lighter fluid to the test tube by allowing it to run down the inner surface of the test tube, as shown in Figure 6-5. (If you substitute another solvent for the lighter fluid, make sure that it forms a distinct layer on top of the aqueous solution of iodine. If it doesn’t, you’ll have to start again, using a solvent that does not mix with water.) Record the appearance of the organic solvent layer on line B of Table 6-4.
Stopper the test tube and agitate it vigorously for 15 seconds. Record the appearance of the mixed layers immediately after you complete the agitation on line C of Table 6-4.
Place the test tube in the rack and allow it to settle for 30 seconds or so. Record the appearance of the aqueous and organic layers on lines D and E of Table 6-4.
After the two layers have separated completely, use the eyedropper to draw off the top (organic) layer as completely as possible. Transfer the organic layer to the watch glass and set it aside to allow the solvent to evaporate.
Add about 1 mL of lighter fluid to the aqueous solution. Stopper the tube, agitate it, and wait for the layers to separate. Record the appearance of the aqueous and organic layers on lines F and G of Table 6-4.
Caution
Iodine is toxic and irritating, and stains skins and clothing. Stains can be removed with a dilute solution of sodium thiosulfate. Lighter fluid is flammable. Wear splash goggles, gloves, and protective clothing.
Disposal
The aqueous waste can be flushed down the drain with plenty of water. The few milligrams of solid iodine can be flushed down the drain or disposed of with solid household waste.
Layer | Appearance |
A. Aqueous iodine solution | |
B. Organic layer (before agitation) | |
C. Mixed layers (after agitation) | |
D. Aqueous layer (after settling) | |
E. Organic layer (after settling) | |
F. Aqueous layer (after second extraction) | |
G. Organic layer (after second extraction) |
Review Questions
Laboratory 6.5: Chromatography: Two-Phase Separation of Mixtures
Chromatography (from the Greek for “color-writing”) is a method for separating mixtures. In chromatography, a mixture (called the analyte or sample) dissolved in a mobile phase (sometimes called the solvent or carrier) passes through a stationary phase (sometimes called the substrate). During the passage, various components of the analyte carried by the mobile phase selectively adhere to the stationary phase with greater or less affinity, separating the components physically across the stationary phase.
The Russian botanist Mikhail Semyonovich Tsvet invented chromatography in 1900, and used it to separate chlorophyll and other plant pigments. Tsvet named his new procedure “chromatography” because his chromatograms were literally colorful. Nowadays, chromatography is often used to separate colorless compounds, so the original rationale for the name no longer applies.
The simplest chromatography method—the one we explore in this laboratory—is called paper chromatography. Unlike other chromatography methods, paper chromatography requires no expensive equipment or special materials. In paper chromatography, the mobile phase is water or another solvent, and the stationary phase is paper. The solvent is absorbed by the paper, and dissolves a spot of the analyte. As the solvent is drawn up the paper by capillary action, the various dissolved components of the mixture are deposited on the paper at different distances from the original spot.
Other chromatography methods—including thin-layer chromatography (TLC), gas chromatography, and liquid chromatography—are often used in laboratories and industrial processes. These other methods have various advantages compared with paper chromatography, including faster throughput, sharper separations, higher sensitivity, and smaller required analyte amounts. Most chromatography done in laboratories is analytical chromatography, which requires only small amounts of analyte and is used to separate mixtures for subsequent instrumental or wet analyses and to follow reactions to completion or equilibration. Conversely, industrial chromatography is preparative chromatography, which uses large (sometimes huge) amounts of analyte, and is used to purify compounds on a commercial scale.
In paper chromatography, it’s important to choose an appropriate solvent. Polar solvents are more efficient carriers for polar analytes, such as ionic compounds. Nonpolar solvents are more efficient carriers for molecular (covalent) compounds. Some examples of common solvents in decreasing order of polarity are:
water
amides (e.g., N,N-dimethylformamide)
alcohols (e.g., ethanol, isopropanol)
ketones (e.g., acetone, methyl ethyl ketone)
esters (e.g., ethyl acetate, amyl acetate)
chlorocarbons (e.g., dichloromethane, carbon tetrachloride, chloroform)
ethers (diethyl ether)
aromatics (benzene, toluene)
alkanes (hexanes, heptanes, petroleum ether)
Mixed solvents are used in paper chromatography to separate mixtures that contain both polar and nonpolar compounds, or to increase separation of mixtures of components that have similar behavior with a single solvent. The rule of thumb for mixed solvents is that a small amount of a polar solvent mixed with a large amount of a nonpolar solvent tends to behave as a polar solvent.
The key metric for paper chromatography is called the retardation factor (Rf), which is the ratio of distance the analyte moves from the initial point to the distance the solvent front moves from the initial point. In other words, Rf = (migration distance of the analyte)/(migration distance of the solvent).
For example, if a spot of analyte migrates 2 cm from the initial point during the time it take the solvent front to migrate 5 cm from the initial point, the Rf for that compound with that particular solvent and that particular substrate is 0.40 (2 cm/5 cm). The Rf of a particular compound is a dimensionless number that is fixed for any particular combination of solvent and substrate, but may vary dramatically for other combinations of solvent and substrate. (Many texts incorrectly define Rf as retention factor (k), which is a related but separate concept.)
Caution
Most of the solvents used in this laboratory are flammable. Use extreme care, avoid open flame, and have a fire extinguisher handy. Wear splash goggles, gloves, and protective clothing.
Dr. Paul Jones Comments
You can generally correct mid-experiment if you started at too low of a polarity; it is difficult to make the correction the other direction on the fly.
In this lab, we’ll examine many aspects of paper chromatography, including ionic and molecular analytes, polar and nonpolar solvents, and two-dimensional chromatography.
Procedure
This lab has two parts. In Part I, we’ll use basic paper chromatography to examine the effect of polar and nonpolar solvents on the dyes contained in permanent and water-soluble marking pens. In Part II, we’ll use two-dimensional chromatography to achieve better separation of these dyes.
Part I: Basic Chromatography
If you have not already done so, put on your splash goggles, gloves, and protective clothing.
Label each chromatography jar with the solvent that it will contain. Transfer enough solvent into each chromatography jar to provide about 2.5 cm of liquid in the bottom of the jar. Cover the jars. Ideally, we want the air in each jar to become saturated with the vapor from the solvent contained in that jar.
Prepare 12 chromatography strips, each about 15 mm to 25 mm wide and about as long as your chromatography jars are tall. Draw a fine pencil line across each strip about 4 cm from one end. At the opposite end, label the strips A through L.
Prepare the 12 labeled chromatography strips by spotting each of them with the water-soluble and permanent black and brown marking pens in the center of the pencil line. The goal is to create spots that are as small and as concentrated as possible. Choose one of the pens and touch it to the center of the pencil line on strip A. Allow the paper to absorb ink until there is a spot 2 to 3 mm in diameter. Remove the pen, and allow the ink spot to dry completely while you spot strips B and C with the same pen (one strip for each of the three solvents). Return to strip A and place the tip of the marker pen in the center of the existing ink spot. Allow the paper to absorb more ink without significantly increasing the size of the spot. Retreat strips B and C similarly, and repeat this process until each strip has been treated at least five times. Repeat this procedure using the second marking pen for strips D, E, and F, the third marking pen for strips G, H, and I, and the fourth marking pen for strips J, K, and L. At the end of this procedure, you have 12 strips, 3 marked with each pen: the black water-soluble pen, the brown water-soluble pen, the black permanent pen, and the brown permanent pen. Record the analyte (pen type) used for each strip in Table 6-5.
Attach a paper clip to the labeled end of each strip.
Thread the stiff wire through the paper clips for strips A, D, G, and J (one strip of each marking pen type). Suspend those four strips in the first chromatography jar. The bottom of each strip should be immersed about 2 cm into the solvent. Make sure that the spot on each strip remains well above the level of the solvent. Repeat this procedure to suspend strips B, E, H, and K in the second chromatography jar, and strips C, F, I, and L in the third chromatography jar.
Observe the rate at which each solvent is drawn up the paper by capillary action. Different solvents and different types of paper progress at different rates. Typically, it might take from five minutes to one hour for the solvent front to approach the top of the strip. If the solvent front stops climbing before it reaches the top of the strip, that means that the capillary action and evaporation rate have reached equilibrium. Stop the process for strips using that solvent when the solvent front reaches that level. Otherwise, allow the solvent front to approach (but not reach) the top of the strip.
When the solvent front approaches the top of a set of strips (or stops climbing), immediately remove those strips from the chromatography jar. Use the pencil to make a small mark at the highest point that the solvent front reached on each strip. Suspend the strips and allow them to dry thoroughly.
For each strip, measure the distance between the pencil line and the maximum height reached by the solvent front. Record that value on the strip itself and in Table 6-5. Also measure the distance between the pencil line and any significant color spots on the strip—measure from the line to the middle of the spot—recording their descriptions, distances, and Rf values in Table 6-5.
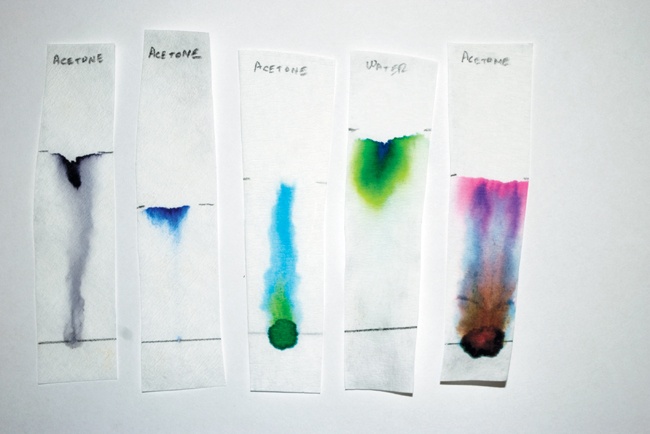
Figure 6-6 shows five example chromatograms. None of these show particularly good separation of the components, but all illustrate some important issues.
From the left, the first two chromatograms are of black and blue permanent markers, using acetone as the solvent. (Neither dye was at all soluble in water.) No separation is evident, which almost certainly means that these pens use a single dye. (It’s just possible, although very unlikely, that two or more dyes were used that had identical characteristics with this substrate and solvent, in which case there would also be no separation.) Clearly, the blue dye bonds very tightly to the acetone solvent, and quite loosely to the paper substrate, which accounts for its very sharply delineated spot. Conversely, the black dye, although readily soluble in acetone, clearly also bonds more tightly to the paper substrate, accounting for the strung-out spot it produces.
The third and fourth strips were spotted with green food coloring dye, which is clearly a mixture of dyes. The third strip used the nonpolar acetone as a solvent. The blue component of the green food coloring dye obviously binds tightly to acetone and reasonably tightly to the paper substrate. The yellow component is just emerging from the spot, showing that, although it is at least somewhat soluble in acetone, it binds to the acetone solvent and the paper substrate about equally. The fourth strip was also spotted with green food coloring dye, but uses water, which is extremely polar, as the solvent. Both the blue and yellow components of the dye bind tightly to water, and were therefore carried far up the strip. Note that some separation is evident, with the blue component concentrated toward the top of the solvent front and the yellow component lagging slightly.
Finally, the fifth strip was spotted with a mixture of green and red food coloring dye, and developed using acetone. Clearly, the red component of the mixed dyes bonds very tightly to acetone, and is concentrated and relatively sharply delineated near the solvent front. The blue component lags somewhat, and is more spread out. As was true with the third strip, the yellow component has barely made any progress, and is visible as a brownish area near the starting point, where the yellow dye is mixed with some remaining red and blue dye.
Part II: Two-Dimensional Chromatography
If an analyte contains several different compounds, it sometimes happens that a particular solvent achieves better separation for some of the compounds than for others. Another solvent might provide better separation of those problem compounds, but poorer separation of the compounds that were well separated by the first solvent. One way to separate such analyte mixtures is to use two passes with different solvents, reorienting the substrate by 90° between the runs. The solvent used in the first pass achieves good separation of some of the components. Those components that are not well separated by the first solvent are separated by the second solvent. Because the new solvent front moves at 90° relative to the first solvent front, the resulting chromatogram is two-dimensional. Such two-dimensional chromatograms yield characteristic (and often colorful) patterns even with complex mixtures of analytes.
If you have not already done so, put on your splash goggles, gloves, and protective clothing.
Prepare six squares of chromatography paper and label them A through F.
Draw a pencil line parallel to and about 4 cm from one edge of each square, and label that line 1. Draw a second perpendicular pencil line about 4 cm from an adjoining edge, and label that line 2.
Spot each square at the intersection of the lines, as described in Part I. Spot squares A, B, and C with both the brown and black permanent marking pens, at least five times each. Spot squares D, E, and F with both the brown and black water-soluble marking pens, at least five times each. Record the analyte for each square in Table 6-6.
Using the stiff wire and two paper clips, suspend square A in the first chromatography jar, square B in the second jar, and square C in the third jar.
When the solvent front approaches the top of each square, remove the square from the chromatography jar, mark the highest point reached by the solvent front, and suspend the square to dry.
While the first set of squares is drying, suspend square D in the first chromatography jar, square E in the second jar, and square F in the third jar. When the solvent front approaches the top of each square, remove the square from the chromatography jar, mark the highest point reached by the solvent front, and suspend the square to dry.
When the first set of squares is dry, rotate square A 90° to put the second pencil line parallel with the bottom of the chromatography jar and suspend square A in the second chromatography jar. Repeat this procedure to put square B in the third jar and square C in the first jar. When the solvent front approaches the top of each square, remove the square from the chromatography jar, mark the highest point reached by the solvent front, and suspend the square to dry.
When the second set of squares is dry, rotate square D 90° to put the second pencil line parallel with the bottom of the chromatography jar and suspend square D in the second chromatography jar. Repeat this procedure to put square E in the third jar and square F in the first jar. When the solvent front approaches the top of each square, remove the square from the chromatography jar, mark the highest point reached by the solvent front, and suspend the square to dry.
Dr. Paul Jones Comments
You might also try chromatography of an uncolored substance. Dissolve aspirin in acetone (or water) and apply to paper, run it up the paper and let the paper dry. Of course, you then have a problem. The aspirin is colorless, so how can you see where it is on the paper? One common method used to make invisible substances visible on the chromatography paper is iodine fuming. Place a few crystals of iodine on the bottom of a large beaker or similar container. Put the chromatogram in the container, and cover the container with a watchglass or plastic wrap. The iodine vaporizes and reacts with the aspirin (and many other analytes) to form a visible mark on the paper. At room temperature, this process may take several hours. You can speed things up by heating the bottom of the beaker gently with an alcohol lamp or by partially submerging the beaker in warm water to vaporize the iodine quickly. If you’re going to run a lot of chromatograms, it makes sense to keep an iodine-saturated container for this purpose. That way you don’t have to wait.
Review Questions
Laboratory 6.6: Determine the Formula of a Hydrate
Many ionic compounds exist in two or more forms. The anhydrous form of the compound contains only molecules of the compound itself. The hydrated form or forms of the compound contains molecules of the compound and one or more molecules of water loosely bound to each molecule of the compound. These water molecules are referred to as water of hydration or water of crystallization, and are incorporated into the crystalline lattice as the compound crystallizes from an aqueous solution.
Because these water molecules assume defined positions within the crystalline lattice, the proportion of water molecules to compound molecules is fixed and specific. For example, copper sulfate exists as an anhydrous compound (CuSO4) and in hydrated form as the pentahydrate (CuSO4 · 5H2O). Copper sulfate does not exist in the tetrahydrate (CuSO4 · 4H2O) or hexahydrate (CuSO4 · 6H2O) forms, because the physical geometry of the crystalline lattice does not permit four or six water molecules to associate with one copper sulfate molecule. The number of molecules of water in a hydrate is usually an integer, but not always. For example, some hydrates exist in the form X2· 5H2O, where each molecule of the compound X is associated with a fractional number (in this, case 2.5) molecules of water.
Some compounds, including copper sulfate, have only one stable hydrated form. (Monohydrate and trihydrate forms of copper sulfate are known, but are difficult to prepare and tend to spontaneously convert to the more stable anhydrous or pentahydrate forms by absorbing or giving up water molecules.) Other compounds have two or more common hydrated forms. For example, sodium carbonate exists in anhydrous form (Na2CO3), monohydrate form (Na2CO3 · 1H2O), heptahydrate form (Na2CO3 · 7H2O), and decahydrate form (Na2CO3 · 10H2O).
Many anhydrous compounds are hygroscopic, which means they absorb water vapor from the air and are gradually converted to a hydrated form. Such compounds, such as calcium chloride (CaCl2), are often used as drying agents. (Some of these compounds absorb so much water vapor from the air that they actually dissolve in the absorbed water, a property called deliquescence.) Conversely, the water molecules in some hydrated compounds are so loosely bound that the compound spontaneously loses some or all of its water of hydration if left in a dry environment, a property called efflorescence. Some compounds may be either hygroscopic or efflorescent, depending on the temperature and humidity of the environment. For example, anhydrous copper sulfate exposed to a humid atmosphere gradually absorbs water vapor and is converted to the pentahydrate form, and copper sulfate pentahydrate exposed to warm, dry air gradually loses water and is converted to the anhydrous form.
Because the water of crystallization in a hydrate can be driven off by heating the hydrate, a hydrate is actually a mixture of an anhydrous salt with water rather than a separate compound. (Recall that a mixture is a substance that can be separated into its component parts by physical means, such as heating, as opposed to a substance that can be separated into its component parts only by using chemical means.) Because the number of water molecules in a hydrate are in fixed proportion to the number of molecules of the compound, it’s possible to determine that fixed proportion by weighing a sample of a hydrate, heating the compound to drive off the water of crystallization, weighing the resulting anhydrous compound, and using the mass difference between the hydrated and anhydrous forms to calculate the relationship.
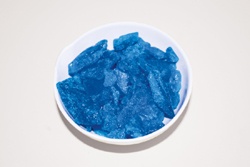
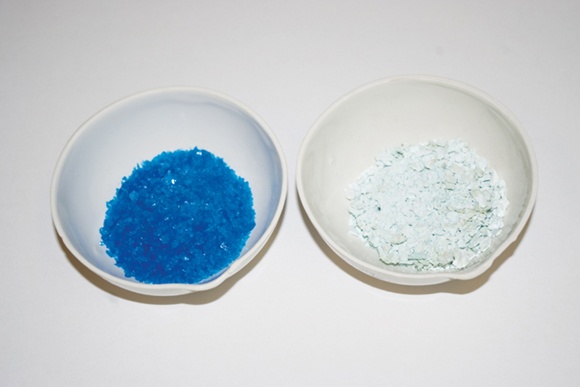
In this laboratory, we’ll heat hydrated copper sulfate to drive off the water of crystallization and use the mass differential to determine how many molecules of water are associated with each molecule of hydrated copper sulfate. We could have used any number of common hydrates, but we chose copper sulfate because the hydrated and anhydrous forms have distinctly different appearances. In hydrated form, copper sulfate forms brilliant blue crystals; in anhydrous form, copper sulfate is a white powder (see Figure 6-7).
Caution
This laboratory uses strong heat. Use extreme care with the heat source and hot objects. A hot crucible looks exactly like a cold crucible. Wear splash goggles, gloves, and protective clothing.
Disposal
Retain the anhydrous copper sulfate for use in later experiments. You can store it in a sealed bottle, or allow it to remain exposed to air until it rehydrates to form blue crystals.
Procedure
If you have not already done so, put on your splash goggles, gloves, and protective clothing.
Set up your ring stand, support ring, clay triangle, and burner. Heat the crucible and cover gently for a minute or two to vaporize any moisture.
Remove the heat and allow the crucible and cover to cool to room temperature, which may require 10 or 15 minutes.
Weigh the crucible and cover, and record their mass to 0.01 g on line A of Table 6-7.
Transfer about 5.0 g of copper sulfate pentahydrate to the crucible. (The copper sulfate pentahydrate should be in the form of fine crystals. If it is in the form of large lumps, use your mortar and pestle to crush it into finer crystals.)
Reweigh the crucible, cover, and contents and record the mass to 0.01 g on line B of Table 6-7. Subtract the mass of the empty crucible and lid from the mass of the crucible with the copper sulfate and record the initial mass of the copper sulfate pentahydrate on line C of Table 6-7.
Place the crucible and cover on the heat source and begin heating them gently. As the crucible warms up, increase the heat gradually until it is at its highest setting. Continue heating the crucible for at least 15 minutes.
Remove the heat and allow the crucible, cover, and contents to cool to room temperature, which may require 10 or 15 minutes.
After you are sure the crucible has cooled, reweigh crucible, lid, and contents. Record the mass to 0.01 g on line D of Table 6-7. Subtract the initial mass of the crucible and lid (line A) from this value, and record the mass of the anhydrous copper sulfate to 0.01 g on line E of Table 6-7. Subtract the mass of the anhydrous copper sulfate (line E) from the mass of the copper sulfate pentahydrate (line C), and record the mass loss to 0.01 g on line F of Table 6-7.
Item | Data |
A. Mass of crucible and cover | _______.____ g |
B. Initial mass (crucible, cover, and hydrate salt) | _______.____ g |
C. Mass of hydrate salt (B – A) | _______.____ g |
D. Final mass (crucible, cover, and anhydrous salt) | _______.____ g |
E. Mass of anhydrous salt (D – A) | _______.____ g |
F. Mass loss (C – E) | _______.____ g |
Review Questions
Q: | Q1: How does anhydrous copper sulfate differ in appearance from hydrated copper sulfate? __________________________________________________________________________________________ __________________________________________________________________________________________ __________________________________________________________________________________________ |
Q: | Q2: The formula weight of hydrated copper sulfate is 249.7 grams per mole (g/mol). How many moles of hydrated copper sulfate were present in your sample (line C of Table 6-7)? __________________________________________________________________________________________ __________________________________________________________________________________________ __________________________________________________________________________________________ __________________________________________________________________________________________ |
Q: | Q3: The formula weight of anhydrous copper sulfate is 159.6 g/mol. How many moles of anhydrous copper sulfate were present in your sample (line E of Table 6-7)? __________________________________________________________________________________________ __________________________________________________________________________________________ __________________________________________________________________________________________ __________________________________________________________________________________________ |
Q: | Q4: Would you expect the number of moles of hydrated copper sulfate and the number of moles of anhydrous copper sulfate to be the same? Why or why not? __________________________________________________________________________________________ __________________________________________________________________________________________ __________________________________________________________________________________________ __________________________________________________________________________________________ |
Q: | Q5: Assuming that all of the mass loss (line F of Table 6-7) represented water of crystallization, how many moles of water are present in hydrated copper sulfate for each mole of copper sulfate? (Hint: the formula weight of water is 18.015 g/mol. Divide the mass loss by the formula weight of water to calculate the number of moles of water present in the hydrated sample. Divide that number by the number of moles of copper sulfate to determine the proportion of water molecules to copper sulfate molecules and round the result to the nearest whole number.) __________________________________________________________________________________________ __________________________________________________________________________________________ __________________________________________________________________________________________ __________________________________________________________________________________________ |
Q: | Q6: How closely did your experimental results correspond to the actual value of five molecules of water per molecule of copper sulfate? Propose several explanations for any variation. __________________________________________________________________________________________ __________________________________________________________________________________________ __________________________________________________________________________________________ __________________________________________________________________________________________ __________________________________________________________________________________________ __________________________________________________________________________________________ __________________________________________________________________________________________ __________________________________________________________________________________________ |
