21.5 Process Analysis
Using Transactions SM50 and SM66, we can check the work process overview. These transactions are generally used by system administrators. However, we can use these transactions to check the programs that are currently running, and if our program is running for a long time, then we can check what step of the program is taking the most time. This information helps us identify which part of the program should be analyzed further. These transactions also help to check programs that run in background mode.
Figure 21.9 shows the Work Process Overview screen (Transaction SM50). Work processes will have statuses such as the following:
-
Waiting
When the work process has a Waiting status, it means it’s freely available to take a request. -
Running
If the work process has a Running status, it means the work process is currently busy processing a request. -
On Hold
The On Hold status signifies that the work process is waiting for some response, such as the release of a resource or a response from an RFC call. If the program is opened in debug mode, the corresponding work process that’s processing the request will have a Hold status. The column next to the Status column displays the reason for the hold. (F1) helps provide information about all the possible reasons for a Hold status. -
Stopped
If the work process status shows a Stopped status, the work process was aborted and didn’t restart.
Figure 21.9 Work Process Overview
The Work Process Overview screen provides some important information, such as the time the program is taking to complete the current step, the current action being performed by the program, the status of the program, and any failures in program execution.
Note
If you don’t see all the columns in the overview screen, you can change the ALV layout via the menu path Settings • Layout • Current.
The information in the Current Action column helps identify if the program is stuck while performing any particular action, such as database actions like sequential READ, DIRECT READ, INSERT, UPDATE, DELETE, and so on. If the program is taking long to perform any of these actions, then the program can be analyzed further using a tool such as a SQL trace.
The Current Action column also shows different SAP system actions, such as LOAD REPORT, ROLL-IN, ROLL-OUT, and so on. These actions mean that the work process is occupied on the SAP system side and not related to our program performance. If the work process is spending lot of time performing these SAP system actions, then the system administrator should analyze them further, because these actions usually don’t take much time.
If the Current Actions column is empty, the program is processing ABAP code, such as LOOP statements or READ statements. You can check the CPU Time column to analyze the performance of these statements. If the program is taking too long with an empty Current Action column, then you can perform a more detailed analysis using the runtime analysis tool.
Transaction SM50 provides a local process overview of the current application server to which we’re logged in; Transaction SM66 instead provides a global process overview. In Transaction SM50, you can double-click any row to see more detailed statistics, such as memory statistics, database statistics, and so on, as shown in Figure 21.10
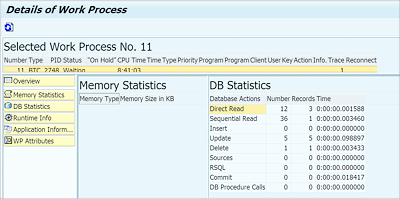
Figure 21.10 Detail Overview Screen
Process analysis can be used as a first step to identify a problem area and then used to continue the analysis in the corresponding area. For example, the Current Action column guides you in a particular direction to carry out further analysis using other tools. However, this tool is useful only if the program takes a long time to execute.