21.9 ABAP Trace/Runtime Analysis
ABAP Trace allows you to analyze the performance of your program in the application layer. It helps identify CPU-intensive modules and any unnecessary use of modularization. Whereas a SQL trace is used to analyze the performance of statements that interact with the database, the primary purpose of ABAP Trace is to analyze how CPU-intensive the program is in the application server.
ABAP Trace lets you quickly identify statements that are causing bottlenecks. For example, you can identify the statements that are called repeatedly or statements that are CPU-intensive. In this section, we’ll discuss the steps for running and analyzing ABAP Trace.
21.9.1 Running ABAP Trace
You run ABAP Trace using the Transaction SAT (previously Transaction SE30; Runtime Analysis). This tool has been available since SAP NetWeaver 7.0 EHP 2 and it provides many improvements over Transaction SE30. You can check out the release notes for the new tool by visiting http://help.sap.com/saphelp_nw74/helpdata/en/4e/e6b33b556444ccb3ca9fffef95d244/content.htm.
To run ABAP Trace, proceed with the following steps:
- Open Transaction SAT.
-
On the initial screen of the transaction, as shown in Figure 21.26, you can enter the Program name, Transaction, or Function Module to evaluate. The Eval. Immediately checkbox allows you to display the results immediately, whereas unchecking this checkbox will allow you to run consecutive tests.
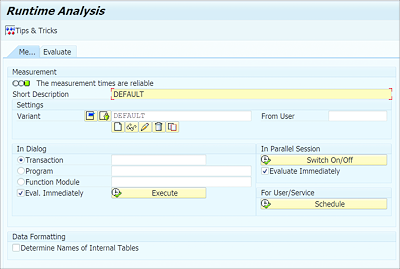
Figure 21.26 Runtime Analysis Initial Screen
-
The Measurement section shows a traffic light icon to indicate if the measurement runtimes are accurate based on the system configurations. When you open the transaction, the system loads a default variant. You can create your own variant for the test by clicking the Create icon under Variant. Creating your own variant allows you to tweak the settings.
For example, when performing an initial analysis, you may want to check aggregate runtimes to quickly identify the problem areas as opposed to individual calls to the statements. This is useful if any statements are called repetitively, such as calling a function module in a loop. For such situations, you can select the Per Call Position option under Aggregation while creating a variant, as shown in Figure 21.27. -
Once you provide the program name, transaction, or function module on the initial screen, click the Execute button to run the test in dialog mode. The system will call the program, which you can execute and perform any interactive actions.
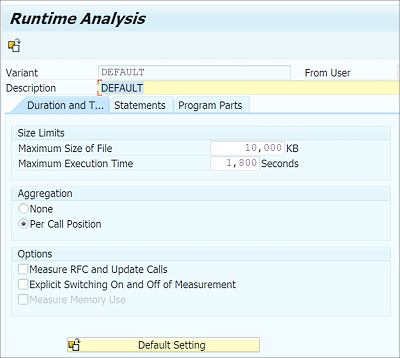
Figure 21.27 Create Variant
- Once the execution is over, click the Back or Exit button of the program to go back to the Transaction SAT screen. Based on whether you selected the Eval. Immediately checkbox, either the results are displayed automatically or you can continue to perform consecutive tests.
- Click the Evaluate tab to see the tests that were carried out and evaluate the same. The Tips & Tricks button in the toolbar provides some great examples of how to efficiently use various ABAP statements.
21.9.2 Analyzing the Results
The results screen, as shown in Figure 21.28, has multiple tabs that provide information for you to analyze. For example, you can check the runtime of various modularization units, the number of modularization units, and the percentage of time spent on each modularization unit.
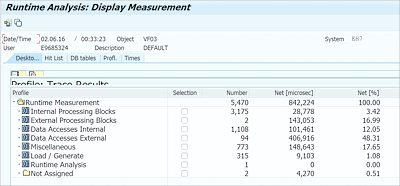
Figure 21.28 Results Screen
There are several tabs available on the results screen:
-
Desktop
The Desktop tab is default setup with Profile and Hit List views. It displays the information available separately in the Profile and Hit list tabs in a single view. -
Hit List
The Hit List tab, as shown in Figure 21.29, shows the Net [%] and Gross [%] times for each statement or event. The entries are sorted by the net runtime by default. This should help you to zero in on problematic areas of the code.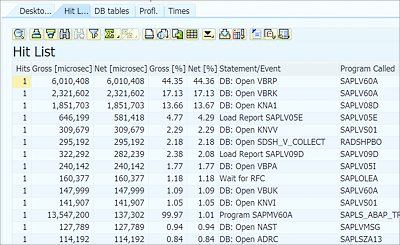
Figure 21.29 Hit List
When you double-click an entry in the Hit List tab, the system will open the statement belonging to the corresponding program in the appropriate ABAP Workbench tool. This helps you to check the actual statement in the program that corresponds to the entry. The value in the Hits column gives you insight into how many times a particular statement is being executed. -
DB Tables
The DB Tables tab shows information about the time spent on database access (see Figure 21.30). In this view, you can analyze different information about database access, such as the database tables or views that were accessed, the number of times each table or view is accessed, if a buffer is used, the type of buffer used, and the time spent on each table access.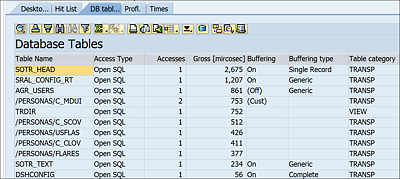
Figure 21.30 DB Tables View
-
Profl.
The Profl. (profile) tab allows you to look at the results in a different perspective. Here, you can see the details categorized by processing blocks. Click on the Other Hierarchy button in the toolbar (see Figure 21.31) to change to a different grouping, including Trace Results, Packages, Components, Programs, and SLAD Objects. This allows you to broadly identify which program’s or package’s statements are creating problems. -
Times
The Times tab provides information about the time spent for each statement or event (see Figure 21.32). In this view, you can check the time spent by the user and the system for each statement or event. This helps you analyze if performance issues are caused by the program or by the system.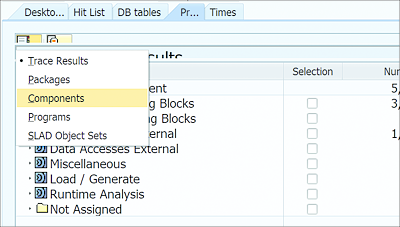
Figure 21.31 Profile View
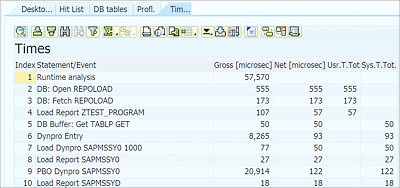
Figure 21.32 Times View