Chapter 3
Measurement and prediction
Tides, unusually for natural events, can be forecast with great accuracy for years in advance. The ability to do this and make people safer at sea is probably the greatest practical success story of the science of physical oceanography. There are two aspects of the problem to be considered: the rise and fall of the level of the sea, which we shall call the tide; and the horizontal flow of the water, called tidal streams or currents.
Measuring tides
The tide can be measured most simply with a vertical graduated staff called a tide pole. Tide poles have not been used in recent years as a serious source of tidal information, but they are interesting things to seek out. They can often be found near the entrance to a harbour where they are visible to shipping. To compare measurements of water level at different places it is necessary to agree where the zero of the tide pole should be placed. This zero level is called the datum and different ideas about where it should be prevail in different countries.
One option is to use the lowest level predicted for the tide at that place—the Lowest Astronomical Tide (LAT). This is the datum used for measuring depths on British Admiralty charts. In the United States, a datum which is the average height of high or low tides at a place is often used; mean water level is another option. Data can be converted from one form to another, but some knowledge of the local tide is needed to do this. For example, LAT will be half the maximum tidal range below mean sea level.
To make regular measurements of the full rise and fall of the tide for anything longer than a day or so, instruments equipped with a recording device are needed. An early form of tide gauge used a float on the water surface to drive, through a series of mechanical levers, a pen over a rotating roll of chart paper. The unwanted effect of waves on the record was eliminated by placing the float in a vertical cylinder called a stilling well. The top end of the well is open (and above sea level) and the bottom, underwater, end is closed apart from a small hole. Any difference in water level between the outside and inside of the well drives water through the hole, but it takes time for the two levels to become the same. This time, called the response time, varies inversely with the size of the hole. If the stilling well is correctly designed it will have a response time which is long compared to the period of waves but short compared to the period of the tide. Since waves have a period of a few seconds and tides have periods of several hours, a stilling well with a response time of a few minutes works well. The water level inside the well will follow the slow variations of the tide but will not be able to keep up with the more rapid variations in sea level caused by waves.
The principle of the stilling well applies on larger scales too. Apart from in a few special areas, the Mediterranean Sea of Europe has very small tides. It is connected to the Atlantic by the narrow and shallow Strait of Gibraltar. The Strait acts like the hole in the stilling well: the response time of the Mediterranean to fluctuations in Atlantic sea level is measured in months. Tides in the Atlantic move up and down too rapidly to affect the Mediterranean greatly and the tides in the Mediterranean are small.
The trend with modern coastal tide gauges is to avoid contact with seawater altogether so that corrosion is minimized. A popular form of tide gauge mounted on a pier, for example, bounces a short pulse of radio waves off the water surface and determines the distance between itself and the sea surface from the time taken for the wave pulse to make this short journey. For a gauge just a few metres above the sea surface the return time of the radio waves will be measured in nano-seconds, and it is only in recent years that instruments have been sufficiently precise to measure such small times. Sound waves may be used instead of radio, in which case it helps to have a vertical tube to confine the acoustic pulses.
The vertical tide can also be measured by the change in pressure that it causes at the seabed, or at some fixed height above the bed. Pressure gauges have the advantage that they can be deployed in the deep ocean. Changes in pressure are measured by a piezoelectric cell, which creates electric charges when it is squeezed. Pressure gauges are affected by changes in atmospheric pressure: a change in air pressure of 1 millibar is approximately equivalent to a change in water level of 1 centimetre and has to be allowed for. Some pressure gauges are able to measure atmospheric pressure as well as the water pressure, and so a correction can be made.
Measuring tidal currents
The measurement of tidal currents has always been a challenge. For a start, currents are vectors. Two numbers are needed to fully describe a current, for example speed and direction or components of the current in north–south and east–west directions. Second, tidal currents vary with depth. Third, all currents are inherently variable spatially, especially near the coast. Currents measured at one place are not necessarily a good guide even to the direction of the current a short distance away.
A traditional current meter is equipped with an impellor which turns in the flow and a compass to give the direction. The speed and direction of the flow can be recorded on a display and noted down, or stored electronically on a logger.
The instantaneous current at any place can be represented on a map by an arrow. The length of the arrow should be proportional to the speed of the current and it should be drawn to point in the direction of the flow. In the case of a tidal current which changes with time, the tip of the arrow will move around a curve over a tidal cycle. In offshore waters, this curve will often be, approximately at least, elliptical in shape, such as the one marked A in Figure 11. The current reaches a maximum speed when the arrow points along the semi-major axis of the ellipse and a minimum speed three lunar hours later when it points along the semi-minor axis: there is no actual time of zero current, just times of maximum and minimum flow. The sense in which the current vector turns within the ellipse can be either clockwise or anti-clockwise.
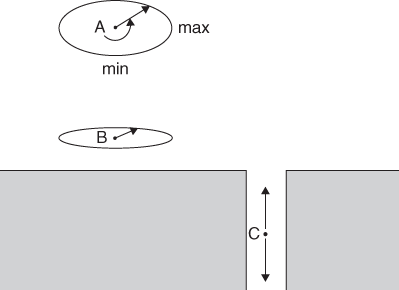
11. Tidal ellipses offshore (A and B) and rectilinear flow in an estuary (C).
As the coast is approached, the land inhibits the flow in a direction perpendicular to the shore and the ellipse becomes flattened (B in Figure 11). The same thing happens in a narrow channel, or estuary (C), and the current will flow in just two directions: either into the estuary (when it is known as the flood) or out (the ebb). Now there is a time (called slack water) when the current goes to zero, as it turns from flood to ebb and vice versa.
The vertical variation of the currents in an estuary can be measured by lowering a current meter to a series of depths below a moored boat, to obtain the profile of the current at regular intervals. An example is shown in Figure 12.
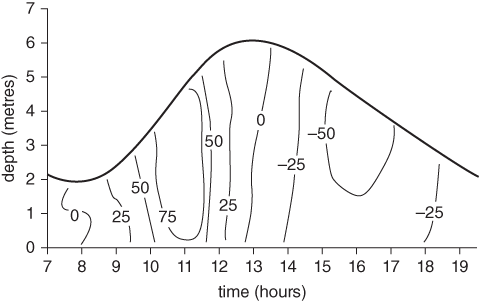
12. Currents in a tidal river. Contours show speed in centimetres per second and the dark line shows the height of the water surface above the bed. Positive values mean that the current is flooding.
This picture shows two of the characteristic features of tides in estuaries. The surface rises more quickly than it falls and the flood currents are faster than those of the ebb. The relatively fast rising tide is a consequence of the dynamics of flow in shallow water, which we shall return to in Chapter 4; we can note here that the faster flood currents are important for sediment transport. More sand and mud is carried into the estuary by the flood tide than is removed by the ebb. Estuaries that are important shipping channels need to be constantly dredged to remove the sediment brought in by the tide.
The vertical variation of tidal currents can also be measured by an Acoustic Doppler Current Profiler (ADCP). This instrument sends ‘pings’ of sound into the flow. Some of the sound will bounce off particles in the water and travel back to be received by sensors on the ADCP. The time delay between the transmitted ping and the echo gives the distance from which the echo has come. If there is a current, there will be a change in the frequency of the echo (a Doppler shift) and this can be used to work out the speed of the flow. The acoustic pings are transmitted at an angle to the vertical so that they provide information on the horizontal flows. An ADCP can measure the vertical profile of the current more frequently and at a higher vertical resolution than conventional current meters.
Measurements of a current flowing past a fixed point are called Eulerian (after Swiss mathematician Leonhard Euler (1707−83)). A completely different way to measure currents is to deploy a tracked drifter that moves with the flow. Such methods are called Lagrangian, after Italian mathematician and astronomer Joseph-Louis Lagrange (1736−1813). In one common configuration a surface float equipped with a radio transmitter is attached to a sub-surface drogue. The drogue is designed to catch the flow: a sail or a parachute, for example, works well. The current drags the drogue along and the position of the drifter can be tracked from the radio transmissions of the surface buoy.
For users of British Admiralty charts, tidal diamonds are a familiar source of tidal stream information. A point on the chart at which the currents have been measured is identified by a diamond shape, containing a letter. On the edge of the chart, hourly values of the tidal stream speed and direction at spring and neap tides are tabulated. The time of each measurement is expressed relative to the time of high water at a standard port.
The information needed to make these tables has been gathered over many years. Today the streams are measured by a vessel- or seabed-mounted ADCP. Traditionally, however, the currents were measured by tracking a spar buoy (called a pole logship by surveyors) and the results processed graphically. A spar buoy is a buoyant vertical pole or tube weighted at the bottom so that its upper end just shows above the water surface. The buoy follows the current averaged over its vertical length. It is tracked by a survey vessel (the ‘logship’) and its position recorded every half hour over a period of either twenty-five or fifty hours. The difference in position of a consecutive pair of measurements gives the speed and direction of the flow.
Historically, the observations were processed manually by plotting them on a polar diagram; that is a piece of paper with equally spaced concentric circles representing flow speed and radial lines marked in degrees for direction of flow. A measurement of speed and direction from the spar buoy plots as a point on this diagram. As more data points are added they form the outline of a tidal current ellipse. The analyst would draw a best-fit curve through these points by eye, averaging out variations between tidal cycles and identifying any ‘outlier’ observations which may have been adversely affected by wind.
The ellipse is annotated with the time in hours before and after high water at a nearby port. A line drawn from the centre of the polar diagram to each of these hour marks gave the flow speed and direction at that time. The speed is adjusted to give the expected value at mean spring and neap tides. If there is a significant non-tidal flow, the ellipse will be displaced from the centre of the polar diagram. This could be allowed for (and the effect of the residual flow removed) by marking a new central point in the middle of the ellipse.
New methods of measuring currents continue to be developed. A recent innovation is to use records from tagged seabirds resting on the water. Birds are routinely tagged with small global positioning system (GPS) loggers to study their behaviour. When seabirds rest on the water (usually at night), they become unwitting recorders of the current (Figure 13).
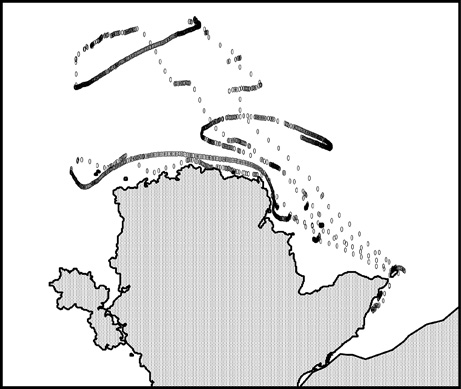
13. Motion of a tagged seabird near Anglesey in Wales. When the bird is flying, the recorded positions are well-spaced but when the bird rests on the water and consecutive positions are close together the points trace out a dark track which shows the tidal current.
Analysing tidal data
The standard method of analysing tides and tidal currents is a curve-fitting procedure known as harmonic analysis. In the case of tide height, for example, a record of water levels at one place over a period of time is represented by the sum of a number of pure cosine waves, called tidal harmonics (Figure 14). The period (the time between one crest and the next) of each harmonic is set by the motion of the Earth, Moon, and Sun, and is the same for all places. The amplitude and phase vary from place to place and are determined by matching the fitted curves to observations.
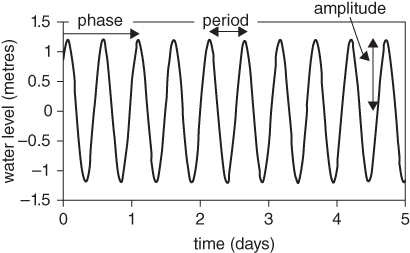
14. A tidal harmonic can be specified exactly by three numbers: amplitude (which controls the height), period (which sets the time interval between high tides), and phase (the time of a high tide relative to a standard time). Once these numbers have been determined, a harmonic can be projected into the future and added to other harmonics to predict the tide.
The most important harmonic is that which would be produced by an idealized Moon in a circular orbit in the plane of the Earth’s equator. This harmonic has a period of exactly twelve hours and twenty-five minutes (or 12.42 hours) and is given the symbol M2 (M stands for Moon; and the subscript 2 refers to the fact that this harmonic has two cycles per day). An idealized Sun, at a fixed distance from Earth and lying in the plane of the equator, produces a harmonic with a period of exactly 12.00 hours which is called S2.
Adding M2 and S2 harmonics together creates a semi-diurnal tide whose amplitude changes over a fortnightly cycle. At spring tides, the two harmonics are in phase and their amplitudes add. At neap tides, they are out of phase and the resultant tide is the difference between the amplitudes of M2 and S2. The relatively slow change in amplitude of a signal created by two harmonics close in frequency is called ‘beating’. Beating of sound waves can be heard when musicians tune up: two instruments not quite producing the same note create a sound which beats, or fluctuates in volume. Adding M2 and S2 harmonics produces a beating of amplitude with period 14.8 days, the period of the spring–neap cycle.
Harmonics with periods of about a day are needed to create the diurnal tides. The two most important of these are called K1 (with period 23.93 hours) and O1 (period 25.82 hours). These harmonics have been created just so that, when added together, they beat to produce a semi-monthly variation in the amplitude of the diurnal tide.
There are many other harmonics that can be included to create an increasingly accurate representation of the tide, but we will mention here just one more. The N2 tidal constituent has a period of 12.66 hours. Combined with M2 it produces beating with period 27.55 days which is the interval between times of lunar perigee—when the Moon, in its elliptical orbit, gets closest to the Earth.
Let’s see how well we can predict the tide at Juneau, Alaska, starting with the observations shown in Chapter 1; the technique can equally well be applied to any location where observations of sea level are available. Of course, the tide at Juneau has already been analysed by the operators of the gauge, NOAA, and so we know what the right answer is. NOAA use thirty-seven harmonics in their analysis, but we will restrict ourselves to just five to keep the maths relatively simple. The amplitude and phase of these five harmonics, as published by NOAA on their website, are shown in Table 1. These are known as the tidal constants for the port.
Table 1. Tidal constants for Juneau, Alaska
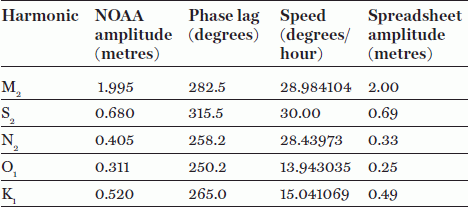
The speed shown in this table is the word used in tidal analysis for the angular frequency of the harmonic. For example, the M2 harmonic completes a full cycle (of 360 degrees) in 12.42 hours and so its speed is 360/12.42 = 28.98 degrees per hour. The phase lag is, by tradition, the time difference between high water in the harmonic and the time at which high water in that harmonic would occur in the equilibrium tide at Greenwich in England. For example, high water in the equilibrium M2 harmonic at Greenwich occurs when the Moon crosses the meridian at Greenwich. At Juneau, high water in this same harmonic occurs 9.75 hours (282.5° divided by 28.98°/hour) after the Moon crosses the Greenwich meridian.
We can learn some useful facts just by visual inspection of the sea-level record shown in Chapter 1. The tidal range at spring tides is about 5.5 metres and at neaps it is about 2.5 metres. If the M2 and S2 harmonics were the only ones that mattered, we would expect the sum of their amplitudes to be half the spring range, or 2.75 metres, and the difference between their amplitudes to be half the neap range, 1.25 metres. This gives us two simultaneous equations for the amplitudes of M2 and S2 which can be solved to give 2 metres and 0.75 metres respectively—not so far off the values in Table 1.
Programs to perform tidal analysis can be obtained from international tidal authorities; some programs can be downloaded for free from the internet, but it is never clear how reliable they are. It is also possible to learn the principles of the job in a spreadsheet that can perform a multiple regression. The dependent variable is the observed sea level and the independent variables are the harmonics whose amplitudes and phases we wish to determine. The spreadsheet is set up with time in column 1 and the observations of sea level in column 2 (hourly observations are fine). Subsequent columns are filled with sine and cosine terms having the frequency of a chosen harmonic and with unit amplitude. Performing a multiple regression then returns the amplitudes which give the best fit to the observations when summed. The sine and cosine terms could be combined into a single cosine harmonic with a phase lag using a trigonometric relationship, but this is not necessary in order to plot out the predicted tide.
The harmonic amplitudes from the spreadsheet analysis of the Juneau data are shown in Table 1. There are differences from the NOAA estimates but these are explained by the relatively short record of thirty days that we used for the analysis and the fact that we left out many of the harmonics included by NOAA.
The five harmonics add to make a good fit to the observed tide at Juneau as you can see in Figure 15. To make a prediction of the tide, we then choose a day in the future, calculate the time difference between the start of that day and the start of our record, and work out the values of the harmonics over the twenty-four hours of that day. The harmonics can be summed to give the predicted tidal curve. If the prediction is to be made a long time after the observations, it is important to specify the speed of the harmonics as precisely as possible.
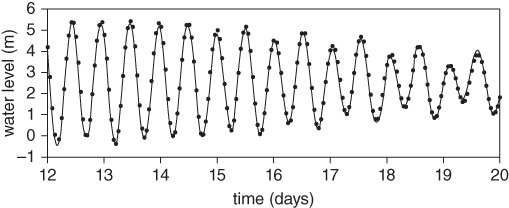
15. Hourly observations of water level at Juneau (points) and the curve fitted by multiple regression on five harmonics.
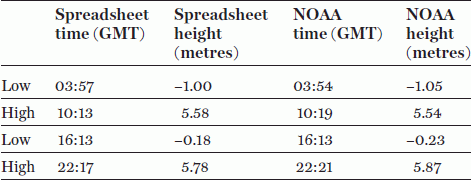
We compare our prediction of the tide with the NOAA predictions exactly one year after the beginning of the observations—2nd March 2018 in Table 2. The method gets the heights of the tide correct to within 10 centimetres and the times to within six minutes. That wouldn’t be good enough to set up in business but it does show that we understand how the business is carried out.
Table 2. Predicted tide at Juneau for 2nd March 2018
In principle, the more harmonics that are added to the tidal analysis, the more exact will be the fit to the observations. There is, however, a limit to the number of harmonics that are meaningful. For a tidal analysis to be able to separate the amplitudes of two harmonics of frequencies f1 and f2 we need a record length at least equal to 1/(f1–f2). To resolve harmonics that are closer together in frequency requires a long record. No professional analysis would be carried out with a record as short as a month: twelve months would be a minimum requirement.
Harmonic analysis of observations and the prediction of tides are now routinely carried out by computer programs, but before computers were widely available, other methods were used. Clever ways were devised to analyse tidal records by hand to derive the tidal constants.
The principle of these methods was to divide a record into segments containing a (small) whole number of cycles of a single harmonic. Within each segment, the high and low tides of the selected harmonic would always appear in the same places, but this would not be so of other harmonics. When a large number of segments were averaged, the signal of the chosen harmonic would reinforce itself and the other harmonics would cancel out.
The method is most easily illustrated for S2 which has a period of 12.00 hours. The tidal height at 00 hours each day is averaged over all 24-hour segments of data (and also at 01 hours, 02 hours, and so on, up to 24 hours if we choose to consider two complete cycles of S2 at a time). As the number of days of observation increases, the pure S2 harmonic appears. Figure 16 shows the results of this averaging procedure applied to Juneau. The amplitude of the S2 tide that emerges is 0.74 metres and the phase is such that high tide in the S2 harmonic occurs at 10.30 (am and pm) Greenwich Mean Time (GMT). The amplitude is a little larger than that given by NOAA but the phase is exactly right (since from Table 1, for S2, dividing the phase lag of 315.5 degrees by a speed of 30 degrees per hour gives the time of high tide as 10.5 hours GMT).
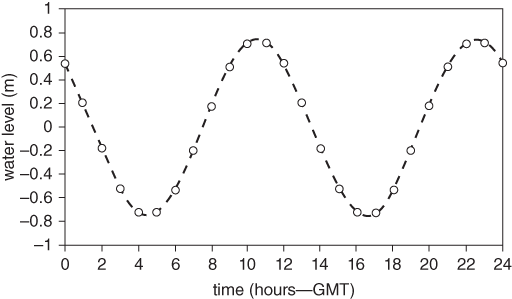
16. The S2 harmonic at Juneau, Alaska. The points show average elevations at hourly intervals during the day calculated using many 24-hour segments of data (see text). The dashed curve is a cosine curve fitted to the points.
In pre-computer days, once the harmonics for a particular port had been determined, the tide would be predicted using a machine. These tide-predicting machines, often made of brass and mahogany, were beautiful examples of scientific instrument making. The original machines were designed by William Thomson (Lord Kelvin), and by the 1930s all of the major sea-going countries had their own machines. Many have been preserved in maritime museums around the world and are worth looking out for (see Figure 17).
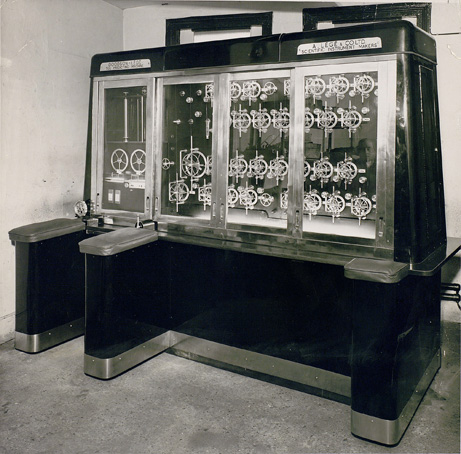
17. A tide-predicting machine designed by Arthur Doodson in the late 1940s and now on display at the National Oceanography Centre, Liverpool.
The principle of operation is illustrated in Figure 18. Each of the tidal harmonics used in the prediction is represented by a wheel which turns at a speed proportional to the angular frequency of the harmonic (this may well have been how the word speed came to be used for frequency in tidal work). For example, the wheel representing the S2 harmonic turns once as the chart paper advances the equivalent of twelve hours. The motion of the wheel is transferred to the pen through a piston driven by a simple cam mechanism. The position of the pin which drives this cam is set to represent the amplitude and phase lag of the harmonic at the chosen port. In Figure 18 we illustrate the procedure with just two harmonics: M2 and S2; more wheels are added to represent further harmonics.
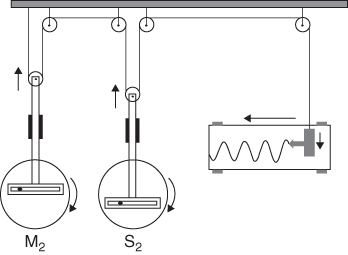
18. Principle of operation of a tide-predicting machine, illustrated with two harmonics.