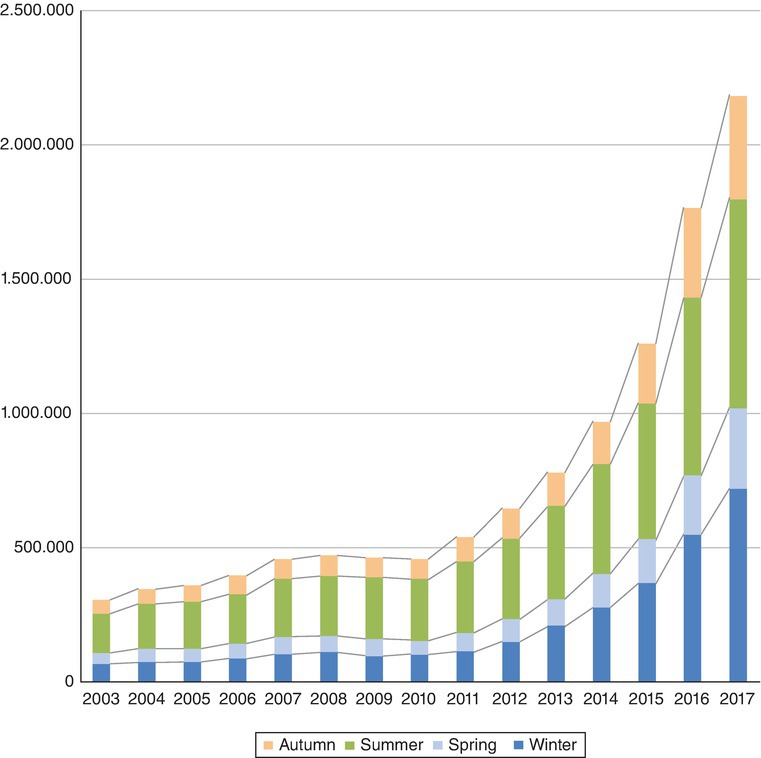
Fig. 18.1. Number of international visitors to Iceland. (Analysed from Icelandic Tourist Board, 2018.)
18 Winter Visitors’ Perceptions in Popular Nature Destinations in Iceland
1University of Iceland, Reykjavík, Iceland; 2University of Canterbury, New Zealand
*E-mail: annadora@hi.is
By virtue of its name, Iceland, located just south of the Arctic Circle in the North Atlantic, does not immediately conjure up an image of an attractive tourist winter destination. However, although not having the friendliest climate in the world because of its variability, the climate is actually more temperate than what many might expect for its location – and name – thanks to the warming influence of the Gulf Stream and the Irminger Current (Einarsson, 1984; Ingólfsson, 2008).
Being surrounded by the ocean, summers on the island are cool and the winters relatively mild for its latitude. In the southern part of the country the average temperature in July, is about 10–13°C (50–55°F), although summer days can reach 20–25°C (68–77°F), and about around 0°C (32°F) in winter, while the north is a little cooler. The Highlands of Iceland tend to average around −10°C (14°F) in winter (Einarsson, 1984; Ingólfsson, 2008). According to the Köppen climate classification the climate along the southern coast, along with some coastal valleys in the north, is mainly subarctic while the rest of the country is regarded as tundra. Nevertheless, while the country’s name may imply to many people that it is covered in ice, many of the coastal regions are covered in grasslands, and trees grow in some areas that have not been overgrazed. Only about 11% of the country is ice-covered year-round and these are glaciers and ice caps, which also serve as significant tourist attractions (Welling and Árnason, 2016). The largest of which by far is Vatnajökull, covering an area of approximately 8300 km2, and which is also one of the coldest areas on the island. However, Iceland’s glaciers are increasingly affected by climate change and are in retreat, which will affect the glacier tourism industry in the near future (Welling et al., 2017).
Iceland has continuous daylight during the high summer and the midnight sun can be experienced on the island of Grimsey off the north coast through which the Arctic Circle currently passes. In contrast, the shortest days in winter only have 5–6 hours of daylight. From autumn through to spring the darker evenings have made the northern lights an important feature of the island’s tourist offerings. Sea temperatures can rise to over 10°C at the south and west coasts of Iceland during the summer, and slightly over +8°C at the north coast, but summer sea temperatures remain below +8°C on the east coast (Einarsson, 1984; Ingólfsson, 2008). It should be noted that Iceland has a nascent surfing community with the period between October and March when heavy storms hit the island being regarded as having the best wave conditions (Ólafsson, 2018). The island is generally wet and windy, with May, June and July being the three driest months, and October and March the wettest. The mean precipitation for Reykjavík by month ranges from means of approximately 43.8 mm and 9.8 precipitation days in May through to 85.6 mm and 14.5 precipitation days in October (Ingólfsson, 2008). However, there is substantial variation in precipitation over the island with it ranging from a high of >4000 mm a year in the south-west of Iceland over Vatnajökull as well as other higher areas to lows of <600 mm in some of the northern and central regions (Icelandic Met Office, 2018). This is because the large low pressure cyclonic events come from the south-west travelling just south of the country, meaning that the dominant wind direction is easterly. Most importantly from a weather experience perspective, the conditions are extremely variable and can fluctuate from calm and beautiful sunny weather to extreme conditions within a few hours, which provides an important dimension for outdoor recreation and tourism activity.
Mainly due to its particular climatic conditions, tourism in Iceland has been very seasonal with, historically, over half of international visitors arriving in the three summer months (June, July and August). Consequently, the principal aim of Icelandic tourism policy ever since the inception of the first national tourism policy in Iceland in 1975 has been to minimize seasonal fluctuations in international visitor arrivals (Pham et al., 1975). However, success in shifting seasonality was limited until after the global financial crisis in 2007–10, when there was a huge increase in international visitors arriving in the off-season, so much so that it can barely be called the off-season anymore. Significantly, these changes were due not so much to developments in Iceland’s urban tourism offerings, but to the growing attraction of the Icelandic environment as an all-season attraction.
Nature is the main reason international tourists visit Iceland. The most popular nature destinations are within a daytrip from Reykjavík and there are some destinations that are visited by a great many tourists leading to increased concerns over tourism growth for both the environment and the quality of the visitor experience. Negative experience of crowding has long been recognized as a consequence of visitor satisfaction and the quality of the visitor experience (Stewart and Cole, 2001; Simón et al., 2004). However, research regarding attitudes and satisfaction of travellers due to seasonality in natural areas is limited (Koenig‐Lewis and Bischoff, 2005; Palang et al., 2007; Hall et al., 2011). Various studies conducted among summer visitors in the Icelandic Highlands indicate that some destinations already show indications that crowding is a problem (Sæþórsdóttir, 2013; Sæþórsdóttir and Ólafsdóttir, 2017). As winter used to be the low season in tourism in Iceland the increased winter tourism in Iceland raises fundamental questions with respect to how tourists perceive nature destinations in the winter.
This chapter provides an examination of tourist perception of crowding and satisfaction in seven popular nature destinations in the south and south-west of Iceland. The chapter concludes with a discussion regarding the future of winter tourism in Iceland.
Iceland has been among the countries in the world with the fastest growth in international tourist arrivals for the past few years, with an annual average increase of about 26% for the period 2010–2017. A two-fold increase in arrivals took place between 2014 and 2017; in 2014 the number of international visitors to Iceland was approximately 1.4 million, while in 2017 it reached approximately 2.2 million. The 2017 arrivals figure is almost seven times the number of residents in Iceland. Significantly, while growth has occurred over all seasons, the greatest growth has been in the winter months (November, December, January, February and March) with an average annual increase of 33% in arrivals (Icelandic Tourist Board, 2018) (see Fig. 18.1).

Fig. 18.1. Number of international visitors to Iceland. (Analysed from Icelandic Tourist Board, 2018.)
The largest increases in monthly visits have taken place outside of the summer months (see Fig. 18.2). For instance, between 2016 and 2017 there was a 75% increase in visitors in January and 62% in April, compared with a 17% increase in the summer months. Only about 4% of international visitors came in January in 2010, with around 20% coming in August. Seasonal changes in arrivals and overall growth meant that by 2017 in terms of the pattern of seasonal visitation about 6% came in January and 13% in August (Icelandic Tourist Board, 2018).
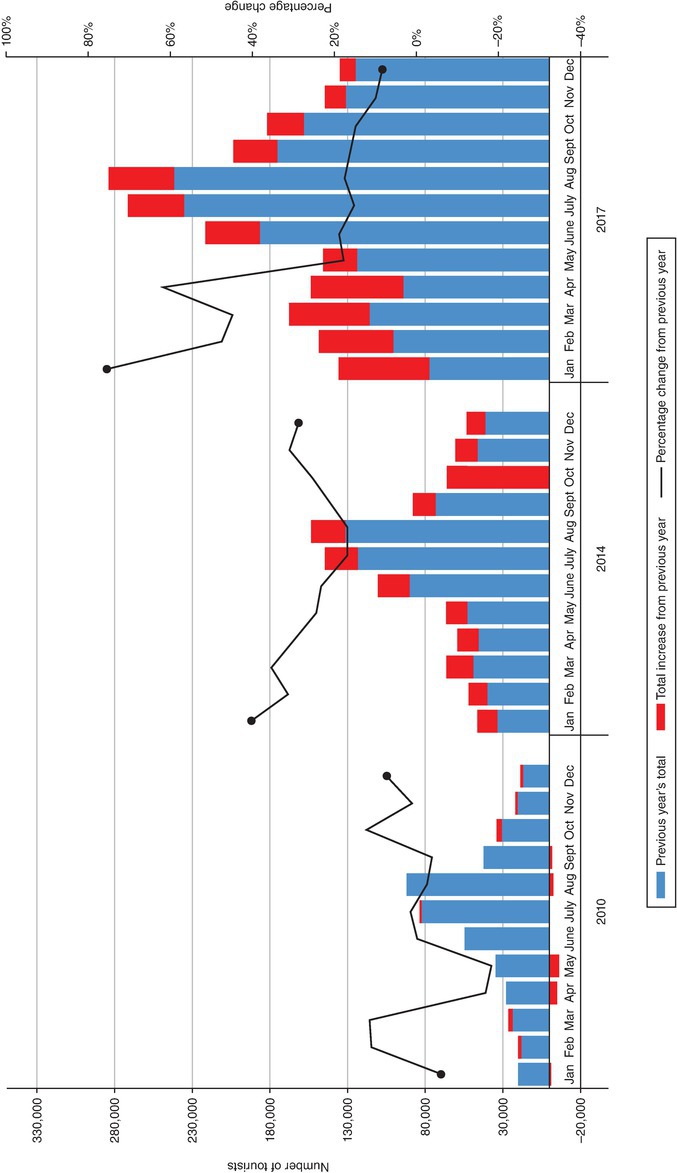
Fig. 18.2. Seasonal changes in international visitor arrivals 2010, 2014 and 2017. (Analysed from Icelandic Tourist Board, 2018.)
There are also significant differences in the nature of the tourist market by season. Visitors from the USA are by far the largest market in summer. However, about 28% of visitors in January 2017 were from the UK. Travellers from Central and South Europe were prominent during the summer months, while travellers from the Nordic countries, Canada and from countries categorized as ‘elsewhere’ were distributed more evenly over the year. In 2016, 53% of Central and Southern European visitors came during the summer, as did 42% of North American visitors, 38% of Nordic visitors, 16% of UK visitors and 35% of those categorized as from ‘elsewhere’. Travellers from the UK clearly had the greatest seasonal variance in visitation by season, as around half of these visitors came during the winter months. Some 40% of Nordic visitors came in the spring or autumn, as did 28% of UK visitors and 23% of North American visitors (Icelandic Tourist Board, 2018).
At the national level on average international visitors in winter have substantially shorter stays (4.16 nights) than summer visitors (10.33 nights) (Icelandic Tourist Board, 2016). In winter the roads outside the capital are frequently covered by snow or ice, hindering many travellers’ capacity to self-drive. Nevertheless, some of them still do while other choose bus transfers or tour companies. As a result of more limited time budgets and the travel conditions, the overnight stays of winter tourists are more concentrated in Reykjavík than other parts of the country compared with the summer months when overnight stays are more evenly distributed throughout the country. However, the geographical location of Keflavík, Iceland’s main international airport, on the Reykjanes peninsula in the south-west corner of the country and approximately a 40-min drive to Reykjavík’s city centre, has a tremendous year-round effect on seasonality. Close to 99% of all visitors to Iceland arrive through Keflavík airport and hence an overwhelming majority, or 97%, visit the capital area (Icelandic Tourist Board, 2016). In 2010 about 50% of overnight stays in Reykjavík and the surrounding municipalities took place between May and August, while other regions received 87% of their total overnight stays within the same period. Six years later there had been a somewhat positive trend in reducing the peaks of overnight seasonality, with 39% of total overnight stays in the capital area being between May and August and 65% in other regions. Nevertheless, concentrations in overnight stays in Iceland have been diminishing at a far lower rate outside of the capital area (see Fig. 18.3). Accordingly, the great increase in international visitors in the off-season has not benefited all areas equally and those at the greatest distance from the south-west gateway corner still suffer considerable seasonality (Statistics Iceland, 2018). However, such a situation with respect to the spatial intensity of tourism around Keflavík and Reykjavík is similar to that of other high-latitude gateway cities with short visitor stays (Hall, 2015).
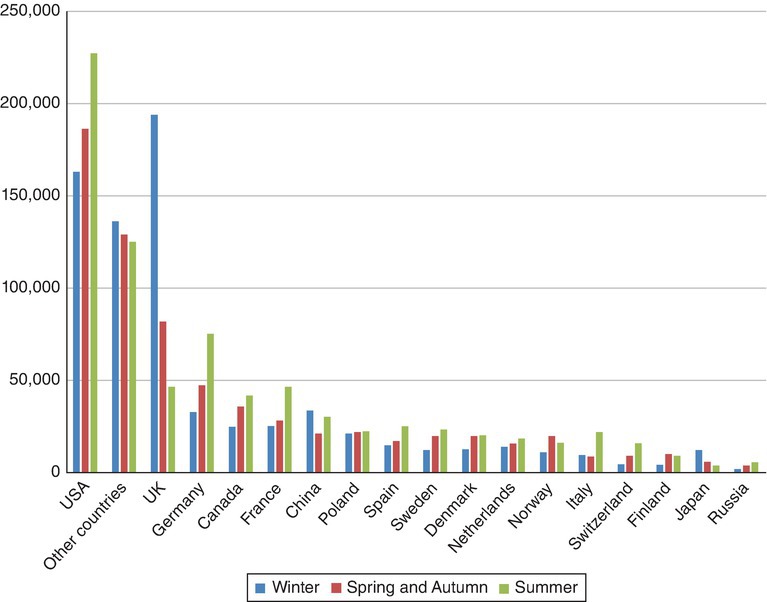
Fig. 18.3. Nationality of visitors to Iceland by seasons. (Analysed from Icelandic Tourist Board, 2018.)
The occupancy rate of hotels has increased in accordance with higher numbers of visitors to the country. As an example, the total occupancy rate in January has increased from 25% in 2010 to 62% in 2017. In January, the capital region occupancy rate has grown from 34% in 2010 to 83% in 2017 (see Fig. 18.4). The south-west, the area where the international airport is located, has also had a huge growth in its occupancy rate and has an occupancy rate of over 78% at this time of year. The occupancy rate in the south has also increased and was 45% in January 2017. As may be expected given the spatial distribution of tourists with restricted time budgets the east and the north of Iceland, the areas furthest from the capital region, continue to have their lowest occupancy rates in January, about 10% and 17% respectively, although even these figures represent increases since 2010. However, the change in the occupancy rate in the summer has not altered much. In August all regions had an occupancy rate of around or over 80% in 2017, although growth from 2010 to 2017 has been greatest in the capital region and in the south-west, where there has been an increase from 78% to 89% and 66% to 78% occupancy, respectively (Statistics Iceland, 2018).

Fig. 18.4. Occupancy rate in January and August in 2010 and 2017. (Analysed from Statistics Iceland, 2018.)
Icelandic nature is by far the most important attraction for international visitors. According to research by the Icelandic Tourist Board (2016), 74% of visitors in the winter and 83% in the summer, rate nature as the most important factor behind their decision to visit the country. However, this figure suggests that a substantial shift in visitor motivations has occurred within a 20-year period. For example, in 1998/99 only 47% of international tourists arriving in winter stated that nature was the principal reason for their visit. Significantly, over the same period, the figures have barely changed for summer tourists (Icelandic Tourist Board, 2004).
The vast majority of all international visitors visit Reykjavík, the capital city of Iceland. The south coast is visited by over 70% in the summer and 55% in winter but other areas are visited far less in winter (see Fig. 18.5). With respect to specific destinations, 48% of all international visitors in winter visited the hot spring area of Geysir, 41% Þingvellir national park and 31% Jökulsárlón glacial lagoon (Icelandic Tourist Board, 2016).
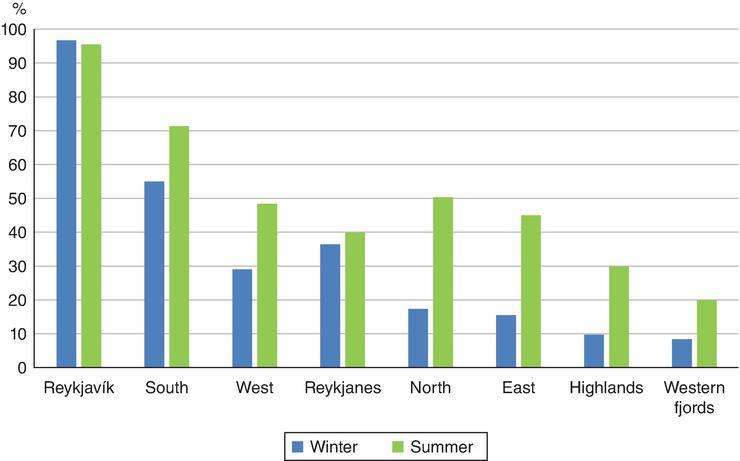
Fig. 18.5. Areas visited by international visitors while in Iceland. (Analysed from Icelandic Tourist Board, 2016.)
Given this situation it therefore becomes important for research to better understand the perceptions and attitudes of tourists to Iceland with respect to the natural environment, especially given the substantial increase in tourist arrivals overall and the growth of visitation to natural areas at times of the year where anthropogenic pressures have historically been much lower.
The massive and exponential surge in international visitors to Iceland resulted in interest from the Icelandic Tourist Board in financing a questionnaire survey on the experiences of tourists at popular nature tourist destinations. The study was conducted in the summer of 2014 and winter of 2015 but in this chapter the focus is on the winter results. Seven popular nature-based tourism destinations (Icelandic Tourist Board, 2014) in the south and south-west of Iceland were selected for study (see Fig. 18.6):
• Geysir – a geothermal area in the south-west.
• Þingvellir – a United Nations Educational, Scientific and Cultural Organization (UNESCO) World Heritage site in the south-west and a national park.
• Jökulsárlón – a large proglacial lake on the edge of Vatnajökull National Park in the south-east.
• Djúpalónssandur – a beach in the Snæfellsnes peninsula in Snæfellsjökull National Park.
• Hraunfossar – waterfalls in the Reykholt area.
• Seltún – geothermal area in the vicinity of the Blue Lagoon, Keflavík and the Reykjanes peninsula.
• Sólheimajökull – an accessible glacier in the south.
The research areas all form a part of popular day tours from the capital area and are among the most visited tourist destinations in Iceland, although Djúpalónssandur and Jökulsárlón (379 km distance from Reykjavík) are mostly a part of overnight tours in the winter.
The research locations’ infrastructure is quite dissimilar although all the areas, except Sólheimajökull, are protected areas of various kinds. There is also a lack of coherence between the nature of the infrastructure and the amount of visitation each site receives. For instance, the infrastructure at Jökulsárlón, in spite of being among the most visited nature tourist destinations in Iceland, is rather rudimentary and minimal, while the Geysir area contains various restaurant and accommodation options. The infrastructure at Þingvellir has also developed in recent years although aesthetic issues created by the facilities are relatively contained since they are placed at the national park’s entrance making them hardly visible from most of its area. There is very limited service at the other four locations. All have restroom services though some lack these year-round. There are small cafés at Hraunfossar and Seltún in summer but these are closed in winter.
Data were collected by one to five interviewers, depending on the amount of traffic each site receives, who attempted to approach as many visitors as possible. Data were gathered at each destination for a week, and a self-completion survey was given out during the day between approximately 9/10 am and 5/7 pm. The questionnaires were available in English, German, French and Icelandic. A total of 6758 questionnaires were collected at the seven destinations in the winter, with the smallest sample of 132 and largest of 2421 (see Table 18.1).
Table 18.1. Dates of data collection, sample size and response rate.
| Research areas | Data collection | Sample size (n) |
| Djúpalónssandur | 2–8 March | 132 |
| Geysir | 2–8 Feb | 2421 |
| Hraunfossar | 17–23 March | 360 |
| Jökulsárlón | 23 Feb – 1 Mar | 474 |
| Seltún | 17–24 March | 529 |
| Sólheimajökull | 17–23 Feb | 921 |
| Þingvellir | 9–15 Feb | 1921 |
| Total | 6758 |
The questionnaire contained about 30 questions with some sub-questions. Respondents typically completed the questionnaire in <20 min. The questions can be divided into three categories:
1. Participant background questions. Regarding age, nationality, gender, travel companions, and other socio-demographic information.
2. Activities/behaviour/preferences. Previous visits, visit duration, mode of travel, accommodation type, activities in the research area, travel time, time spent on site, duration of hiking and recreational use patterns.
3. Attitude/experience/catalyst. Thoughts on the destination’s attractiveness, naturalness and facilities, attitude and expectations on visitor and vehicle numbers, contentment (with previously mentioned elements) and the motivation behind the visit.
The attitude and experience questions were introduced through a 5-point Likert scale. The answers could range from, for example, 1 = very unsatisfied and 5 = very satisfied, from which means for each location were calculated.
The questionnaire sample is nearly exclusively composed of international visitors, and the majority are on their first visit to Iceland. The largest group of visitors in the seven research areas in winter are British (43%) and North Americans (15%), as well as the French and Germans (about 8% each) and the Asian market (6%). Other nationalities are in smaller numbers. These numbers coincide with the seasonal division of international visitors to Iceland (Icelandic Tourist Board, 2018). Icelanders comprise less than 3% of the total sample.
Buses are the most common mode of transport in the winter period (64%), reflecting the issues associated with weather conditions in winter noted in the introduction to the chapter. Rental cars are the second commonly used travel mode, used by 28%. Approximately 19% of visitors choose organized group travel in the winter. Hotels are by far the preferred/most accessible accommodation type as 84% of visitors stay in hotels in the winter. The remaining tourists stay in guesthouses, farmhouse accommodation and at camping sites, as well as in Airbnb and similar apartment rentals.
The northern lights and nature greatly influenced travellers’ decision to visit the area in the winter. On a 5-point Likert scale where 5 is very much influence and 1 is very little influence, nature scored over 4 at all locations. Two destinations dominate when it comes to northern lights tours: the glacial lagoon Jökulsárlón and Geysir hot spring area, which both scored over 4 on the Likert scale (see Table 18.2).
Table 18.2. The influence of nature and northern lights on tourists’ visits to the area.
| Nature | Northern lights | |
| Djúpalónssandur | 4.34 | 3.69 |
| Geysir | 4.06 | 4.07 |
| Hraunfossar | 4.27 | 3.79 |
| Jökulsárlón | 4.51 | 4.27 |
| Seltún | 4.14 | 3.54 |
| Sólheimajökull | 4.21 | 3.85 |
| Þingvellir | 4.01 | 3.83 |
| All locations | 4.13 | 3.92 |
Calculated from a 5-point Likert scale where 1 = very little influence and 5 = very much influence.
The respondents were very satisfied with the quality of nature at all the destinations, with the greatest satisfaction at Jökulsárlón and Hraunfossar and the least at Geysir, although it was still quite high with 4.57 on the Likert scale (see Table 18.3). Paths were also rated quite highly, which is an important consideration given winter conditions. Tourists were least satisfied with the quality of the restroom facilities. The lowest levels of satisfaction were at the places where restroom facilities were non-existent or limited, i.e. Djúpalónssandur, Seltún and Sólheimajökull, while the greatest satisfaction was at Geysir. Satisfaction with service was also the highest at Geysir, although there the satisfaction with parking and paths was the lowest. Signs and parking had the lowest score at Sólheimajökull. Parking facilities also had a low score at the very busy destinations Þingvellir and Geysir, although they have multiplied in size in recent years.
Visitors to the seven destinations do not perceive much negative impact from tourism on the environment whether the erosion of foot paths, litter, damaged geological formations or damaged vegetation (see Table 18.4). The most significant issue is footpath erosion (mean of 1.82, where 1 is equal to not at all). Noticeably, the best situation is at Þingvellir, one of the most visited destinations.
The perception of overcrowding exists in a few places; the most noticeable are Geysir, Jökulsárlón, Þingvellir and Sólheimajökull (see Table 18.5). That goes for visitors in general, tour groups and buses. Private cars are not perceived as being overly numerous. Other destinations are perceived as less crowded with an average of below 3 on the Likert scale, the exception being tour groups in Djúpalónssandur, which is just above the mean.
The British are the most numerous geographical market segment at the destinations where visitors mainly experience overcrowding (refer to the size of the circles on Figs 18.7–18.10), followed by North Americans, while the distribution of other nationalities varies considerably between the four destinations. The Jökulsárlón glacial lagoon attracts the Asian market, as well as Germans, the French, Netherlanders and Belgians. Icelanders rarely visit those places in the winter, however some can be found at Þingvellir and Geysir.
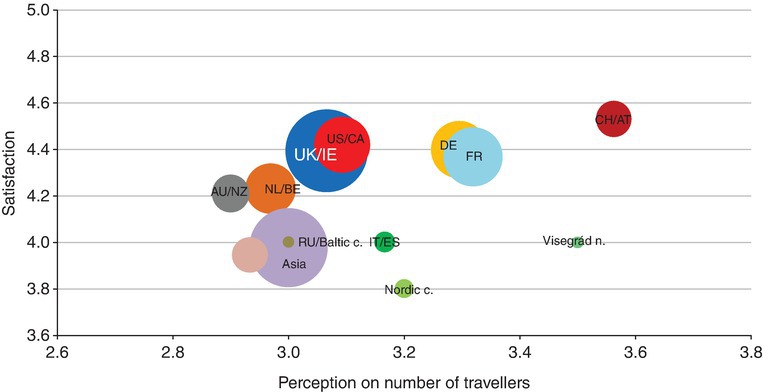
Fig. 18.8. Visitors’ perception of the number of travellers and satisfaction at Jökulsárlón in winter.
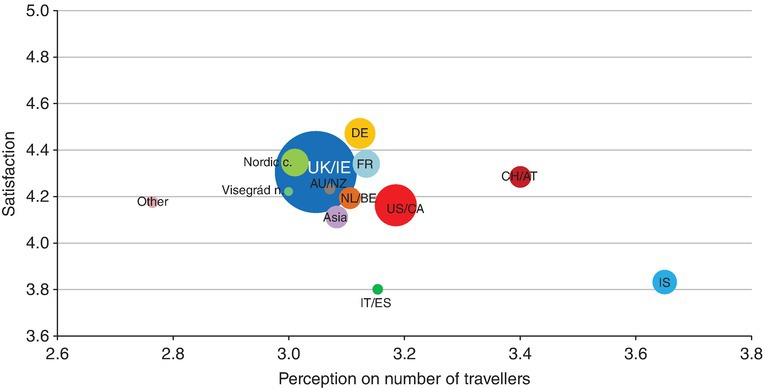
Fig. 18.9. Visitors’ perception of the number of travellers and satisfaction at Þingvellir in winter.

Fig. 18.10. Visitors’ perception of the number of travellers and satisfaction at Sólheimajökull in winter.
There is also a great difference between the various nationalities regarding their satisfaction and whether they perceive too many visitors in the areas (see Figs 18.7–18.10). The Swiss, Austrians, Germans, the French, as well as Icelanders are more sensitive towards the number of visitors than other nationalities, while Asians and the UK market are less sensitive when it comes to crowding. The Asian market and Icelanders also seem less satisfied than others.
The results of this study indicate that the enormous growth in winter tourism in Iceland has created new challenges. Even in wintertime nature remains Iceland’s main attraction. As trips in winter are usually shorter than in summer and road conditions in the countryside are often challenging, winter tourism is highly geographically concentrated in the south-west of the island, close to Reykjavík and the international airport. This leads to a concentration of visitors in a limited number of nature destinations. The results of this study show that despite high satisfaction with nature at the destinations, service needs to be better, especially regarding restroom facilities. Environmental damage is not recognized, although the perception of overcrowding exists in the most popular destinations. The traditional European market seems to be more sensitive towards high numbers of visitors along with Icelanders, while the Asian and UK market are less sensitive towards crowding. The results have implications for both tourism marketing and site management, especially given the rapid growth in winter visitation to key sites in Iceland in recent years. Given the desire to maintain satisfaction with the winter tourism experience site managers may need to pay more attention to seasonal infrastructure requirements as well as different notions of crowding.
However, the study’s results may also be significant for tourism use of winter landscapes beyond the Icelandic experience. Importantly, different marketing and management regimes may be required for the different seasonal landscapes. Increased winter visitation can put extra pressures on site quality not only during the winter period but can also have implications for other seasons given problems of site recovery. In addition, there is a clear management need to provide appropriate all-season infrastructure for walking tracks, toilets and shelters, although considerable debate may ensue as to who should pay for such facilities. Growing winter tourism in Iceland requires different road services, such as more frequent snow ploughing. There is also increased pressure on the organization of rescue services, which has so far been built on volunteer associations. Volunteers are relatively few in rural Iceland as it is sparsely populated and now, due to the huge pressure of increased winter tourism and travellers running into problems in often difficult conditions, the system is under great pressure.
A positive dimension of the study is that, despite issues related to the weather, nature-based tourism can be a viable option for winter tourism beyond the usual focus on skiing and snowmobiles. Indeed, the weather arguably becomes an extremely important part of the winter tourism experience in Iceland and serves to reinforce the role of nature in the country’s tourism offerings. Although further research is required, snow on the ground may serve to hide some anthropogenic influences on the landscape and help reinforce the social construction of the Icelandic landscape as a wilderness for many tourists (Sæþórsdóttir et al., 2011). Such findings therefore suggest that there may be new opportunities for developing the tourist attractiveness of some currently highly seasonal attractions in the Arctic and subarctic in a manner following the Icelandic experience. Nevertheless, a significant long-term question for tourism in Iceland is the extent of the impact of tourist concentrations, especially in the winter season, in nature-based destinations on perceptions of the relative naturalness of the Icelandic landscape and the associated management and marketing response.
Einarsson, M.Á. (1984) Climate of Iceland. In: van Loon H. (ed.) World Survey of Climatology: 15: Climates of the Oceans. Elsevier, Amsterdam, pp. 673–697.
Hall, C.M. (2015) Polar gateway cities: issues and challenges. Polar Journal 5(2), 257–277. DOI: 10.1080/2154896X.2015.1080511
Hall, C.M., James, M. and Baird, T. (2011) Forests and trees as charismatic mega-flora: implications for heritage tourism and conservation. Journal of Heritage Tourism 6(4), 309–323. DOI:10.1080/1743873X.2011.620116
Icelandic Met Office (2018) Veðurfarsyfirlit. Available at: www.vedur.is/vedur/vedurfar/manadayfirlitIcelandic (accessed 25 October 2018).
Icelandic Tourist Board (2004) Könnun Ferðamálaráðs Íslands meðal erlendra ferðamanna. Niðurstöður fyrir tímabilið júní – ágúst 2004. Available at: https://www.ferdamalastofa.is/static/files/konnun2004/konnun04.html (accessed 25 October 2018).
Icelandic Tourist Board (2016) Research and statistics. Tourism in Iceland in Figures. Visitor surveys. International Visitors in Iceland – Visitor Survey Summer 2016. Available at: https://www.ferdamalastofa.is/static/files/ferdamalastofa/Frettamyndir/2017/januar/sunarkonnun/sumar-2016-islensk.pdf (accessed 25 October 2018).
Icelandic Tourist Board (2018) Research and statistics. Number of foreign visitors. Visitors to Iceland through Keflavik Airport, 2003–2018. Available at: https://www.ferdamalastofa.is/en/recearch-and-statistics/numbers-of-foreign-visitors (accessed 25 October 2018).
Ingólfsson, O. (2008) The dynamic climate of Iceland. Available at: https://notendur.hi.is/oi/climate_in_iceland.htm (accessed 25 October 2018).
Koenig-Lewis, N. and Bischoff, E.E. (2005) Seasonality research: the state of the art. International Journal of Tourism Research 7(4–5), 201–219. DOI:10.1002/jtr.531
Ólafsson, M. (2018) Surfing in Iceland. Guide to Iceland. Available at: https://guidetoiceland.is/travel-info/surfing-in-iceland (accessed 25 October 2018).
Palang, H., Sooväli, H. and Printsmann, A.E. (2007) Seasonal Landscapes. Springer, Dordrecht, The Netherlands.
Pham, J., Velayo, N. and Kopecki, S. (1975) Tourism in Iceland: Phase 2. Checchi and Company, Washington, DC.
Sæþórsdóttir A.D. (2013) Managing popularity: changes in tourist attitudes to a wilderness destination. Tourism Management Perspectives 7, 47–58. DOI:10.1016/j.tmp.2013.04.005.
Sæþórsdóttir A.D. and Ólafsdóttir, R. (2017) Planning the wild: in times of tourist invasion. Journal of Tourism Research and Hospitality 6(1), 1–7. DOI:10.4172/2324-8807.1000169
Sæþórsdóttir, A.D., Hall, C.M. and Saarinen, J. (2011) Making wilderness: tourism and the history of the wilderness idea in Iceland. Polar Geography 34(4), 249–273. DOI:10.1080/1088937X.2011.643928
Simón, F.J.G., Narangajavana, Y. and Marqués, D.P. (2004) Carrying capacity in the tourism industry: a case study of Hengistbury Head. Tourism Management 25(2), 275–283. DOI:10.1016/S0261-5177(03)00089-X
Statistics Iceland (2018) Business sectors. Tourism. Accommodation. Hotels and guesthouses. Occupancy rate of rooms and beds in hotels 2000–2018. Available at: http://px.hagstofa.is/pxis/pxweb/is/Atvinnuvegir/Atvinnuvegir__ferdathjonusta__Gisting__1_hotelgistiheimili/SAM01104.px/table/tableViewLayout1/?rxid=47cb90af-3920-477c-9012-5bf0d2e8b555 (accessed 26 October 2018).
Stewart, W.P. and Cole, D.N. (2001) Number of encounters and experience quality in Grand Canyon backcountry: consistently negative and weak relationships. Journal of Leisure Research 33(1), 106–120. DOI:10.1080/00222216.2001.11949933
Welling, J.T. and Árnason, Þ. (2016) External and internal challenges of glacier tourism development in Iceland. In: Richins H. and Hull, J.S. (eds) Mountain Tourism: Experiences, Communities, Environments and Sustainable Futures. CAB International, Wallingford, UK, pp. 174–183.
Welling, J.T., Árnason, Þ. and Ólafsdóttir, R. (2017) Glacier tourism: a scoping review. Tourism Geographies 17(5), 635–662. DOI:10.1080/14616688.2015.1084529