WHEN THE DUKE OF ZHOU set out to build Chenzhou in 1036 BCE, every philosophical, scientific, and religious aspect of the Chinese culture guided his mission: to generate harmony between humanity and nature. He didn’t consult his subjects.
And when Alexander the Great and Dinocrates set out to build Alexandria, they too had a singular vision for it. Although they quickly learned that they needed to design a city that worked for farmers as well as librarians, they were solely in charge.
But the Duke of Zhou and Alexander the Great built their cities in simpler times. The twenty-first century is more complex and volatile; its cities are far larger and influenced by a much wider array of forces and trends. Great city-making requires leadership but also, today, much broader participation.
The limited city-planning tools in common use in America’s twentieth century produced rapid growth and often mediocre results. But in the latter part of the century, new tools began to emerge to help communities establish a coherent vision, and to manage the systems necessary for achieving it.
Smart Growth
In the winter of 1996, Harriet Tregoning, a young staffer in the new Clinton administration’s EPA, called together a group of urban thinkers and doers to discuss what policies could guide the administration as it addressed the environmental and social issues of urban sprawl. I was a member of the group. We named the policy “smart growth.” No longer did metropolitan regions have to choose between rampant growth or no growth; there was a third alternative—they could apply intelligence to their growth.
In the 1990s Salt Lake City’s suburbs were rapidly expanding, propelled by the area’s well-educated, affordable labor force, strong work ethic, attractive natural environment (which included four ski resorts), and the intellectual capital of the University of Utah, with its particularly strong research programs in genetics and health sciences. But the city’s downtown was in decline, and the growth of its suburbs was eating into the natural beauty that attracted people to the area; it was also driving them crazy with traffic. In 1997, a public-private partnership, Envision Utah, was formed to wrestle with the growth that was beginning to choke Salt Lake City and its environs. Its goal was to keep Utah “beautiful, prosperous, and neighborly for future generations.”1 As with the Burnham plan, the organizers had no legal power to plan the area, but by building a consensus vision for the rapidly sprawling area adjacent to the Wasatch Mountain range, Envision Utah gained moral authority.
Envision Utah brought together elected officials, developers, conservationists, business leaders, and residents young and old, urban, suburban, and rural, to develop a coherent vision of the qualities they wanted to preserve in their communities, and the kind of communities that they wanted to become. Over a two-year period, Envision Utah conducted public values research, held more than two hundred workshops, and listened to more than 20,000 residents.
Working with the regional planner Peter Calthorpe, Envision Utah generated several future scenarios. At one extreme they developed a scenario of the future sprawl generated by continuing on the same course as the region’s current pattern of sprawling development. As an alternative they explored concentrating future growth in higher-density transit-connected centers, and a third option provided something in between the first two. A model was generated for each scenario, showing what the region would physically look like if it were enacted, along with its economic and environmental consequences. The benefits and liabilities of each plan were quantified, with metrics of the minutes of additional traffic, acres of lost or preserved open space, and so on.
During the process residents expressed their love of the mountains and nature, and their concerns that these precious qualities were being undermined by traffic and sprawl. After being presented with the various alternatives accompanied by realistic projections, they came to understand the economic and environmental benefits of smart growth and mass transit. They branded their vision with terms like “the 3 percent strategy,” which would concentrate 33 percent of all future development on 3 percent of the land, connected by a world-class mass-transit system.2
Envision Utah never filed an environmental impact statement. It has no zoning authority, no taxing power, and no ability to regulate growth: those responsibilities remain with the more than one hundred communities in the Wasatch Mountains. However, the power of the group’s vision proved to be extraordinarily compelling. Within fifteen years, development patterns in the region dramatically shifted. A light-rail system was built, and new, higher-density development clustered around it. Between 1995 and 2005 the number of downtown residential units increased by 80 percent, and it now continues to grow rapidly. At the same time more of the natural environment has been preserved, the economy has grown, and the region has prospered, just as envisioned in the first scenario. Salt Lake City and its environs are frequently listed as one of the top ten best places to live in America.3 In 2014, the Milken Institute ranked the Provo-Orem metropolitan area the third-best economically performing area in the country. And it is one of the most income-equal communities in the United States.
The Cornell University law professor Gerald Torres notes that politicians follow the wind; if you change the wind, they will follow.4 Envision Utah changed the wind.
Community Participation
Founding the United States of America in the last quarter of the eighteenth century was an extraordinary experiment, one that challenged the prevailing autocratic, centralized governance model of the time. The American democracy proposed that power be vested in citizens, who would come together to form a government that would regulate itself for the common good, in order to, as the Declaration of Independence says, “effect their Safety and Happiness.”
Democracy works best when the broadest range of citizens both provide input and take responsibility for its success. In the nineteenth century the United States began to promote universal public education in the belief that an educated public would make for better citizens, and thus provide wiser governance. Being open to immigrants from so many nations and teaching them to read and write in a common language also provided a coherent tempering system to democracy. As the twentieth century progressed and planning became more technical, the number of residents who really understood the choices at hand and participated in the planning process shrank, leaving a few loud voices, NIMBY neighbors, and those who stood to gain financially to have the most influence. If you have not attended a public meeting of your community’s planning board, give it a try. The planning board, often made up of volunteers, would appreciate hearing unbiased views advocating for what is best for the community.
The Envision Utah plan modeled a new form of civic engagement, based on much broader public outreach accompanied by graphic ways to visualize the choices faced by the community. Calthorpe visited dozens of communities, equipped with a map of the region and boxes full of blocks representing the different types of development in the region—large lot subdivisions, smaller lots, town houses, apartment projects, shopping centers, main-street retail, and so on. Each block represented a square mile. A square-mile block zoned for one house per acre would accommodate about five hundred homes, whereas a mix of town houses and apartments might accommodate fifteen thousand. Residents were challenged to shape the region’s projected growth into any land-use pattern they wished. The only requirement: they had to put all of the projected growth on the map.
At first residents spread all the houses, hotels, offices, and stores out across the landscape using the lower-density development patterns with which they were most familiar. However, this placed sprawling housing developments in the mountains where they enjoyed hiking, and produced even more traffic, which many residents had left other parts of the country to escape. As they experimented by moving around the wooden blocks representing various types of development, they began to create denser mixed-use downtowns, not unlike older western towns. They also created models for the new, vibrant, denser, walkable communities that thrive around universities and attract smart young employees.
Envision Utah captured the choices these public planning sessions were grappling with and published them in a Sunday edition of the Salt Lake Tribune, to inform those who hadn’t attended the community workshops. The visual models and renderings made the choices easy to grasp. Projections of key indicators quantified the economic, environmental, and quality-of-life outcomes for each scenario. The process created an informed and empowered public, which came not only to understand the zoning choices the communities needed to make, but also to appreciate the benefits of higher-density affordable housing and mass transit. By envisioning alternative regional scenarios, residents were able to understand the likely futures they were facing, and to make informed choices to shape those futures. As it turned out, they didn’t need an emperor to strike the best balance between development and nature: the wisdom of the crowd worked well.
Indicators of Community Health
Scenario plans typically define a set of key indicators of community and environmental health. By tracking past and current conditions, and by projecting trends, planners can use data to illuminate various outcomes. The Envision Utah plan not only was based on a consensus derived from extensive community participation, but also was deeply informed by facts on the ground. Peter Calthorpe noted, “Envision Utah defined a broad range of metrics—land consumption, air quality, economic development, infrastructure costs, energy use, water consumption, housing costs, and health, to name a few. This multidimensional analysis allowed many differing interest groups to become engaged. Environmentalists, fiscal conservatives, religious groups, developers, and city officials all had data that spoke to their issues.”5
To help cities plan more dynamically, Calthorpe went on to develop Urban Footprint, a data-based planning tool that calculates the outcomes of zoning code and planning choices.* It contains a library of thirty-five different place types (such as main streets, grocery-anchored shopping centers, and quarter-acre subdivisions) and fifty building types, each based on real-world examples. The program also contains the economic, transportation, climate, and other impacts associated with each place type. Communities can then model different physical plans, and a range of incentives and regulations. Add in variables for fuel and water costs, etc., and the model can project the outcome for the inputted scenarios. Urban Footprint helps residents more accurately understand the consequences of their planning decisions.
In 2001 the economist Mark Anielski and a group of colleagues established a broad set of indicators for the city of Edmonton, in Alberta, Canada. The project tracked twenty-eight measures of the health of community and natural systems, in five categories of well-being: human capital (people); social capital (relationships); natural capital (the natural environment); built capital (infrastructure); and financial capital (money). The human and social indicators ranged from personal consumption to crime, from rates of cancer to the advancement of intellectual and knowledge capital. Environmental indicators ranged from measures of the health and diversity of wetlands to the amount of greenhouse gases the city emitted.6
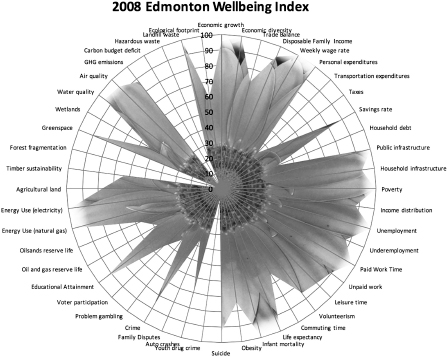
Edmonton Well-Being Index, 2008. (Mark Anielski, Anielski Management Inc., 2009)
Now, for the first time, Edmonton had clear measures of its well-being and a way to track its progress toward its goals.
The combination of Envision Utah’s visualization techniques and Edmonton’s community health indicators provides a powerful tool for communities not only to plan their futures, but to track their progress and make adjustments as the plans unfold.
PlaNYC
In 2007, Mayor Michael Bloomberg was overseeing a thriving New York City. After decades of shrinking, in the early 2000s New York City began to grow. By 2030, it was projected to add another million people, but it had no plan for accommodating that population surge. In fact, Bloomberg realized, although the city had a capital plan, a transit plan, a housing plan, and many others, it didn’t have an integrated strategic plan. So he asked his deputy mayor, Dan Doctoroff, to create one.
The process brought together twenty-five city agencies to figure out how to integrate their separate domains. Through their work emerged a vision of an environmentally sustainable city. Although it seems that Bloomberg had asked for a strategic plan, not a green plan, he was remarkably supportive of his innovative commissioners. The plan’s green framework immediately won approval from the city’s many environmental NGOs (who probably would have opposed the same plan if it had been framed as a blueprint for economic growth).
PlaNYC described 127 initiatives, grouped into ten categories: Housing and Neighborhoods; Parks and Public Spaces; Brownfields; Waterways; Water Supply; Transportation; Energy; Air Quality; Solid Waste; and Climate Change. For the first time a city clearly articulated the connections among each of these areas of operations and established measurable ways to track progress in making them more environmentally responsible. For example, PlaNYC set a goal of planting one million new trees. Each new tree was geocoded so that residents could see where it was on a map of the city, and track how many trees had been planted that day, month, or year, as part of the Parks and Public Spaces initiative. Every additional planted tree also helped the city achieve its storm-water-absorption goal, clean the air of particulates, reduce ambient summer air temperatures, and increase residents’ sense of well-being. The growing amount of available data helped make the plan’s objectives measurable and its agencies accountable. It also helped everyone be more effective.
Big Data
Once cities have a clear vision of what kind of place they want to become and a set of indicators to measure their progress, the next step is to measure results on the ground in order to guide progress toward better and better outcomes. Urban regulators now have the benefit of the “Internet of Things,” a term coined by Kevin Ashton, a British scientist and co-founder of the Auto-ID Center at MIT. There Ashton developed global communications standards for radio frequency identification (RFID) and other sensors. These tiny electronic tags, when embedded in objects, or “things,” can transmit a huge amount of information, including location, surrounding conditions like weather, and the performance of any device to which they may be attached.
The Internet of Things takes in data from a vast array of remote-sensing devices, including those in water and energy systems, mobile phones, vehicles, and weather and air-quality monitors, and integrates it into a vast, ubiquitous information network. It then adds human-generated information from hospitals, Social Security offices, employment centers, and schools, along with the personal data that people generate with every phone call, noncash purchase, and social network log-in. Taken together, the Internet of people and things is providing cities with enormous sets of information, which have become known as “big data.”
Big data, a term coined by Doug Laney, vice president of research at Gartner Research, is a data set too large to be housed by any one computer. Its size is measured in petabytes, or one quadrillion bytes (1,000 terabytes). Currently the only way to deal with Big Data is with massive parallel-processing computing systems. These systems can mash it up, analyze it, extract trends, and feed it back to urban operating systems in real time, providing nearly instantaneous feedback loops on city strategies. Well-digested Big Data gives cities the ability to compare its actual conditions with community health indicators in real time, and adjust their regulations, investments, and operations to support behaviors that increase human and natural well-being, and to discourage those that don’t. Energy systems can be made more efficient by tuning to real and anticipated demand. Water systems can detect leaks and wasteful usage patterns and intervene to correct them. Transportation systems can adjust to changing demand from sporting events, the weather, and changing usage patterns of bike riding and car sharing. Social service systems can individualize services to achieve better outcomes. Health-care systems can stimulate the social determinants of health to reduce reliance on more costly medical interventions.
The Levers of Governance
There are seven primary levers of governance than can guide urban development and operations: an aspirational vision of the city; a master plan for how to implement the vision, with specific indicators of its components; data collection so that the city has intelligence about its circumstances and can create feedback mechanisms to adjust the steps being taken toward achieving its vision; regulations, such as zoning and building codes; incentives, including tax credits and loan guarantees; and investments in infrastructure such as transportation, water, and sewer systems. Also, the vision must be communicated to the city’s citizens. Ultimately, these tools will lead to success only if collectively they become part of the city’s social and cultural DNA.
Regulations restrict behaviors detrimental to the overall objectives of the community. For example, building codes keep builders from constructing unsafe homes. Environmental regulations prevent toxic substances such as lead from finding their way into homes. Incentives do the opposite; they encourage the growth of things that the community desires. In high-cost cities, for example, developers may be given additional development rights in exchange for creating affordable housing, and in struggling communities incentives bring in businesses and the jobs that come with them. Investment in infrastructure provides the framework on which the vision unfolds.
Twentieth-century zoning and environmental review systems just can’t keep up with the challenges of a volatile and complex world because they are static and unintegrated. Cities now have the capacity to replace them with a more dynamic, integrated system utilizing all seven levers of governance. Truly smart growth aims us toward a community vision of well-being carried out by the seven aspects of governance working together in real time, using indicators of human and natural system health to create feedback loops.
Smart Operating Systems
Mayor Bloomberg understood the power of data. After all, he had made his fortune by aggregating as much financial data as possible and communicating it in ways that were useful to his customers. When he became mayor in 2002 the city’s ability to provide agencies with usable data was primitive at best, so Bloomberg created a department of data analytics and appointed Mike Flowers to serve as its first director.
Flowers’s goal was to develop actionable insights from the city’s data. When he started working, one of the first problems he was asked to tackle was illegal apartment conversions. Landlords were turning basements into apartments, or subdividing existing apartments into tiny rooms, installing bunk beds, and renting them out to poor people and recent immigrants. These illegal conversions were likely to lack proper windows and sanitation, and had a higher number of fires. Because they did not follow fire safety codes by installing proper sprinkler systems and safe exit paths, their residents were fifteen times more likely to be killed or harmed in a fire. Illegal conversions also were hotbeds of drug dealing.7 Unfortunately, the city wasn’t very good at tracking them down. When it sent inspectors to respond to complaints about illegal conversions, they succeeded in finding them only 13 percent of the time. This was a huge waste of manpower. Flowers was challenged to use the city’s data to help bring up their success rate. For example, overcrowded apartments should have abnormally high water usage. Cross-correlating information on permitted occupancies with water bills could indicate overcrowding. And if instead it revealed a water leak, solving that wouldn’t be a bad secondary outcome of the project.
His team started by accessing the database for the city’s 900,000 buildings, as well as data sets from nineteen different agencies containing such information as foreclosure records, rodent complaints, ambulance visits, crime rates, and fires. But before he could pool all this information, Flowers had to develop a common language for it. To complicate matters, each agency had been keeping information such as building addresses in different formats: the Buildings Department assigned every structure a unique building number; the Tax Department identified buildings by borough, block, and lot numbers; the Police Department used Cartesian coordinates; and the Fire Department used an old, proximity-to-call-box system, even though the call boxes themselves were no longer in use.
Flowers created one building identification system for all of the city’s agencies. Then his team went into the field and listened to housing inspectors as they made their rounds, in an effort to quantify hunches based on years of experience. From these, Flowers developed algorithms that identified patterns most likely to indicate overcrowded, unsafe, illegal conditions. Within a few months the inspectors’ rate of discovering illegal conversions climbed to over 70 percent. Flowers’s actionable analytics were saving lives.
As cities become increasingly effective at defining their vision, and identify the indicators of success, we are only beginning to see the ways in which dynamically tuning the cities’ seven levers of governance and their operating systems will increase the well-being of both their human and their natural systems.
Sharing Big Data
Just as community participation has improved planning, it is also improving the usage of big data to make cities function better. Governments are often not the most entrepreneurial organizations, but they can be excellent aggregators of data. When they share the data, social entrepreneurs can use it to make the city better. In 2011, Washington, DC, released data from GPS transponders on the roofs of its buses. Almost immediately young companies like NextBus created smartphone apps that could tell riders when the next bus on their route was coming, and how long it would take to get to their destination. Today the system also directs passengers to alternative routes in case of traffic or an accident. With the app customers can sit in their homes or a nearby coffee shop on a rainy day and relax until their bus arrives. NextBus has increased bus ridership in every city where it has been used, taking cars off the road, improving air quality, and reducing traffic. And the bus riders themselves are happier.
The information needed to fine-tune cities doesn’t even have to come from city government. Waze is a real-time route-mapping program that draws on crowd-sourced data from its millions of users, whose smartphones send in their travel speed, accident reports, roadwork, and other traffic issues they encounter. It then calculates the best route for the driver to take. Because the data is provided by a community, users feel socially connected to other users, and grateful for their input, which encourages users to contribute data for the benefit of the whole. Streetbump.com is an app that records whenever a driver goes over a pothole and sends the information to a city’s department of transportation to schedule a repair, while warning its community of tire-wrecking potholes in the streets ahead.
The Smart City
A smart city uses digital technologies or information and communication technologies to enhance the quality and performance of urban services, to reduce costs and resource consumption, and to engage more effectively and actively with its citizens.
Although the core ideas for smart cities may have come initially from the United Kingdom and the United States, their most advanced applications are taking place in the rapidly growing cities of the developing world. South Korea is planning to build fifteen “ubiquitous cities,” its name for the ubiquitous computing that underlies its version of a smart city. Its first U-City, Hwaseong-Dongtan, opened in 2007 and features what it calls U-Traffic, U-Parking, and U-Crime Prevention systems. Korea’s New Songdo City (a 1,500-acre district outside Seoul) is using RFID tags and a wireless network to link all its building, business, medical, and governmental information systems. Its trash is tracked as it is collected by an underground vacuum system. The environmental performance of its buildings, all LEED certified, is managed by smart building systems.8
The city of Rio de Janeiro has developed an extensive city operations center in partnership with IBM, which has invested heavily in Rio in anticipation of global visibility in 2016 when the city hosts the Summer Olympics. The center was first used to improve Rio’s security cameras, police communication systems, and traffic control. Now it also takes in information from cell phones, radio, e-mail, and text messages, while also storing and analyzing historical data. In case of a traffic accident, flood, or crime, the system not only assists with interdepartmental coordination, but also provides helpful suggestions based on various scenarios.
By squeezing out inefficiencies, smart cities could use resources far more efficiently, reducing their environmental impact while increasing the availability and quality of services. Data analysis makes it easier to find patterns such as the relationship between air quality and health, and to track the economic benefits of stronger environmental regulations. Identifying these various relationships allows costs to be charged more accurately to the source; for example, the health impacts of automobile pollution could be identified and a health-care surcharge levied according to the pollution the car generates and the number of miles driven.
The smart-city movement is a global one, promoted by the corporations that see a burgeoning market for equipment and services. Cities are eagerly sharing their experiences with one another. But along with the opportunities that this smartness brings, there also needs to be caution. Every algorithm used to analyze data will incorporate the biases of its creators, and these are not likely to be explicit. As urban operating systems become more computerized, they are more vulnerable to crashes, such as the 2006 malfunction of the software that controls San Francisco’s BART system, an event that caused it to shut down three times in seventy-two hours. Smart cities are vulnerable to cyberattacks, hacking, and the inherent bugs in code that cause our personal computers to freeze at the most inopportune times. Smart cities are also vulnerable to systemic issues, such as the Internet going down. And imagine the chaos that would ensue if the global satellite positioning system failed. The solution is that every smart system has to have a human, mechanical, or analog fail-safe mode. For example, emergency services need to be equipped with walkie-talkies as well as cell phones, and compasses and maps as well as GPS. Cities need to be able to function on manual.
Agent-Based Modeling
Cities and their regions are complex, multilayered systems in which every part affects the whole. Advances in computing are now allowing planners to begin to model not just large-scale trends like population growth, but the behavior of individual groups, or “agents,” like home buyers, commuters, shop owners, small companies, and so on. Each agent is assigned a specific range of behaviors that can be varied according to the circumstances. With such systems, planners can more realistically forecast the outcomes of their use of the seven levers of government to better achieve their goals.
In 2012 the economist John Geanakoplos and his colleagues created an agent-based model to test different housing finance policies to see if they could find one that could have averted the world financial crisis in 2008. They created a model of all the mortgage borrowers in the Washington, DC, area. Their computerized agents represented individual households with a wide range of circumstances; some could afford their mortgages, some couldn’t. Some had fixed-rate mortgages, some adjustable. Some refinanced their homes when interest rates dropped, while others didn’t want to be bothered. Geanakoplos and his team then ran a range of scenarios to analyze the collective behavior of their agents. First they raised interest rates, but this slowed the growth of the economy and caused a crash. When they lowered interest rates too many people borrowed, destabilizing the system. But when they modeled modestly tightened mortgage qualification standards, it produced the best behavioral outcomes in all sectors of the system. By modeling the collective behavior of a large group of agents, they identified an approach that could have averted the financial crisis.
Using agent-based models, planners can test the efficacy of differing regulations, incentives, and investment plans to help move their city toward their vision. Alternative scenarios can be run to determine their effect on various indicators of the well-being of human and natural systems. For example, a city facing a drought can test a combination of strategies such as raising water rates, investing in wastewater recycling plants, offering incentives for residents to plant xeriscapes (low-water-using landscapes), banning car washing, and so on to find the ones that will produce the best results. The Mayan empire collapsed because the people didn’t understand the effect of their behaviors in time to change them. Smart cities can rapidly adapt to the VUCA world.
Self-Organization
When the various individual agents in a system interact, they begin to self-organize into something larger, a community whose collective behavior allows it to function cohesively. This phenomenon, in which complex capabilities emerge from combining simple elements, is the basis for creating social clusters. These may be simple at first, but as they link they take on an entirely new character and become a system. This happens when individuals become a family, families become neighbors, neighbors become a community, communities become a city, and cities become metropolitan regions. At each level qualities emerge from the relational context that did not exist in the individual context.
The word “system” comes from the ancient Greek word sunìstemi, which means “uniting or putting together.” Systems, like communities, have boundaries, something that defines what is inside and what is part of the larger environment. However, since everything is deeply interdependent, the boundaries of both systems and communities exist largely for the convenience of identity. Although theoretical systems might be isolated, real systems are always exchanging energy, information, and matter with their surroundings.
Biocomplexity
While humans are just beginning to develop information feedback loops to guide the development of our complex creations like cities, nature has been doing it for a long time. And nature’s feedback process is far more elegant, integrated, and complex than ours. This integration of the components of living systems into larger systems is called biocomplexity.
Biocomplexity is the key to nature’s coherence, its ability to heal itself after a disruption such as a wildfire or an earthquake, and its adaptability under stress. It’s a model that could inform how we bring these qualities to the development of cities.
The Biocomplexity Institute at Indiana University defines biocomplexity as “the study of the emergence of self-organized, complex behaviors from the interaction of many simple agents. Such emergent complexity is a hallmark of life, from the organization of molecules into cellular machinery, through the organization of cells into tissues, to the organization of individuals into communities. The other key element of biocomplexity is the unavoidable presence of multiple scales. Often, agents organize into much larger structures; those structures organize into much larger structures, etc.”9
Biocomplexity is the basis for the integration of the cycles of life. It is the process by which genes shape the forms and locations of proteins, which build organisms whose metabolisms are deeply tied to the rest of the web of life, all done in such a way that both individual organisms and the larger system of life “learn” what works and what doesn’t, and evolve to adapt.
Biocomplexity emerges from the collective behavior of a biological system. This wholeness is accomplished in part by the sharing of genetic material, which is shaped by the system’s environmental conditions.
Life on earth is a magnificent biocomplex system, integrated by our shared DNA. This body of shared genetic information is the key to the extraordinary cycles of life. It’s the reason the outputs of one species serve as the inputs for another, so that there is no waste in nature. And it is regenerative, designed to keep energizing and organizing an inherently entropic system.
In Botswana’s Okavango Delta, a wildebeest is eaten by a hyena, who chews every bit of the wildebeest, including its bones. They are broken down in the hyena’s digestive system, and pass out as white, calcium-rich excrement. Land turtles eat the excrement as a source of calcium for making their shells. Their excrement in turn is eaten by dung beetles, whose own excrement is broken down by bacteria in the soil to become essential elements for the growth of plants. And those plants will be eaten by wildebeest. As the nutrients pass through this system from the wildebeest to the soil, they become simpler, and have lower levels of energy and information, following time’s arrow of entropy. But when they are drawn into a plant through its roots and up to its leaves, the plant’s chlorophyll captures the sun’s energy that reorganizes elements into higher levels of complexity, information, and energy.
Our cities mimic the general aspects of biocomplex systems. Each citizen, company, building, and car is a component of the city; collectively, like the elements of nature, they form a far more complex system than does any individual component. But they do not yet incorporate nature’s regenerative qualities. The best cities of the future will.
The complete collection of an individual organism’s DNA is called its genome. A metagenome is the genomic information of all the organisms in a community or system that shapes how it grows and functions. It is not kept in one central place, but distributed throughout the community. A single sample from a river of its environmental DNA, known as eDNA, can tell the story of all of the fish, plants, algae, and other microorganisms that make up their integrated ecology.
Our cities have a metagenome, the Alexandrian library of all their knowledge, processes, and social systems. It’s why each city has a different signature of sounds, smells, and sensibilities. As we begin to collect and analyze big data, we can begin to see its outlines.
Metagenomes are composed of genes, which are made up of strands of DNA. Think of DNA as the blueprints for buildings, streets, and all the other elements of the city. Its genes, which are made of compilations of DNA, are similar to its building code. The metagenome of the city is its master plan, its zoning code, and all the organizational social, economic, and environmental systems of the city. Perhaps this is what was meant by the ancient concept of meh.
In nature, the genes of an organism contain many blueprints, but not every one is expressed. In fact, only 1.5 percent of all the DNA in a human is expressed in the protein building blocks of our body—we do not yet know what much of the remaining DNA does. In the same way, although a city may have a zoning code permitting thirty-story buildings in a neighborhood, this doesn’t mean that every building will be that tall. But they all have the same potential to become that tall.
In the biocomplexity of a healthy system, the metagenomics of the whole system are constantly being influenced by the evolution of the individual components within it, and are influencing them at the same time. This process occurs through epigenetics, the switching system for genes. Environmental conditions such as stress or plenty are monitored and fed back into the genome, and change how DNA is expressed by turning some components off and others on. These changes are then passed down to future generations. This continuous feedback loop between the current adaptive needs of the system and its individual and collective DNA keeps it evolving.
Life unfolds through three macromolecules: DNA, which contains all the information in a system; RNA, which translates it; and proteins, the physical building blocks of the system. The proteome is the total set of proteins in the system designed by its DNA. The physical expressions of a city—its buildings, streets, and infrastructure—are its proteome. But proteins need more than information to grow; they need energy, materials, and water. These are supplied by an organism’s metabolism. The total metabolism of a system is its metabolomics. (Think of it as metabolism’s version of economics.) In the next chapter, we will explore the metabolism of the city, and how essential it is to a city’s resilience. The genes of individual organisms, the proteins that build life, the metabolism that powers it and regenerates its decaying energy, information, and complexity, and the feedback loops that monitor the results of the process form the cycle of life. The biocomplexity of life on earth is built from this common set of operating instructions that tie us together. Every organism contributes its genes to the gene pool of life on earth. This ever-unfolding gene pool helps ecosystems adapt to changes in the environment.
Biocomplexity provides the best model for city planning and development systems to be able to adapt to the volatility ahead. It requires that city planning and governance be much more dynamic, starting with data-sensing and feedback systems so that they can continuously learn, and then the dynamic application of the tools of governance to adjust the city’s growth and metabolism in real time. Cities also must encourage a wider range of innovation—the richer the gene pool of solutions, the greater the adaptive capacity of the city. And to achieve these, the city must be capable of changing and willing to change.
Nature does not have to think about these things; it does not have to decide which course of action to take. Humans do. Our cities are reflections of our perceptions and intentions, our aspirations, our cognitive biases, and our fears. These shape how we choose what our cities shall be from the vast metagenome of possibility.
Coherence
The first of the five qualities of temperament is coherence, which grows from integration of information, feedback systems, and an intention, or direction, toward which coherence flows. Most urban operating systems are as disconnected as Pythagoras’s separate musical scales. Just as the well-tempered music system integrated all scales into one much larger universe of compositional opportunity, capturing and integrating all of a city’s information in a single system enhances its ability to adapt. When the information of each component of a city can contribute to the metagenome of the whole, then the city can learn, and more effectively evolve. A lesson that biocomplexity brings to city planning is that when all elements of the system share a common metagenome, they fit together. The magnificent fitness of nature comes from our common evolutionary heritage. And such fitness is a key to efficient, resilient cities. It is a key to the regenerative, adaptive capacity needed in a VUCA world.
But integration and coherence are not enough. Our cities must be planned to move toward a vision. That vision must embrace the well-being of life, and include the health of its human and natural systems. In reality they are not separate—humans and nature are mutually dependent. But often we humans do not act as if this is so.
The Dynamically Balancing City
When the function of awareness is merely observing, it cannot be truly adaptive. However, when a system has the capacity to be aware of its awareness, to recognize itself, it can naturally, intelligently adapt to its environment. This awareness of awareness may have been the transformational evolution of human cognition that led to the first cities.
The formal urban plans that structured Uruk, Memphis, and China’s nine-square cities were brilliant concepts for building early cities, but they are no longer up to the task of growing modern ones. Although each plan aspired to maintain the balance between humans and nature with Pythagorean pureness, its rigidity was not in harmony with how nature works. In a world that moved more slowly, those organization plans worked for a long while. However, in a VUCA world, traditional planning fails because it does not adapt quickly enough.
In a rapidly changing, interconnected world, each diverse, niche-adapted solution to urban issues contributes to the metagenomics of the whole. Alexandria’s thirst for and use of diverse knowledge allowed it to thrive for centuries, and Islam’s acceptance of diverse religions and cultures gave rise to the vitality of its cities. The Hanseatic League went even further. Its common set of rules provided the genomic code needed to encourage connectivity among its differentiated parts. Its expansion was supported but not directed, so the system unfolded organically and flexibly, without the rigidity that comes from one nexus of control. And Amsterdam thrived by encouraging diversity, discouraging religious fundamentalism, embracing entrepreneurialism, and creating public stock corporations to more broadly share with both the city and its residents the economic benefits that arose from these conditions.
By the early 2020s, the major cities of the world will likely be suffused with 5G wireless systems, vastly increasing their capacity to connect everything and everyone. The dynamically balancing city will continuously sense its economic, environmental, social, and ecological conditions and use those to tune its levers of governance to optimize the well-being of its residents; its businesses; its cultural, educational, and health systems; and its environment. For example, guided by the goals of its community health index, it may tune its zoning code, infrastructure investments, and incentives in real time to encourage the development of affordable housing, the mix of uses that reduces traffic, or the need for more open space.
The role of city leadership in a VUCA world is twofold. The first aspect is to create the conditions whereby a vision for what the city can be continuously emerges. No longer must we depend on an emperor to provide a city’s vision. It may come from many sources—from a strong mayor, a wise group of leaders, its longtime residents, and recent immigrants. Second, city leaders must nurture the capacity of a city to adapt to rapidly changing circumstances. With vision and adaptive capacity, cities can thrive. Nations are often too large and polarized to fully integrate their parts; states, too removed from the daily lives of their citizens. Cities, when sufficiently empowered by their federal and state governments, are the size of polity capable of adapting to rapidly changing circumstances. To do so, they need resources. In Denmark, 60 percent of the nation’s public expenditures are spent in cities. That, writes Bruce Katz of the Brookings Institute, is why Copenhagen “has become one of the world’s happiest, healthiest, and most livable places to be.”10
The nine Cs that gave rise to cities—cognition, cooperation, culture, calories, connectivity, commerce, complexity, concentration, and control—matter just as much today as they did when cities were emerging. Thanks in part to information technologies, cities can be connected, not only to enhance commerce, but so that they can learn from one another. Fortunately, this is what we’re seeing. The rise of global urban knowledge networks is rapidly spreading the DNA of solutions across urban ecologies.
As metropolitan regions discover that the twentieth-century pattern of sprawl is sapping their efficiency, they are returning to having more concentrated urban and suburban centers, integrated into a multicentered region. The best are enhanced by culture, the human genius that enriches our lives.
In later chapters we will discuss how important rich social networks are to the vitality and resilience of cities. But the next step is to examine the second feature of the well-tempered city, circularity, which depends on the movement of energy, water, and food as they are processed by the metabolism of the city.