Figure 8.1
Vectorscope and Waveform Monitors
Figure 8.1
Vectorscope and Waveform Monitors
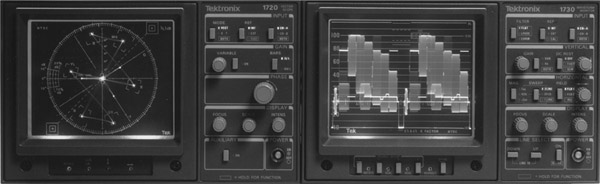
In the previous chapter you learned that a video monitor is used to judge the quality of an image. To measure the video signal itself, you use electronic measuring tools. Traditionally in analog video this was done with oscilloscopes designed specifically for video signal measurement (Figure 8.1). Today signal measurement takes many forms. Professional video production centers will often have stand-alone instruments, similar to the oscilloscopes they replace. Often many of the functions of those instruments can be found built into video production software tools such as editing software. Professional level video monitors also include many of the tools found in stand-alone instruments. This chapter will start by taking a look at the older analog devices, as the way they work is the basis for how we measure signals today.
In the previous chapter, you learned that color bars were used to set up a video monitor. The same color bars are used to measure the quality of a video signal path. As the most frequently seen test signal, color bars come in several different presentations, including full field bars, EIA split field bars, and SMPTE. These were developed over time to address different aspects of the video setup process.
The SMPTE bar signal contains a 100% white chip, a 75% white chip, and the three primary and three secondary colors. There is a chip for black, which measures 0% in the digital world or 7.5% in the analog domain. Contained in the black chip are two smaller chips. One is a few units “darker” than black and one is a few units “brighter.” These chips make up the PLUGE (Picture Lineup Generating Equipment). This signal is designed to help set the brightness on monitors. Adjusting the brightness so the brighter chip is just visible and the darker merges with the area around it will insure a proper black level setting (Figure 8.2, Plate 7).
True video generally does not reach the levels that are contained in a color bar pattern, because color bars by their intent are designed to indicate the limits of the signal (i.e., the highest luminance level, the highest chrominance level, the lowest luminance, and so on). If the colors were presented in the color bar display at 100% of their true values, the reference signals would be beyond the measuring capabilities of the analog waveform monitor. For example, SMPTE defines yellow as 133 IRE units when fully saturated. The graticule on the analog waveform does not measure beyond 120 IRE units. For this reason, a color bar signal reduced to 75% of true levels was created, and this 75% color bar is the general standard in use. The yellow bar in the 75% color bar display appears as 100 IRE units.
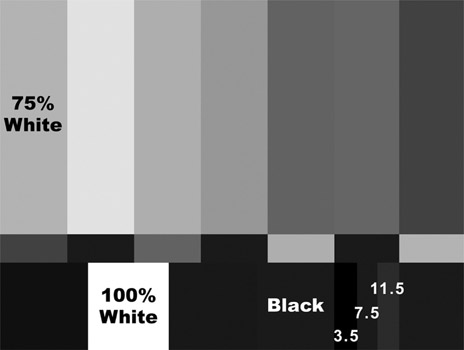
Figure 8.2 (Plate 7)
PLUGE Bars Signal
NOTE Some documents refer to this as 75% bars and they mean the traditional bars described above. There is a 100% color bar signal, but it is much less commonly seen.
The waveform monitor is used to make sure the video signal is being recorded or reproduced within broadcast specifications. When analyzing the video signal on a waveform monitor, the view of the signal can be changed and certain parts enlarged in order to take measurements. The video signal is not affected as you take these measurements. If the video signal needs to be adjusted to meet broadcast requirements, those changes are made on the video source itself. That might be the camera, a video recorder or playback machine, or possibly from within an editing application.
The waveform monitor shows two aspects of a signal, time and voltage. From left to right (along the X axis), time is displayed. Things that happen early in a signal will be displayed on the left, while the right side displays what happens later in time. Top to bottom (along the Y axis) is used to measure the amount of signal present, or the voltage of the signal. Combining the two allows the operator to see how much signal is present at any point in time.
NOTE While analog monitors are not in use much today, learning how they work provides a strong foundation for the process of measuring a video signal in general.
Analog waveform monitors have a small CRT (cathode ray tube) that displays an electronic representation of the video image. In front of the CRT is a glass or plastic plate known as the CRT graticule. The CRT graticule is made up of vertical and horizontal lines used to measure the video signal. The horizontal lines are in IRE units of video, measurements that were first developed by the Institute of Radio Engineers (IRE). The IRE scale ranges from –40 to 100 units. The measurement from –40 to 100 IRE is referred to as one volt of video peak-to-peak (Figure 8.3).
The horizontal line at zero units is referred to as the base line (Figure 8.3). It is marked with vertical divisions in microseconds and tenths of microseconds. The shortest vertical lines represent 2/10 of a microsecond, and at every fifth 2/10 of a microsecond is a slightly taller line that represents a 1-microsecond division, or 1.
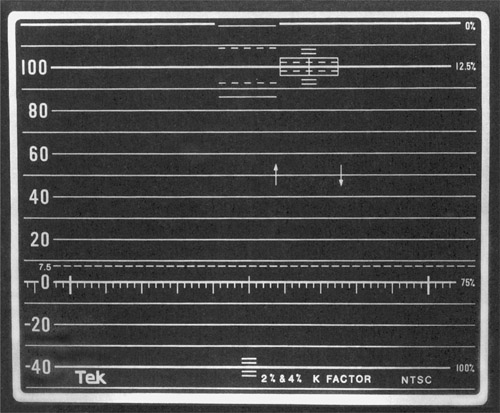
Figure 8.3
Waveform Graticule
When reading an analog composite signal on the waveform, the zero-units line of the video signal is always set on the base line of the graticule. The horizontal sync pulse should be at the –40 units line beneath the base line. The color burst portion of the signal should reach from –20 IRE units to +20 IRE units, for a total of 40 IRE units (Figure 8.4, Plate 8).
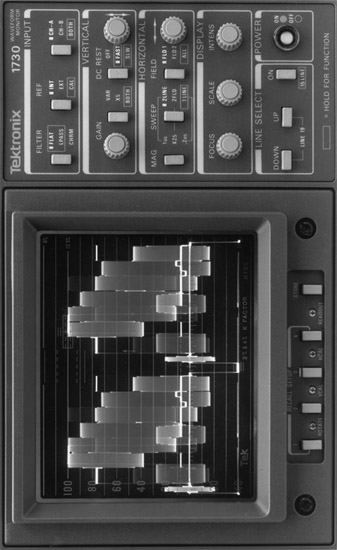
Figure 8.4 (Plate 8)
Color Bars on Waveform Monitor
The active video signal, when viewed as luminance only, occupies the range between 7.5 units and 100 units on the monitor. In Figure 8.2, the white portion of the video color bars generates the top part of the waveform display. The horizontal line near the top of the graticule, which should match the pure white square patch of the color bar signal, is equal to 100 units. Analog black, which is also referred to as setup or pedestal, is the darkest part of the signal and should be on the 7.5 units dotted line, 2.5 units below the 10 unit line. A proper 100% video signal will measure 140 units on the graticule scale from the horizontal sync to the white peaks. Again, horizontal sync takes up the portion between –40 and 0 units, while the active video image extends from 7.5 to 100 units on the scale.
Waveform monitors have the ability to change how much time is displayed from the left to the right of the scope. Often, such as in Figure 8.4, this adjustment is called SWEEP. While the default is to show 2 full lines, the time can be changed to show all the lines in both fields simultaneously. In a similar fashion the signal can be expanded, or magnified in either the vertical or horizontal axes for closer examination.
With the addition of the color subcarrier to the analog video signal, scopes needed the ability to separate the two signals for inspection separately. In the Input section of Figure 8.4, the button marked FILTER selects the content of the display as far as luminance and chrominance are concerned. A FLAT display shows the luminance and chrominance of the signal combined. Low Pass (LPASS) selects the luminance portion of the signal only. Likewise, chrominance (CHRM) selects the color portion of the signal alone. Figure 8.5 shows half the scope with the color subcarrier filtered off on the left, and combined with the luminance on the right.
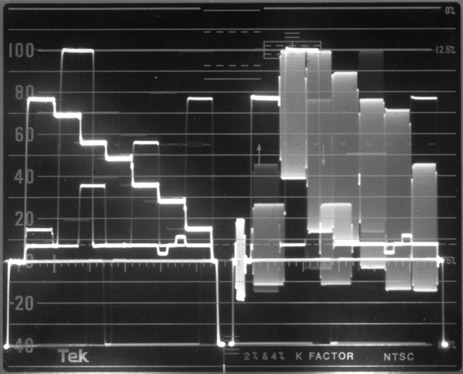
Figure 8.5
Low Pass Display
Waveform monitors needed to know when to start the scanning process in the same way a video monitor did. Reference Sync does just that. The reference button (REF) is used to select either an internal or external reference. In the Internal mode the sync signal that is shown on the display also triggers the start of lines and frames on the scope. External reference (EXT) is used to synchronize the scope with a separate source of sync. Then the signals from devices such as cameras or recorders can be measured in time against that reference. This synchronization process is referred to as video timing. In order to switch cleanly between signals, each device’s sync pulses must perfectly align, and video timing is the process of adjusting each signals arrival at the scope as measured against the external reference.
A color bar signal contains precise amounts and durations of chrominance and luminance that appear in an ordered fashion. This signal is used to ensure the video images that follow will fall within the specifications of a specific standard. However, when video images are viewed on a waveform monitor, the scope reflects the chrominance and luminance levels of the video image, which never appear as precise and ordered as color bar signals. Often, there is a wide variety of image elements spread over the peaks and valleys of the entire signal range (Figure 8.6).
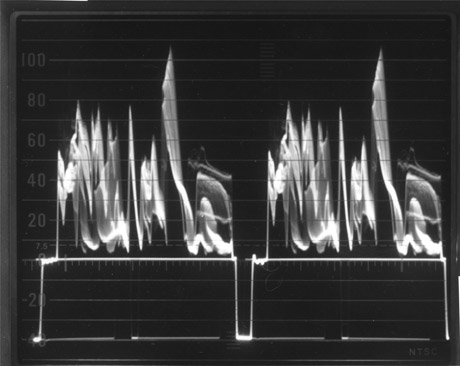
Figure 8.6
Image on Waveform
The vectorscope is another type of oscilloscope used to measure the video signal. Unlike the waveform monitor, which measures the luminance and timing aspects of a video signal, a vectorscope is used to measure the saturation and hue. The name vector comes from mathematics. A vector is a geometric form that has magnitude and direction. For video instruments the direction is measured in a circle, much like a clock face, and represents the hue of the color. The magnitude or amount of the color is the saturation, which is measured as the distance from the center of the circle.
As with waveform monitors, vectorscopes have a small CRT that displays the signal. The CRT is behind a glass or plastic plate inscribed with a circle that had markings and lines, which is the graticule (Figure 8.7). The markings on the circle itself represent degrees from 0 to 360. The thinner, individual notches or markings represent differences of 2 degrees. The bolder markings represent 10 degrees. The 0 point or mark is at a nine o’clock position on the scope. The degree markings move in a clockwise position from that point.
There are two perpendicular lines that cut horizontally and vertically through the circle. The line that goes from 0º to 180º is referred to as the X axis. The vertical up and down line that goes from 90º to 270º is called the Y axis. Analog scopes have a second set of axes, used to measure the subcarrier in a composite signal. This set, called I and Q, are not used with digital signals.
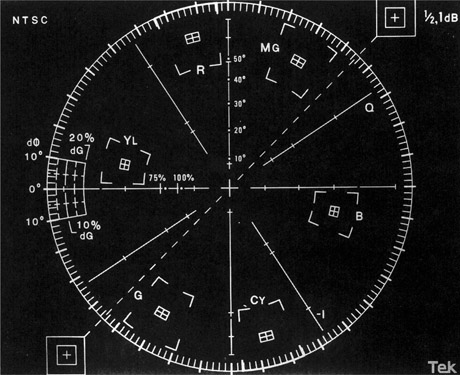
Figure 8.7
Vectorscope Graticule
On the graticule, there are individual boxes that are located within the circle. Starting from the nine o’clock position and moving clockwise, these are yellow (YL), red (R), magenta (MG), blue (B), cyan (CY), and green (G). The three primary colors, red, blue, and green, are each separated by one of the secondary colors. The secondary color is a mixture of the two primary colors on either side of it. The box placement represents the direction or hue of a particular vector. The boxes are also used as an indication of the correct length of a vector, or its saturation.
The proper setup of the chrominance signal for color bars would show the center point of the signal aligned with the center point of the circle scale (Figure 8.8). The burst of the color subcarrier signal, the short line on the X axis, should point directly to the
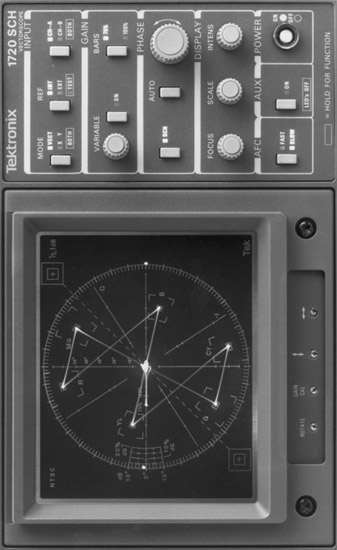
Figure 8.8
Vectorscope
nine o’clock position. Much like a video image on the waveform, the color bars were designed to fit into specific color boxes in the vectorscope.
During active video, the vectorscope does not show straight lines and sharp dots. The display shows a fuzzy blob of energy. This blob represents the variety of colors in the television picture rather than the pure colors that existed in a color bar signal.
Technology has changed a lot since analog video, but it’s important to keep in mind that it was the basis of how we work with and measure video today. The following chapter discusses the software and test equipment used to measure the digital video signal.