Figure 9.1
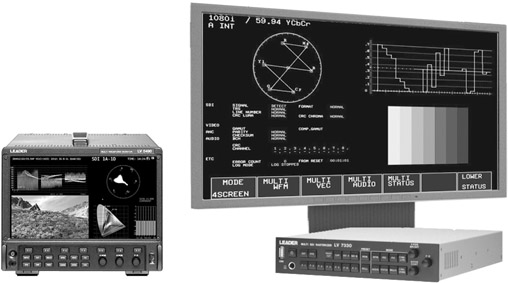
Stand-alone Scope vs Electronics plus Monitor Display
Just as the change from analog to digital has caused significant changes to the video signal, it has also caused similar changes to the way that we measure the video signal. Scopes have changed from oscilloscopes to computer generated graphic displays of the video signals. Some of these instruments take the same stand-alone form as their predecessors. Others, called rasterizers, separate the electronics and display. The advantage of the second format is that a much larger display can be set to show several different displays simultaneously (Figure 9.1).
Figure 9.1
Stand-alone Scope vs Electronics plus Monitor Display
While the digital signal, as with analog, is 1 volt peak-to-peak, some of the components and measurements within that 1 volt are displayed and measured differently on a digital scope. One volt is divided into a thousand units, each referred to as a millivolt, expressed as mV (Figure 9.2). On the graticule, 1 volt of digital video is displayed from –.3 volts (or –300 mV) to a peak of .7 volts (or 700 mV) for a total of 1 volt. Active digital video is displayed between the 0 base line on the graticule and .7 volts. This relates to 100% video, or 100 IRE units on an analog waveform monitor.
Since the digital signal is a stream of digital information, it does not require the same synchronization elements that an analog signal did. Sync is now handled by two short data bursts on each line of video called Timing Reference Signal or TRS. This signal consists of 40 bits, or 4 10-bit words, that contain flags that identify the Start of Active Video (SAV) and End of Active Video (EAV).
When a signal is displayed on a digital waveform monitor, there is no horizontal or vertical sync display within the signal (Figure 9.3). On a vectorscope, there is no synchronizing color burst, which used to appear in the nine o’clock position on the vectorscope graticule.
While analog black was displayed at 7.5 IRE units, true black in a digital signal is 0 volts, and is therefore displayed at the baseline on the graticule. Because the analog transmission system was designed to put out peak power at the lower video levels, if the analog black signal were true black, or 0 units, the analog signal could electrically overload the transmitter. Since a digital signal is a stream of data or digital bits, the levels do not vary over time, but instead remain constant. As a result, digital video can utilize the full range between true black and full luminance.
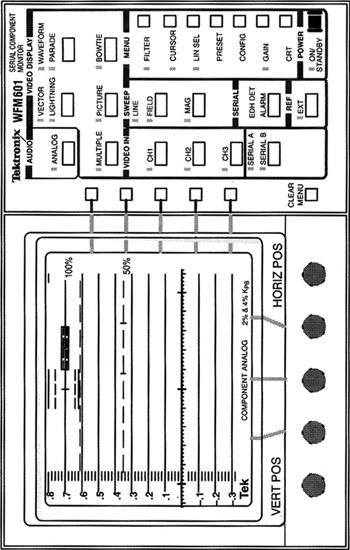
Figure 9.2
Digital Waveform Monitor
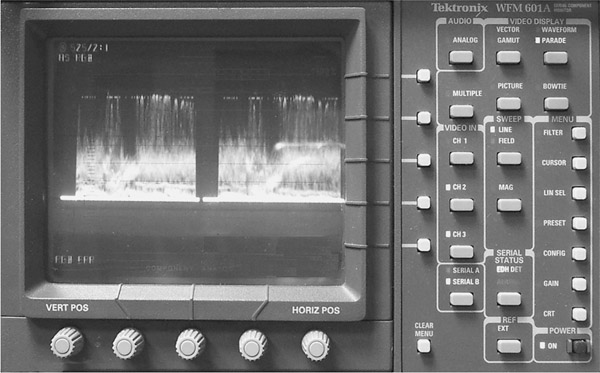
Figure 9.3
Digital Signal without Sync
Unlike the older analog waveform monitors marked in IRE units, the scale on the graticule of a digital scope is marked in millivolts (mV) and ranges from –300 mV to +800 mV, with each major division being further subdivided into five minor divisions, each one representing 20 millivolts (Figure 9.3). The horizontal reference line, or base line, is the heavy line at 0 with three large vertical markings between the –.1 and .1 lines. This line is alternately referred to as the 0% line, 0 mV, zero line, blanking level, and black level.
In addition to the waveform and vector displays from classic analog scopes, there are other signal attributes that can be displayed by modern scopes. Some are common to most models of scopes, and others are proprietary displays unique to a specific manufacture or model. Many video content creators have access to scope displays that are built into a software application on their computers.
In Figure 9.4 (Plate 9), the image, in this case color bars, is displayed on the right side, and the luminance waveform display of the image (color bars) is on the left, as seen in Apple’s Final Cut Pro editing application. This display is a digital recreation of the way analog waveform monitors show luminance levels. One advantage of software-based scopes is that they often show the color they are representing in the display, making it easier for the operator to find the part of the display that represents what is in the video image. If you look at this image in color Plate 9, you can see that each color bar is represented by that bar’s color in the waveform display.
In Figure 9.5 (Plate 10), a normal video scene is represented on the right side of the monitor and the luminance waveform display of
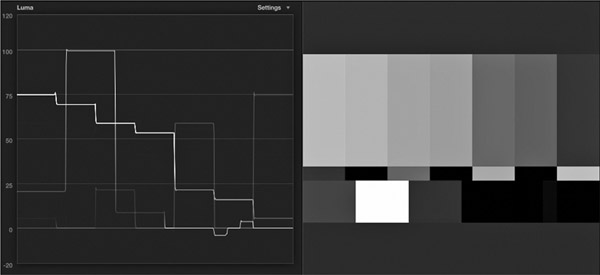
Figure 9.4 (Plate 9)
Color Bars on Software Scope
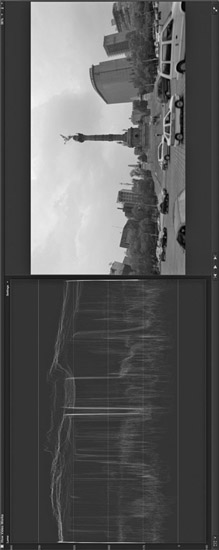
Figure 9.5 (Plate 10)
Normal Video Scene on Software Scope
that image is on the left. In the waveform display, notice the upper luminance levels (appearing almost as horizontal wavy lines), which represent the bright sky. Look closely at that area and you can see where the white clouds start and stop. Notice the sharp vertical V-like dip in the middle of the display. When you look at the image on the right, you see that dip is created from the darkness of the statue, which is much darker than the clouds.
Content creators with a still photography background may recognize the Histogram display (Figure 9.6). The Histogram display is the predominant measuring tool used in image editing programs such as Adobe’s Photoshop. A Histogram shows the distribution of dark and light areas within the digital image as a pixel density display. The Histogram is displayed within horizontal and vertical axes. The horizontal axis represents levels of brightness from black at the left end of the scale to white at the right end of the scale. Pixel density is read on the vertical axis with the density increases shown from low density at the bottom of the vertical axis, to higher density moving up the vertical axis. For example, the mountain-like clump of dense pixels on the right side of the display in Figure 9.6 would represent the brightest part of the image, in this case the white clouds and bright sky.
At each level of brightness along the horizontal axis, the height of the display line indicates the pixel density at that specific light level. The more pixels at that level of brightness, the taller the display line. Thus, dark areas of the image are concentrated on the Histogram display at the left side and bright areas of the image are shown farther to the right along the horizontal axis. Bright images would skew the Histogram toward the right end of the display and predominantly dark images would skew more toward the left. An evenly lit image would distribute the pixel density display more
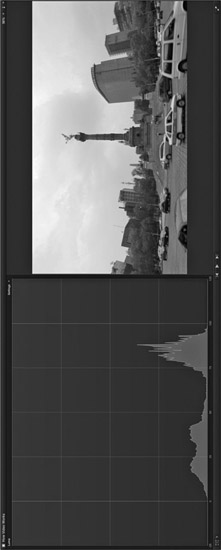
Figure 9.6
Histogram Display
evenly across the Histogram screen. In motion images, the Histogram will be constantly changing as the images change.
NOTE Colors may also be displayed as a Histogram. Each of the colors appears on a display, much the same as luminance does, showing the pixel density or concentration of each color.
Many image-processing programs use the Histogram display as part of their user interface for adjusting levels. In Figure 9.7, the Levels filter in Adobe After Effects shows the Histogram with the black levels set to a typical level, then with the blacks crushed. Note the small triangle below the left end of the Histogram display on the left (circled). This acts as the control for the dark parts of the image and indicates how many dark pixels are being clipped to produce the second image. The image on the right shows the small triangle further to the right, producing an overall darker image.

Figure 9.7
Levels Filter Showing a Default Image (left) and with the Image Made Darker (right)
To measure color, you often use a Vectorscope. Like its analog predecessors, the hue of the color is the position around the circle, while the saturation is the distance outward from the center of the display. In Figure 9.8 (Plate 11), you see a digital representation of a vector display of color bars. Like the color bars image in Figure 9.4, the vectors in this display take on the color they are representing.
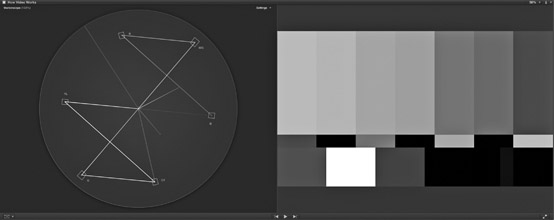
Figure 9.8 (Plate 11)
Color Bars Displayed on Software Vectorscope
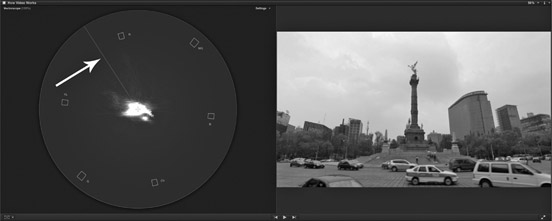
Figure 9.9 (Plate 12)
Video Scene Displayed on Software Vectorscope
One very useful marker here is the line from the center of the scope that extends to the upper left, between the yellow and red vectors. This is the skin tone line, which can be helpful when working with certain close up shots of faces. In Figure 9.9 (Plate 12), the gold statue and yellow flowers are causing the vector display to lean toward the skin tone line.
The amount of color, or saturation, in video is also displayed in a Vectorscope display. In Figure 9.10a (Plate 13), the vector display in the Avid Media Composer color correction tool shows an image with normal saturation. In the second version, Figure 9.10b (Plate 14), the saturation for the same image is increased to 200 percent. Notice the red stripe on the taxi in the middle of the image. On the saturated version, the red energy in the Vectorscope reaches out nearly to the box for the red bar in color bars.
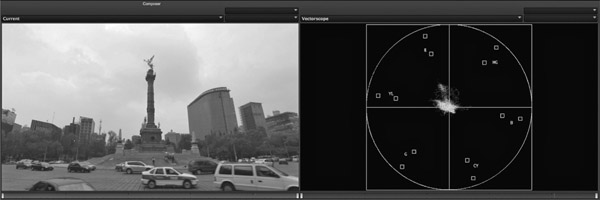
Figure 9.10a (Plate 13)
Normal Saturation
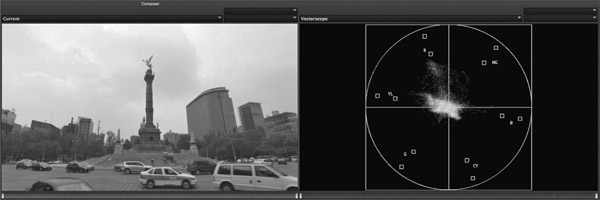
Figure 9.10b (Plate 14)
Increased Saturation
There are other ways to view the color portion of an image in scopes. For example, Figure 9.11a (Plate 15) is a waveform display in what is referred to as Parade Mode. In Parade Mode, the individual color channels are shown one after the other with separate representations for red, green and blue. This display is useful to set color balance in a shot. In the video scene (Figure 9.11b, Plate 16), you can see the blue levels are higher than red or green, meaning there is a bit more blue in the image.
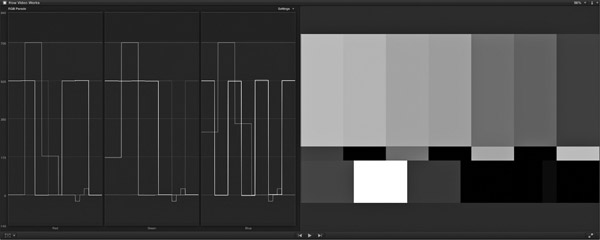
Figure 9.11a (Plate 15)
Color Bars in Parade Mode
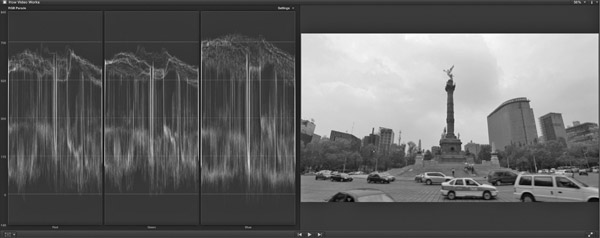
Figure 9.11b (Plate 16)
Video Scene in Parade Mode
In a video signal, and other areas of color reproduction such as video monitors and computer graphics, there is a range or gamut of allowable values that make up a specific color space or color gamut. Color space in video is defined as having three attributes. For example, one color space, RGB, uses the three primary colors, red, green and blue. Another color space uses luminance and color difference signals, or Y, Cr, Cb. HSV space defines color by its Hue, Saturation and Value (or brightness). Each of these color spaces contains colors that may not be reproducible in one of the other color spaces. When thinking of 4K/UHD video, many people may first think of its greater image resolution. But it can also produce a much wider range or gamut of colors than say HDTV video (Figure 9.12 (Plate 17)).
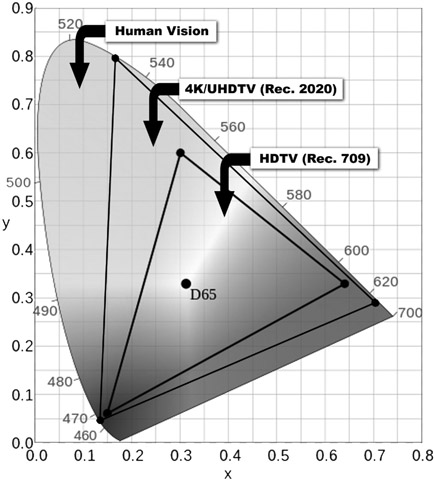
Figure 9.12 (Plate 17)
Color Gamuts for UHDTV and HDTV
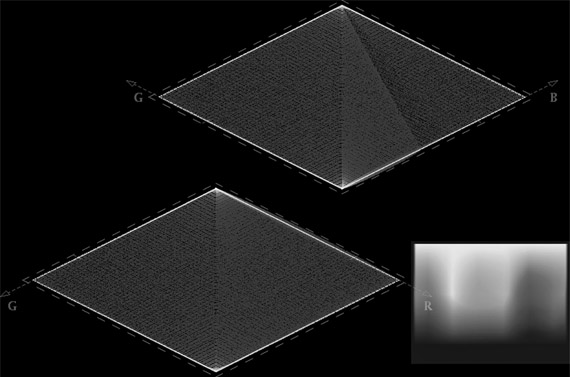
Figure 9.13 (Plate 18)
Diamond Display
The Diamond display is a reliable and useful indicator that an image or graphic falls within color gamut. If a signal extends outside the diamond, it is out of gamut. If it stays within the gamut, it is considered to be legal. The way the gamut is identified on the Diamond display is by simple vectors that represent colors. Together, these vectors form two diamond shapes (Figure 9.13 (Plate 18)). Any signal that is outside of these diamonds, or this color gamut, is outside the color space limits and may not be reproducible by a color monitor or may not translate properly if the signal is converted to another format. This display is used to ensure that the color portion of the signal is not oversaturated. If the signal is oversaturated, the portions of the image outside the diamond area may be clipped or limited to colors within the gamut.
When making adjustments to video signals, you will find that there is an order to adjustment that is most efficient to setting levels. Start by making adjustments first to the luminance part of the image, generally starting with the black adjustment first, followed by the white adjustment. Then, if necessary, progress to the gamma or middle levels. The reason for this order is that the adjustments interact. When you adjust the dark part of the image the brighter sections change as well. Adjustments to the white levels can also influence the dark part of the images, so be sure to recheck the black level before you move on to the gamma.
After adjusting the luminance you can move on to color adjustments. Depending on the device or program you are using, there are several different techniques for this. Which control you start with is not important, but like luminance, there is interaction and overlap so it’s important to keep checking back with your earlier color choices as you progress through the tools.
Many image professionals make a distinction between Color Correction and Color Grading. Generally adjustments made to produce the best possible, technically correct image are considered color correction. When adjustments are used to give a shot a feel or color treatment to enhance story telling or elicit emotion, the changes are often referred to as the color grade. Think of it as the line between the science of good quality video and the art of color as a creative tool.
Monitors built for video production often have scope functions built into their displays that can be switched on and off. This is especially handy for field monitors, as it reduces the amount of gear that a production crew needs to carry. Figure 9.14 shows one manufacturer’s monitor and the type of digital displays it makes available.
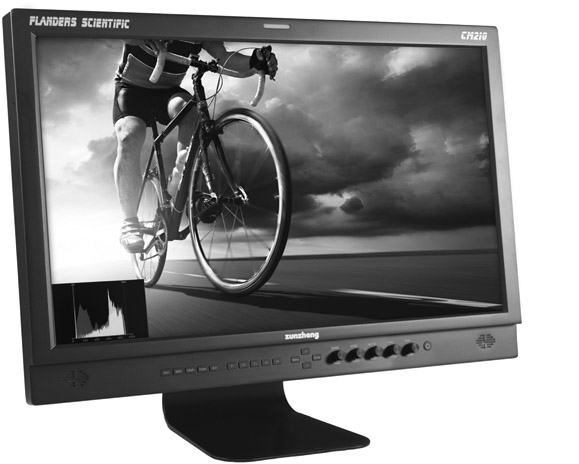
Figure 9.14
Built-In Digital Scope Display