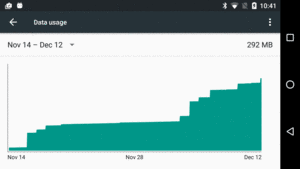
Figure 978: Settings, App, Data Usage Screen, Data Usage Graph
The first step towards addressing bandwidth concerns is to get a better picture of how much bandwidth you are actually consuming, when, and under what conditions. Only then will you be able to determine where your efforts need to be applied and whether those efforts are actually giving you positive results. This chapter will examine a handful of ways you can determine how much bandwidth you are really using in your application.
Understanding this chapter requires that you have read the core chapters and understand how Android apps are set up and operate.
Many times, you are best served by measuring your bandwidth consumption right on the device itself:
Hence, in addition to perhaps other off-device techniques, you really should consider one of the on-device approaches outlined in the following sections.
The preceding chapter outlined how to use the
TrafficStats class to collect metrics on the bandwidth consumed by
applications (including yours) and for the device as a whole. This
gives you the most flexibility, because you can write your own code
to collect whatever portion of this data you need. It can address all
of the bullets shown above, for example.
It is not perfect, though:
For more casual use, the Settings app in most Android devices offers a “Data Usage” screen that shows how much bandwidth has been consumed over a period of time:
Figure 978: Settings, App, Data Usage Screen, Data Usage Graph
Scrolling further down will give you details of what apps were involved in that data usage:
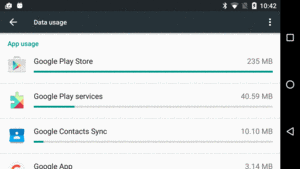
Figure 979: Settings, App, Data Usage Screen, Data Usage “Blame List”
Tapping on any one of those list items will give you a bit more detail, specifically how much of that bandwidth was consumed while the app was in the foreground or the background:
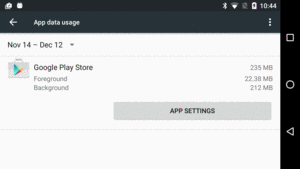
Figure 980: Settings, App, Data Usage Screen, Data Usage App Details
The biggest limitation of TrafficStats is that it only gives you
gross metrics: numbers of bytes, packets, and so on. Sometimes, that
is not enough to help you understand why those bytes, packets, and so
on are actually being sent or received. Sometimes, it would be nice
to understand the traffic in more detail, from the ports and IP
addresses to perhaps the actual data being transmitted. For obvious
security reasons, this is not something an ordinary Android SDK
application can do. However, there are techniques for accomplishing
this, mostly for use over WiFi in your own home or office network.
Some of these are outlined in the following sections.
Wireshark, formerly known as Ethereal, is perhaps the world’s leading open source network traffic analyzer and packet inspector. Using it, you can learn in great detail what is going on with your local network. And, Android provides additional options for you to leverage Wireshark to make sense of application behavior. Wireshark is available for Linux, macOS, and Windows.
There is a lightly-documented -tcpdump switch available on the
Android emulator. If you launch the emulator from the command line
with that switch (plus -avd to identify the AVD file you want to
use), all network access is dumped to your specified log file. You
can then load that data into Wireshark for analysis, via File|Open
from the main menu.
For example, here is a screenshot of Wireshark examining data from such an emulator dump file, in which the emulator was used to conduct a Google search:
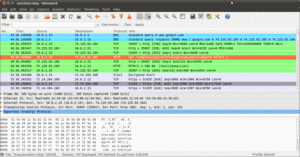
Figure 981: Wireshark examining captured emulator packets
This screenshot shows an HTTP request in the highlighted line in the list, with the hex and ASCII contents of the request shown in the bottom pane.
In terms of using Wireshark to monitor traffic from actual hardware, that is indubitably possible. However, WiFi packet collection is a tricky process with Wireshark, being very dependent upon operating system and possibly even the WiFi adapter chipset. You also get much lower-level information, making it a bit more challenging to figure out what is going on. Attempting to cover all of this is well beyond the scope of this book and the author’s Wireshark expertise.
Sophisticated firewalls sometimes have packet tracing/sniffing capability. In this case, “sophisticated” does not necessarily mean “expensive”, as open source router/firewall distributions, like OpenWrt, can be used for this sort of work. In this case, the router captures the packets and, in many cases, routes them to Wireshark for analysis. Some might offer on-board analysis (e.g., Web interface to packet capture logs).
This is particularly useful on a Windows wireless network. Wireshark has limits, imposed by Windows, that cause some problems when trying to capture WiFi packets. By offloading the packet capture to networking hardware, those limits can be bypassed.
TrafficStats is great for measuring gross bandwidth consumption over
some period of time. However, it requires coding, logging, and your
own analysis mechanism.
In Android Studio, the Android Profiler tool allows you to examine the real-time behavior of your app with respect to various system resources, such as bandwidth consumption:
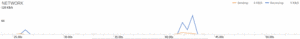
Figure 982: Android Studio, Android Profiler, Network Graph
Clicking on the graph gives you a bit more detail, including the state of various radios and the number of connections that were in use:
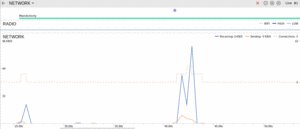
Figure 983: Android Studio, Android Profiler, Detailed Network Graph
This graph comes from a Picasso demo application from earlier in the
book, which retrieves the latest 25 android questions on Stack Overflow
and shows them in a ListView, along with the avatar for the person asking
the question. The graph shows the initial load of data from the Stack
Exchange JSON API, followed about 15 seconds later by some scrolling in the
app, forcing Picasso to go load more avatars.
As this responds in near-real-time to things you do in your app, you can see if the graph shows network accesses at unexpected times, or more bandwidth consumed than you might expect. For example, once all the avatars were loaded, no more bandwidth should be consumed by the Picasso sample app, assuming all the avatars could fit in Picasso’s memory cache.