Figure 988: Android Profiler
Android Studio’s heap analyzer is your #1 tool for identifying memory leaks and the culprits behind running out of heap space. Particularly when used with Android 3.0+ versions of Android, the heap analyzer can tell you:
Android Studio’s heap analyzer builds on the earlier Memory Analysis Tool (MAT), used by Java developers, and by Android developers prior to Android Studio.
However, Android Studio’s heap analysis leaves a lot to be desired. Not only do you have to manually examine and check heap dumps, but you get a lot of false positives due to bugs in Android. A library that helps with both of these issues is LeakCanary, and we will examine it in this chapter as well.
Understanding this chapter requires that you have read the core chapters and understand how Android apps are set up and operate, particularly the chapter on Android’s process model. Reading the introductory chapter to this trail might be nice.
The first question is: when do we bother looking for leaks? Complex apps are complex, and so we might spend a lot of time looking for leaks that either do not exist or do not matter much.
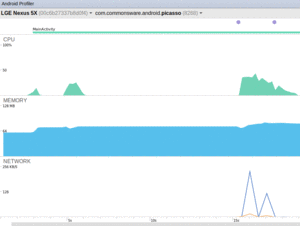
In Android Studio, the Android Profiler tool will allow you to examine the real-time behavior of your app with respect to various system resources, such as heap space in your app:
Figure 988: Android Profiler
Clicking on the memory portion of the graphs will bring up details for the memory consumption:
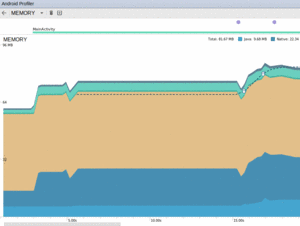
Figure 989: Android Profiler, Showing Memory Details
The color coding shows the different types of memory being consumed. For example, the largest area in this graph is the tan “Graphics” area. The sample app being tested here happens to be a Picasso sample app from the chapter on Internet access. However, “Graphics” does not refer to bitmaps, but rather is “used for graphics buffer queues to display pixels to the screen, including GL surfaces, GL textures, and so on”, according to the documentation. Generally speaking, you will be most interested in:
On Android 5.0+ devices, the memory usage can also fall… while your app is no longer in the foreground:
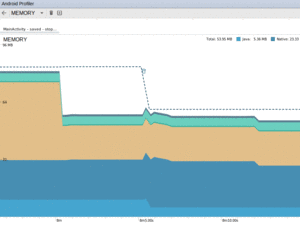
Figure 990: Android Studio, Android Monitor, Memory Tab, Showing Shrunken Heap
The major drop in the memory usage came with the release of some of those GL buffers and textures, some of which are no longer necessary when the app no longer is in the foreground from a UI standpoint.
The major drop in the number of allocated Java objects presumably came from ART. Once your app is no longer in the foreground, ART will do a more aggressive garbage collection run, including moving objects in heap space to coalesce free blocks. If this frees up some of the allocated pages from the OS, ART can then free those pages, returning the memory to the OS and reducing our app’s overall memory footprint.
You can also perform a manual garbage collection run by tapping the “garbage can” icon in the toolbar. Other toolbar buttons include:
The first step to analyzing what is in your heap is to actually get your hands on what is in your heap. This is referred to as creating a “heap dump” — what amounts to a log file containing all your objects and who points to what.
In the memory details view of the Android Profiler tool in Android Studio, you can create a heap dump by clicking the toolbar button that looks like an open square with a downwards-pointing arrow in it, adjacent to the “garbage can” icon for forcing garbage collection:

Figure 991: “Dump Java Heap” Toolbar Button in Android Profiler
Tap that, then go get a cup of coffee (or another preferred beverage). Generating a heap dump used to take a few seconds. With Android Studio 3.0, it takes much longer than that.
Eventually the bottom portion of the Android Profiler pane will show the results of the heap dump.
Another possibility is to trigger the heap dump yourself from code.
The dumpHprofData() static method on the Debug class (in the
android.os package) will write out a heap dump to the file you
indicate. Since you will need to
transfer them off the device or emulator, it will be simplest to specify
a path to a file on external storage, which means that your project
will need the WRITE_EXTERNAL_STORAGE permission.
To view the results in Android Studio, you will need to transfer the file from wherever you saved it on the device or emulator to your development machine. For example, you can double-click on it in the Device File Explorer.
The UI that you get has the same basic functionality as does the UI from a manually-requested heap dump from the Android Profiler, though they look somewhat different.
Having a heap dump is nice, but we need tools to determine exactly what is in there and what that means for our app. Android Studio lets us examine a heap dump to see what is going on and perhaps identify leaks.
There are several pieces to the UI that we use to examine a heap dump.
We start off with a class list table:
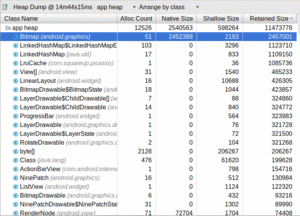
Figure 992: Android Studio Heap Dump, Class List Table
This table comes filled in with a list of classes and
primitive arrays, sorted by “retained size”. This indicates how
much memory those objects, and everything that they point to, consume. So,
for example, this heap dump contains 51 Bitmap objects with a retained
size of 2,457,001 bytes.
The other columns are:
Bitmap)Roughly speaking, the sum of the “Native Size” and the “Shallow Size” equals the amount of space that the objects are taking up directly themselves, not counting references to other objects.
The drop-down above the table that defaults to “App heap” will have other options on Android 5.0+ devices. Specifically, you can switch between the app heap, the undocumented “default heap”, the similarly-undocumented “image heap”, and the equally-undocumented “zygote heap”. The zygote is a core OS process, started when the device boots; all Android SDK apps are forked off of the zygote. Given that and other announced ART tidbits suggests that:
In general, you want the app heap, which is what appears by default.
The drop-down above the table that defaults to “Arrange by class” can be toggled to “Arrange by package”, which turns the table into a tree-table, for navigation by Java package name, plus primitive arrays:
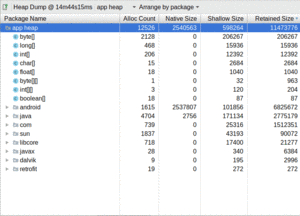
Figure 993: Android Studio Heap Dump, Package Tree View, As Initially Launched
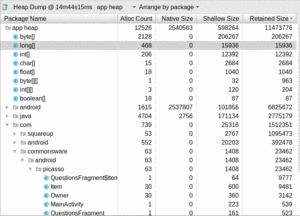
Figure 994: Android Studio Heap Dump, Package Tree View, Drilled Down Into Packages
This view will make it easier for you to find classes from your app or from well-known libraries, since those classes will be clustered into their own pacakges.
If you click on a class in either the class list view or the package tree view, a table on the right will show a list of the instances of that class that were found in your heap:

Figure 995: Android Studio Heap Dump, Instance List
The “shallow size” refers to the number of bytes consumed directly by that particular instance, such as by primitive fields. The “retained size” roughly equates to “how much memory can this object be blamed for”. In other words, if that object could be garbage-collected, how much would we recover, not only from the “shallow size” but from other objects uniquely referenced by this object?
The “depth” refers to how many hops away from a garbage collection root (“GC root”) this object is.
This table initially appears as a simple table. In reality, though, it is a tree table. You can expand nodes in the tree to drill down into all the objects referenced by a particular instance, and all objects that reference the instance in question:
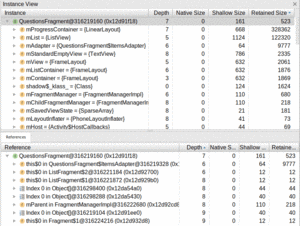
Figure 996: Android Studio Heap Dump, Instance Tree
You can further expand the References tree to see who references some of those references, and so on.
All of that is just great, but you still need to determine if you have a memory leak and, if so, where is it coming from.
Basically, you rummage through the class list or package tree, looking for classes that either:
Bear in mind that the act of generating a heap dump only logs objects that are reachable from other objects, or themselves are considered “garbage collection roots” (a.k.a., “GC roots”). Any objects that are actual garbage, but perhaps have not yet been collected by the garbage collector, do not appear in the dump. Hence, if you see it in the heap snapshot tab, the objects are “real”, not uncollected garbage.
Conversely, just because you find an object in the heap does not mean that it is truly “leaked”. For example:
With all that in mind, let’s look at a few common scenarios of leaking objects, to see what those leaks look like when we do a heap dump and analyze that dump in Android Studio.
The
Leaks/StaticWidget
sample project does something naughty:
package com.commonsware.android.button;

import android.app.Activity;
import android.os.Bundle;
import android.widget.Button;

public class ButtonDemoActivity extends Activity {
  private static Button pleaseDoNotDoThis;

  @Override
  public void onCreate(Bundle savedInstanceState) {
    super.onCreate(savedInstanceState);
    setContentView(R.layout.main);

    pleaseDoNotDoThis=(Button)findViewById(R.id.button1);
  }
}We take a widget (specifically a Button) and put
it in a static data member, and never replace it with null.
As a result, even if the user presses BACK to get out of the
activity, the static data member holds onto Button, which itself
has a reference back to our Activity.
If you run the app, press BACK to exit the activity, and generate a heap
dump of this process, you will see that ButtonDemoActivity appears in
the dump:
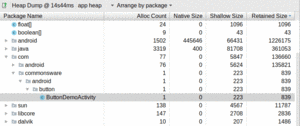
Figure 997: Heap Dump UI, Showing Leaked Activity
If you click on ButtonDemoActivity and poke around the References tab,
you will find where our static field shows up:
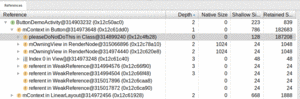
Figure 998: Heap Dump UI, Showing Static Field
The leaked object (ButtonDemoActivity) is referenced by an mContext
field in a static pleaseDoNotDoThis field in ButtonDemoActivity
itself. The latter item has a depth of 0, so we know that it is a
GC root. The hope is that you will recognize some of the items shown
here (e.g., field names like pleaseDoNotDoThis) and can see how those
items affect the ability for Android to garbage collect the leaked object.
The
Leaks/LeakedThread
sample project does something else naughty:
package com.commonsware.android.leak.thread;

import android.app.Activity;
import android.os.Bundle;
import android.os.SystemClock;

public class LeakedThreadActivity extends Activity {
  @Override
  public void onCreate(Bundle savedInstanceState) {
    super.onCreate(savedInstanceState);
    setContentView(R.layout.main);

    new Thread() {
      public void run() {
        while(true) {
          SystemClock.sleep(100);
        }
      }
    }.start();
  }
}Here, we kick off a Thread from onCreate() of our activity and have
it enter a pseudo-polling loop, sleeping for 100ms per pass through the
loop.
This is naughty for all sorts of reasons:
Thread
The latter two flaws combine to cause a memory leak.
So, we can go through the package tree view, find the Java packages for the code, and see what objects from those packages are outstanding:
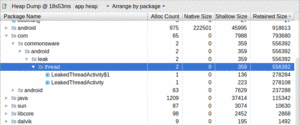
Figure 999: Heap Dump UI, Showing Classes In App Package
Here, we see that we have leaked two objects. One is LeakedThreadActivity.
The other is an anonymous inner class of LeakedThreadActivity
(assigned the name LeakedThreadActivity$1 by the Java compiler).
Clicking on the activity and examining the first child in the reference tree once again discloses the leak:

Figure 1000: Heap Dump UI, Showing Another Leak and Its Path to a GC Root
Our zero-depth entry is threads, which is basically the collection
of all Java Thread objects that are still alive in this process. One
of those is our anonymous inner class (this$0 in LeakedThreadActivity$1), which
holds onto the activity instance.
To avoid this sort of leak:
In the chapter on threads, we had an AsyncTask demo
app that used a retained fragment to manage the task. That fragment was
a ListFragment, and it was responsible for displaying the Latin words
as those words were “downloaded” in the background by the task. Google
is not a fan of retained fragments having widgets… and the
Leaks/ConfigChange
sample project demonstrates why.
The change in this project versus the original mostly comes down to a
humble Button, which we will use to restart the download from the
beginning once it has completed:
  <Button
    android:id="@+id/again"
    android:layout_width="match_parent"
    android:layout_height="wrap_content"
    android:text="@string/btn_again"/>
</LinearLayout>The Button itself is stored as a field in the fragment, named
btnAgain. This already raises some concerns, if we are retaining the
fragment. However, this approach is safe, if and only if we clear out
or refresh that field on a configuration change. For example, if you
used findViewById() to get the Button and assign it to btnAgain
in onViewCreated(), you would not have a problem, as onViewCreated()
is called as part of the configuration change, even for retained fragments.
However, this sample app instead lazy-initializes that data member, via
a getAgain() getter method:
  private Button getAgain() {
    if (btnAgain==null) {
      btnAgain=(Button)getView().findViewById(R.id.again);
    }

    return(btnAgain);
  }
That getter method is used in the rest of the fragment to retrieve the
Button, such as in onViewCreated():
  @Override
  public void onViewCreated(View v, Bundle savedInstanceState) {
    super.onViewCreated(v, savedInstanceState);

    getListView().setScrollbarFadingEnabled(false);
    setListAdapter(adapter);

    getAgain().setOnClickListener(this);

    if (task!=null) {
      getAgain().setEnabled(false);
    }
  }
…onClick() (as the fragment now implements the View.OnClickListener
interface):
  @Override
  public void onClick(View v) {
    getAgain().setEnabled(false);
    adapter.clear();
    task=new AddStringTask();
    task.execute();
  }
…and onPostExecute() of the AsyncTask:
    @Override
    protected void onPostExecute(Void unused) {
      task=null;
      getAgain().setEnabled(true);
    }
Nowhere do we set btnAgain to null, including after a configuration change.
So, when the activity starts up, everything is fine. However, when we
rotate the screen or otherwise undergo a configuration change, the fragment
misbehaves. getAgain() says “hey, btnAgain is already initialized, so
I can skip the findViewById() call”. But we have a different Button
now after the configuration change, and btnAgain is pointing to the
original Button. That original Button is tied to the original, pre-configuration
change Activity instance, and we have a leak, until the second
Activity is destroyed.
If you run the app, rotate the screen, and then capture a heap dump, the
snapshot will show two outstanding instances of AsyncDemo:

Figure 1001: Heap Snapshot Tab, Showing Two Activities Instead of One
However, this leak will be difficult to diagnose, for two reasons:
When the author of this book was testing the previous section’s demo,
he was trying to use Android Studio to confirm that the leak was caused
by the Button. As part of that analysis, he went back to the original
Threads/AsyncDemo
sample project… and Android Studio said that it was leaking the
activity.
At this point, a long series of expletives could be heard emanating from the author’s office.
To help try to suss out exactly what was going on, the author turned to a library that you may wish to consider: LeakCanary. And, as it turns out, LeakCanary indicates that the Android Studio-reported leak is a false positive, and that there is no serious memory leak.
LeakCanary is another library from the indefatigable developers at Square. It allows you to monitor certain objects to see if they get leaked. In particular, if you use the standard setup, it will automatically watch for activities that get leaked. When it detects a leak, it will dump the heap, then read in the heap dump on the device and try to determine where the leak is coming from. To help with that, it has a roster of known false positives that it can filter out, and the authors encourage the community to provide more false positives where possible.
If a leak is detected, but it is a false positive, a message will be
dumped to Logcat with the details. If a leak is detected that appears
to be genuine, a Notification will appear, leading to an activity that
will show you the source of the leak.
Adding LeakCanary to a project is fairly easy, courtesy of some well-designed defaults and a tricky use of build type-specific dependencies.
We only want LeakCanary to be used in debug builds, not release
builds. Even if we are leaking memory, the effects of LeakCanary (including
slow heap dumps) are not the sort of thing that we should be putting users
through.
Yet, at the same time, we will need a bit of Java code to hook up LeakCanary
itself. Ordinarily, this would require setting up src/debug/ and
src/release/ source sets and trying to isolate the LeakCanary-specific
code to the debug build.
LeakCanary addresses this by publishing two versions of the artifact:
the real one (for debug) and a no-op one (for release). The public
API for each is identical, so your application code can build in either
case. It just so happens that the no-op artifact does nothing in response
to the API, as it merely contains stubs necessary to satisfy the API.
This is much simpler, and for coarse-grained APIs is a technique
worth emulating.
The
Leaks/AsyncTask
sample project is akin to the Threads/AsyncDemo sample project,
but uses LeakCanary (and a ListView rather than a RecyclerView).
In its app module’s build.gradle file, we have
the twin dependencies, scoped for the appropriate build types:
dependencies {
  implementation 'com.android.support:support-fragment:27.1.1'
  debugImplementation 'com.squareup.leakcanary:leakcanary-android:1.6.1'
  releaseImplementation 'com.squareup.leakcanary:leakcanary-android-no-op:1.6.1'
}
If you have your own custom build types, you would need to adjust the
conditional dependencies to match, using the no-op one for any build
that should not have the real LeakCanary in it.
Usually, if you are going to use LeakCanary, it is with the intent
of availing yourself of its mostly-automatic detection of leaked activities.
The recipe for doing that involves calling install() on the LeakCanary
class when your process starts, such as in onCreate() of a custom
Application subclass.
The sample app has such a class, CanaryApplication:
package com.commonsware.android.async;

import android.app.Application;
import com.squareup.leakcanary.LeakCanary;

public class CanaryApplication extends Application {
  @Override
  public void onCreate() {
    super.onCreate();

    if (LeakCanary.isInAnalyzerProcess(this)) {
      // LeakCanary is processing a heap dump here; please do not disturb!
      return;
    }

    LeakCanary.install(this);

    // do your normal initialization work here
  }
}
When LeakCanary detects a possible leak, it collects and analyzes a heap
dump. The analysis is performed in a separate process, so its own memory usage
does not affect your main process’ heap limit. However, the same custom
Application is used for every one of your app’s processes. LeakCanary.isInAnalyzerProcess()
returns true if your Application code is running in this analysis process,
so you can skip any initialization work that you might already have in a custom
Application. In the “real” app process, you use LeakCanary.install() to
set up LeakCanary for automatic analysis.
This Application subclass is registered in the manifest, via android:name
on the <application> element:
  <application
    android:name=".CanaryApplication"
    android:icon="@drawable/ic_launcher"
    android:label="@string/app_name"
    android:theme="@android:style/Theme.Holo.Light.DarkActionBar">
    <activity
      android:name=".AsyncDemo"
      android:label="@string/app_name">
      <intent-filter>
        <action android:name="android.intent.action.MAIN"/>

        <category android:name="android.intent.category.LAUNCHER"/>
      </intent-filter>
    </activity>
  </application>
And that is all that you need for basic integration.
LeakCanary.install() returns a RefWatcher object. If all you want to
do is use the semi-automatic activity leak detection, you can safely ignore
this return value.
However, if you would like to watch for other objects leaking — fragments,
domain model objects, threads, etc. — you can hang onto that RefWatcher
and, where needed, call watch() on it to add an object to watch for
leaks. Watching for leaks is not terribly expensive but not free, so be
judicious in what you are watching.
Once you have LeakCanary integrated, you can try out your app and see if it leaks.
Note that the quasi-automatic activity leak detection is based upon the activity lifecycle. LeakCanary considers an activity to be leaked if it is destroyed and there are still unknown strong references to it. This assume that your activity is destroyed in an ordinary fashion. Hence, how you use your app influences what leaks you find. For example, if you terminate the app process (e.g., swipe away the associated task in the overview screen), you will not find out if any live activities were leaked. Where possible, try to use the BACK button to step your way out of the app when testing, to ensure everything gets destroyed and the most leaks can be found.
If LeakCanary detects a possible leak, it will start displaying notifications to let you know about this and what is going on:
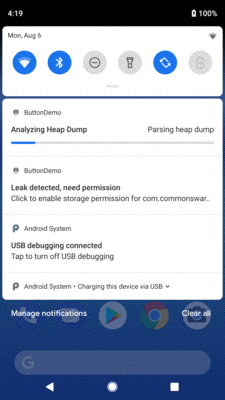
Figure 1002: LeakCanary Notifications
LeakCanary wants WRITE_EXTERNAL_STORAGE rights, and so the first time you
use it with an app that does not request that permission on its own, you will
get a notification that leads you to grant the permission.
Note that it may take a few moments after the activity is destroyed before the message appears, and that it may take a long time after the message disappears before you get final results.
Eventually, though, if there is a leak detected, you will get a notification advising you of that fact:
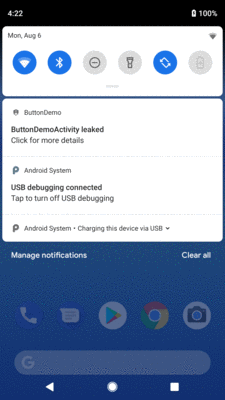
Figure 1003: LeakCanary Confirmation Notification
The
Leaks/StaticWidgetLC
sample project is a clone of the static widget leak scenario from
earlier in this chapter. This version has LeakCanary integrated in, though,
and LeakCanary catches this leak.
So, after running the app, pressing BACK to destroy the activity, and waiting a bit for the heap analysis to finish, you will eventually get a “ButtonDemoActivity leaked” notification. Tapping that shows a “timeline”-style list of objects, starting with a GC root and ending in the leaked object:
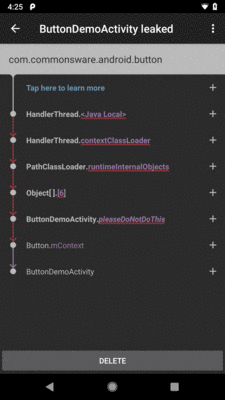
Figure 1004: LeakCanary Diagnostic Activity, As Launched From the Notification
Here, we see that pleaseDoNotDoThis holds a reference to the Button,
which holds a reference to the Activity.
This has two advantages over using Android Studio’s own leak analysis:
The overflow menu has an option to “Share info”, which sends a complicated
report to your favorite ACTION_SEND
implementation (e.g., an email client). “Share heap dump”, also in the
overflow, forwards the heap dump itself via ACTION_SEND, for you to
perhaps get over to Android Studio for deeper analysis if that proves
necessary.
Pressing the up navigation arrow in the action bar brings up a list of the saved leak reports:
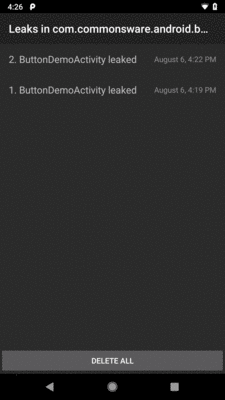
Figure 1005: LeakCanary Report Roster
The “DELETE” button on the diagnostic activity deletes that report; the “DELETE ALL” button on the roster activity deletes all saved reports.
The LeakCanary project documentation outlines many other possibilities for tailoring LeakCanary’s behavior, including: