Figure 1006: Developer Options in Android 4.4, Showing “Process Stats”
Your application heap is your little corner of the system RAM on the device that you focus on in your Java development. However, there are other things that you might do that consume system RAM, such as use the NDK to add C/C++ code to your app. How much system RAM you consume overall will have an impact on user acceptance of your app, as the more RAM you use, the more frequently the user’s other apps are terminated to make room for you. And, as a result, the more system RAM you use, the more likely it is that your process will be terminated when you are not in the foreground, to free up RAM for other apps. Hence, while system RAM is not something you necessarily think about as often as you do your application heap, it is something that you should pay attention to, at least a little bit.
This chapter will explain a bit more about the relationship between your app and system RAM, how you can measure how much system RAM your app is consuming, and how you can reduce that consumption.
Understanding this chapter requires that you have read the core chapters and understand how Android apps are set up and operate, particularly the chapter on Android’s process model. Reading the chapter on issues with the application heap is also a good idea.
Alas, we have not invented the device with infinite RAM, nor the application that takes zero memory. In fact, our devices have fairly limited RAM (e.g., 1GB), and our apps therefore fight over that memory. That includes both apps that the user runs explicitly (e.g., via the home screen launcher) and apps that run based upon external factors (e.g., the app that receives a GCM push event and uses that trigger to update some data).
The good news is that the user tends to be a bit oblivious to all of the comings and goings of apps. Android keeps process around while it can and terminates them as needed to free up system RAM for other processes, without the user’s explicit involvement. Of course, power users might try to employ “task managers” and the like to be more involved in decision-making, but that’s something they opted into, not something that was forced upon them, the way that older mobile operating systems like Windows Mobile required.
However, there is a fundamental assumption in Android that apps play fair. The per-process heap limits — and the fact that apps do not necessarily have to use all the way up to those limits — means that a given Android device can power many processes at once. That starts to break down when apps do various things to consume an excessive amount of system RAM, more than what the per-process heap limit would normally constrain them to. Hence, it is a good idea to keep tabs on how much you use of system RAM, so that you can be a “good citizen” and not cause the user undue angst or force them to employ task managers to try to keep you in line.
There are many factors that contribute towards your system RAM consumption, including:
.so files) from the NDKIn addition, the reporting tools usually allocate a portion of shared RAM to your
app. Your app’s process is forked from the zygote process, which contains the
Dalvik runtime environment, framework JAR (for all those android.* classes),
and related libraries. Your app shares that memory with all other processes forked
from the zygote. However, to reflect the fact that there is this overhead,
your app’s share of it (roughly calculated as the amount of shared RAM divided by
the number of processes) tends to get added to your memory consumption totals.
Figuring out how much RAM your application is using is not easy. Or, as Dianne Hackborn put it:
Note that memory usage on modern operating systems like Linux is an extremely complicated and difficult to understand area. In fact the chances of you actually correctly interpreting whatever numbers you get is extremely low. (Pretty much every time I look at memory usage numbers with other engineers, there is always a long discussion about what they actually mean that only results in a vague conclusion.)
Fortunately, particularly in Android 4.4, a fair bit of work has gone into trying to help us determine how much our apps impact system RAM.
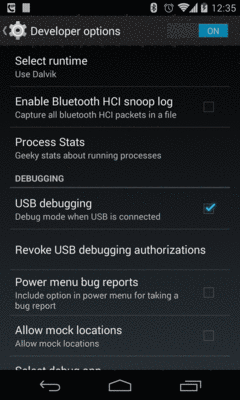
On Android 4.4, in Settings > Developer Options, you will find:
Process Stats: Geeky stats about running processes
(here, “geeky” is presumably used as a term of endearment)
Figure 1006: Developer Options in Android 4.4, Showing “Process Stats”
Tapping on that entry brings up a screen that describes the current state of the system, with respect to RAM:
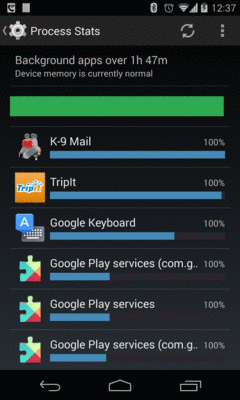
Figure 1007: Process Stats in Android 4.4
While it may look simple, this screen, and its child screens, are remarkably complex, particularly once you start playing around with various options from the action bar overflow.
At the top, you will see:
The bar is not so much a timeline as a stacked bar chart, where the mix of red and yellow indicates the amount of time the device was in a low-memory state, contrasted with the green “normal” state.
Usually, your device should be “normal” with a mostly-green or completely-green bar.
The list beneath the summary shows some running processes. What is included in this list depends on what mode Process Stats in running in. The summary indicates that our mode is “Background apps”. There are three major categories for apps:
By default, Process Stats will show background processes.
Each row in the list shows details for a specific process:
The list is sorted in order of “relative computed memory load”.
Many background apps will have a running percentage of 100%, indicating that they
have an always-running service. Those with a percentage less than 100% indicate
an app that had a service running at the point in time of the Process Stats snapshot
that you are examining, but did not necessarily have a service running for the entire
timeframe (e.g., periodic IntentService doing background work)
There is a “refresh” icon in the action bar that will update the current view to reflect changes since you last opened or refreshed the screen.
How long the timeframe is depends a bit upon device operation and also on the “Duration” entry in the overflow menu:
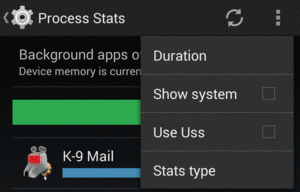
Figure 1008: Process Stats Overflow in Android 4.4
Tapping that gives you a roster of available timeframes:

Figure 1009: Process Stats Duration Options in Android 4.4
Even though these items render with checkboxes, they function as radio buttons, so whatever you tap on becomes the new duration. Upon making a change, the summary area will reflect the newly-chosen duration. Note that this choice is not persistent, as exiting Process Stats via the BACK button and re-entering it returns you to a three-hour duration.
If your application is not showing up in the background roster, it may be classified as “foreground” (e.g., if you have a foreground service) or “cached” (if not). The “Stats type” overflow option will let you toggle between these categories, to see what processes are reported in each.
Note that an app can appear in more than one roster, since the roster is by process. For example, at the time of this writing, Evernote appears in the author’s Nexus 4 both in “foreground” and in “cached”, for separate processes.
As with the duration, the choice of category is not persistent, and you will be returned to the background process roster if you exit Process Stats via the BACK button and later return to it.
Tapping on an item in the list will bring up details about that particular app and process:
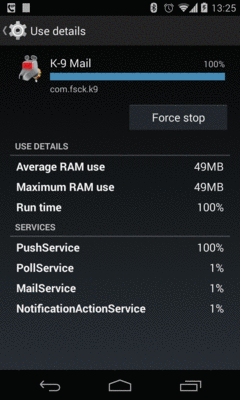
Figure 1010: Process Stats Details for K-9 Mail
The “Average RAM use” value shows how much system RAM is attributed to your app. This will include:
This is known as “Proportional Set Size” or “PSS” in Linux, and is a common way of coming up with a simple number for the amount of RAM that a particular process is responsible for.
The blue bar is based on this average RAM use (or PSS) value, multiplied by the percentage of the time that the process was running.
The “Maximum RAM use” value is the highest PSS associated with your process during the period under examination.
Also listed are the services of your app and the percentage of time that they were
in a running state. Everlasting services will show up as 100%, while transient
services (e.g., IntentService) will show up with a much smaller percentage.
Ideally:
The better you are in these areas, the more likely it is that you are not seriously impacting system RAM.
The data that powers the Process Stats screen in Settings is also available
as human-readable text output, using the adb shell dumpsys procstats command,
against your Android 4.4 device or emulator.
Running that command will give you three blocks of information:
This can be a long report, even for just one of those blocks. For example, here is the last-3-hours block, run on the author’s personal Nexus 4:
AGGREGATED OVER LAST 3 HOURS:
  * com.android.bluetooth / 1002:
           TOTAL: 100% (7.8MB-7.8MB-7.8MB/7.0MB-7.0MB-7.0MB over 2)
          Imp Fg: 100% (7.8MB-7.8MB-7.8MB/7.0MB-7.0MB-7.0MB over 2)
  * com.csipsimple:sipStack / u0a135:
           TOTAL: 100% (10MB-10MB-10MB/9.2MB-9.2MB-9.2MB over 1)
          Imp Fg: 99% (10MB-10MB-10MB/9.2MB-9.2MB-9.2MB over 1)
         Service: 1.2%
  * system / 1000:
           TOTAL: 100% (56MB-60MB-63MB/51MB-55MB-58MB over 2)
      Persistent: 100% (56MB-60MB-63MB/51MB-55MB-58MB over 2)
  * com.android.nfc / 1027:
           TOTAL: 100% (6.3MB-6.3MB-6.3MB/5.4MB-5.5MB-5.5MB over 2)
      Persistent: 100% (6.3MB-6.3MB-6.3MB/5.4MB-5.5MB-5.5MB over 2)
  * tunein.player.pro / u0a97:
           TOTAL: 100% (8.2MB-8.2MB-8.2MB/6.9MB-6.9MB-6.9MB over 3)
         Service: 100% (8.2MB-8.2MB-8.2MB/6.9MB-6.9MB-6.9MB over 3)
  * android.process.acore / u0a0:
           TOTAL: 100% (15MB-15MB-15MB/14MB-14MB-14MB over 1)
          Imp Fg: 0.00%
         Service: 100% (15MB-15MB-15MB/14MB-14MB-14MB over 1)
  * com.google.android.gms / u0a23:
           TOTAL: 100% (16MB-16MB-16MB/14MB-14MB-14MB over 2)
         Service: 100% (16MB-16MB-16MB/14MB-14MB-14MB over 2)
  * com.espn.radio:com.urbanairship.process / u0a142:
           TOTAL: 100% (6.6MB-6.6MB-6.6MB/5.3MB-5.3MB-5.3MB over 3)
         Service: 100% (6.6MB-6.6MB-6.6MB/5.3MB-5.3MB-5.3MB over 3)
  * com.android.launcher / u0a35:
           TOTAL: 100% (73MB-73MB-73MB/69MB-69MB-69MB over 8)
             Top: 100% (73MB-73MB-73MB/69MB-69MB-69MB over 8)
  * com.android.systemui / u0a116:
           TOTAL: 100% (38MB-39MB-41MB/35MB-37MB-38MB over 2)
      Persistent: 100% (38MB-39MB-41MB/35MB-37MB-38MB over 2)
  * com.android.phone / 1001:
           TOTAL: 100% (26MB-26MB-26MB/25MB-25MB-25MB over 2)
      Persistent: 100% (26MB-26MB-26MB/25MB-25MB-25MB over 2)
  * com.tripit / u0a85:
           TOTAL: 100% (44MB-44MB-44MB/41MB-41MB-41MB over 1)
          Imp Fg: 0.72%
         Service: 99% (44MB-44MB-44MB/41MB-41MB-41MB over 1)
  * com.google.process.location / u0a23:
           TOTAL: 100% (17MB-17MB-17MB/14MB-14MB-14MB over 2)
          Imp Fg: 100% (17MB-17MB-17MB/14MB-14MB-14MB over 2)
  * com.google.android.inputmethod.latin / u0a34:
           TOTAL: 100% (37MB-37MB-37MB/36MB-36MB-36MB over 2)
          Imp Fg: 100% (37MB-37MB-37MB/36MB-36MB-36MB over 2)
  * com.google.process.gapps / u0a23:
           TOTAL: 100% (16MB-16MB-16MB/14MB-14MB-14MB over 2)
         Service: 100% (16MB-16MB-16MB/14MB-14MB-14MB over 2)
  * com.fsck.k9 / u0a128:
           TOTAL: 100% (50MB-50MB-50MB/47MB-47MB-47MB over 2)
         Service: 100% (50MB-50MB-50MB/47MB-47MB-47MB over 2)
  * com.rememberthemilk.MobileRTM / u0a89:
           TOTAL: 17%
          Imp Fg: 8.6%
         Service: 8.6%
        Receiver: 0.11%
        (Cached): 83% (36MB-36MB-37MB/34MB-35MB-35MB over 9)
  * android.process.media / u0a15:
           TOTAL: 8.9% (5.4MB-5.4MB-5.4MB/4.6MB-4.6MB-4.6MB over 1)
         Service: 8.9% (5.4MB-5.4MB-5.4MB/4.6MB-4.6MB-4.6MB over 1)
        Receiver: 0.01%
        (Cached): 91%
  * com.google.android.apps.maps / u0a39:
           TOTAL: 4.2%
         Service: 4.2%
        (Cached): 96% (121MB-121MB-121MB/105MB-105MB-106MB over 4)
  * com.google.android.apps.genie.geniewidget / u0a21:
           TOTAL: 3.9% (5.6MB-5.6MB-5.6MB/4.7MB-4.7MB-4.7MB over 1)
         Service: 3.9% (5.6MB-5.6MB-5.6MB/4.7MB-4.7MB-4.7MB over 1)
        Receiver: 0.00%
        (Cached): 96% (5.7MB-5.7MB-5.7MB/4.8MB-4.8MB-4.8MB over 1)
  * com.google.android.tts / u0a29:
           TOTAL: 1.7%
         Service: 1.7%
        (Cached): 20% (24MB-24MB-24MB/23MB-23MB-23MB over 2)
  * com.evernote / u0a86:
           TOTAL: 0.41%
          Imp Bg: 0.31%
         Service: 0.10%
        Receiver: 0.00%
        (Cached): 100% (15MB-15MB-16MB/14MB-14MB-14MB over 4)
  * org.mozilla.firefox / u0a100:
           TOTAL: 0.39%
         Service: 0.39%
        (Cached): 100% (4.4MB-6.2MB-7.4MB/3.5MB-5.2MB-6.4MB over 5)
  * com.csipsimple / u0a135:
           TOTAL: 0.18%
          Imp Fg: 0.02%
         Service: 0.14%
        Receiver: 0.02%
        (Cached): 100% (4.2MB-4.2MB-4.2MB/3.2MB-3.2MB-3.2MB over 8)
  * com.stackexchange.marvin / u0a154:
           TOTAL: 0.17%
         Service: 0.17%
        Receiver: 0.00%
        (Cached): 100% (32MB-32MB-32MB/30MB-30MB-30MB over 2)
  * com.google.android.youtube / u0a67:
           TOTAL: 0.12%
         Service: 0.01%
        Receiver: 0.11%
        (Cached): 8.9% (9.3MB-9.3MB-9.3MB/8.0MB-8.0MB-8.0MB over 1)
  * com.guywmustang.silentwidget / u0a78:
           TOTAL: 0.05%
         Service: 0.05%
        Receiver: 0.00%
        (Cached): 100% (3.3MB-3.3MB-3.4MB/2.7MB-2.7MB-2.7MB over 4)
  * com.google.android.deskclock / u0a14:
           TOTAL: 0.03%
        Receiver: 0.03%
        (Cached): 100% (4.0MB-4.0MB-4.0MB/3.1MB-3.1MB-3.1MB over 2)
  * com.google.android.gallery3d / u0a20:
           TOTAL: 0.03%
        Receiver: 0.03%
        (Cached): 9.0% (6.2MB-6.2MB-6.2MB/5.3MB-5.3MB-5.3MB over 1)
  * com.szyk.myheart / u0a130:
        (Cached): 100% (35MB-35MB-35MB/31MB-31MB-31MB over 2)
  * org.wikipedia / u0a98:
        (Cached): 100% (22MB-22MB-22MB/18MB-18MB-18MB over 2)
  * com.android.mms / u0a41:
        (Cached): 100% (23MB-23MB-23MB/21MB-21MB-21MB over 2)
  * nz.co.softwarex.hundredpushupsfree / u0a168:
        (Cached): 100% (23MB-23MB-23MB/20MB-20MB-20MB over 2)
  * com.commonsware.books.android / u0a148:
        (Cached): 100% (18MB-18MB-18MB/15MB-15MB-15MB over 2)
  * com.android.providers.calendar / u0a7:
        (Cached): 100% (3.6MB-3.6MB-3.6MB/2.8MB-2.8MB-2.8MB over 2)
  * com.google.android.calendar / u0a6:
        (Cached): 100% (4.7MB-4.7MB-4.7MB/3.8MB-3.8MB-3.8MB over 2)

Run time Stats:
  SOff/Norm: +12m36s333ms
  SOn /Norm: +1m11s367ms
      TOTAL: +13m47s700ms

          Start time: 2014-04-12 06:01:36
  Total elapsed time: +3h54m32s538ms (partial) libdvm.so chromeview
Unfortunately, it is rather cryptic and rather long.
There are various command-line switches you can add to help manage the output. Use
the -h switch to see the full roster. Some notable options:
-csv switches the output to be in CSV format, for importing into a spreadsheet
or running through an analysis tool, with other switches (e.g., -csv-proc) to
control what is included in the CSV output--current will only report the current snapshot--hours NNN will only report the aggregate over the stated number of hours--full-details provides a somewhat more documented report, at the cost of
greatly increasing its verbosityAlso, including a package name (e.g., com.commonsware.android.sample) at the
end of the command line will constrain the output to solely that package, which is
useful if you are only looking to examine your own app’s data.
The numbers in parentheses (e.g., (4.7MB-4.7MB-4.7MB/3.8MB-3.8MB-3.8MB over 2))
report:
The listing also shows the percentage of time your process was in various states (e.g., cached vs. service vs. “important foreground”)
Older devices that do not support procrank can support meminfo, accessed via
adb shell dumpsys meminfo. Run as-is, it will generate a report of all processes
and their PSS, plus the same roster broken down into various process categories
(e.g., foreground, cached), and other summary data. The report for the same Nexus 4
that generated the procrank shown earlier in this chapter is:
Applications Memory Usage (kB):
Uptime: 95955008 Realtime: 788076654

Total PSS by process:
   120505 kB: com.google.android.apps.maps (pid 17490 / activities)
    74627 kB: com.android.launcher (pid 1696 / activities)
    62422 kB: system (pid 1366)
    57757 kB: surfaceflinger (pid 968)
    51706 kB: com.fsck.k9 (pid 2937 / activities)
    44725 kB: com.tripit (pid 2414 / activities)
    41642 kB: com.android.systemui (pid 1498 / activities)
    38546 kB: com.google.android.inputmethod.latin (pid 1635)
    36640 kB: com.rememberthemilk.MobileRTM (pid 12255 / activities)
    35518 kB: com.szyk.myheart (pid 24618 / activities)
    32588 kB: com.stackexchange.marvin (pid 28230 / activities)
    27128 kB: com.android.phone (pid 1667)
    23641 kB: com.android.mms (pid 15197 / activities)
    23236 kB: nz.co.softwarex.hundredpushupsfree (pid 20599 / activities)
    22483 kB: org.wikipedia (pid 11895 / activities)
    18044 kB: com.commonsware.books.android (pid 12036 / activities)
    16968 kB: com.google.process.location (pid 1775)
    16895 kB: com.google.android.gms (pid 1651)
    16521 kB: com.google.process.gapps (pid 1803)
    15822 kB: com.evernote (pid 26284)
    15219 kB: android.process.acore (pid 11926)
    11336 kB: zygote (pid 969)
    10694 kB: com.csipsimple:sipStack (pid 25539)
     9575 kB: com.google.android.youtube (pid 31932)
     8390 kB: tunein.player.pro (pid 2699)
     7860 kB: com.android.bluetooth (pid 5513)
     7669 kB: org.mozilla.firefox (pid 20839)
     6786 kB: com.espn.radio:com.urbanairship.process (pid 2526)
     6719 kB: mediaserver (pid 971)
     6599 kB: com.google.android.gallery3d (pid 31894)
     6493 kB: com.android.nfc (pid 1681)
     5916 kB: com.google.android.apps.genie.geniewidget (pid 22781)
     5677 kB: android.process.media (pid 25240)
     4308 kB: com.csipsimple (pid 28166)
     4145 kB: com.google.android.deskclock (pid 12379)
     3472 kB: com.guywmustang.silentwidget (pid 14616)
     3349 kB: rild (pid 967)
     2447 kB: drmserver (pid 970)
     1972 kB: ks (pid 585)
     1876 kB: netd (pid 965)
     1282 kB: wpa_supplicant (pid 26091)
     1217 kB: mm-qcamera-daemon (pid 982)
     1116 kB: sdcard (pid 981)
      618 kB: sensors.qcom (pid 979)
      577 kB: netmgrd (pid 976)
      500 kB: vold (pid 163)
      486 kB: bridgemgrd (pid 974)
      476 kB: thermald (pid 977)
      462 kB: keystore (pid 973)
      439 kB: /init (pid 1)
      375 kB: qmuxd (pid 975)
      262 kB: ueventd (pid 139)
      230 kB: dhcpcd (pid 15630)
      214 kB: qseecomd (pid 1022)
      212 kB: adbd (pid 961)
      210 kB: installd (pid 972)
      189 kB: mpdecision (pid 978)
      181 kB: rmt_storage (pid 164)
      176 kB: dumpsys (pid 489)
      169 kB: qcks (pid 165)
      149 kB: debuggerd (pid 966)
      140 kB: healthd (pid 161)
      135 kB: efsks (pid 569)
      115 kB: servicemanager (pid 162)
      111 kB: qseecomd (pid 986)

Total PSS by OOM adjustment:
    95497 kB: Native
               57757 kB: surfaceflinger (pid 968)
               11336 kB: zygote (pid 969)
                6719 kB: mediaserver (pid 971)
                3349 kB: rild (pid 967)
                2447 kB: drmserver (pid 970)
                1972 kB: ks (pid 585)
                1876 kB: netd (pid 965)
                1282 kB: wpa_supplicant (pid 26091)
                1217 kB: mm-qcamera-daemon (pid 982)
                1116 kB: sdcard (pid 981)
                 618 kB: sensors.qcom (pid 979)
                 577 kB: netmgrd (pid 976)
                 500 kB: vold (pid 163)
                 486 kB: bridgemgrd (pid 974)
                 476 kB: thermald (pid 977)
                 462 kB: keystore (pid 973)
                 439 kB: /init (pid 1)
                 375 kB: qmuxd (pid 975)
                 262 kB: ueventd (pid 139)
                 230 kB: dhcpcd (pid 15630)
                 214 kB: qseecomd (pid 1022)
                 212 kB: adbd (pid 961)
                 210 kB: installd (pid 972)
                 189 kB: mpdecision (pid 978)
                 181 kB: rmt_storage (pid 164)
                 176 kB: dumpsys (pid 489)
                 169 kB: qcks (pid 165)
                 149 kB: debuggerd (pid 966)
                 140 kB: healthd (pid 161)
                 135 kB: efsks (pid 569)
                 115 kB: servicemanager (pid 162)
                 111 kB: qseecomd (pid 986)
    62422 kB: System
               62422 kB: system (pid 1366)
    75263 kB: Persistent
               41642 kB: com.android.systemui (pid 1498 / activities)
               27128 kB: com.android.phone (pid 1667)
                6493 kB: com.android.nfc (pid 1681)
    74627 kB: Foreground
               74627 kB: com.android.launcher (pid 1696 / activities)
    63374 kB: Visible
               38546 kB: com.google.android.inputmethod.latin (pid 1635)
               16968 kB: com.google.process.location (pid 1775)
                7860 kB: com.android.bluetooth (pid 5513)
    10694 kB: Perceptible
               10694 kB: com.csipsimple:sipStack (pid 25539)
     5677 kB: A Services
                5677 kB: android.process.media (pid 25240)
    51706 kB: Previous
               51706 kB: com.fsck.k9 (pid 2937 / activities)
    76422 kB: B Services
               44725 kB: com.tripit (pid 2414 / activities)
               16521 kB: com.google.process.gapps (pid 1803)
                8390 kB: tunein.player.pro (pid 2699)
                6786 kB: com.espn.radio:com.urbanairship.process (pid 2526)
   402275 kB: Cached
              120505 kB: com.google.android.apps.maps (pid 17490 / activities)
               36640 kB: com.rememberthemilk.MobileRTM (pid 12255 / activities)
               35518 kB: com.szyk.myheart (pid 24618 / activities)
               32588 kB: com.stackexchange.marvin (pid 28230 / activities)
               23641 kB: com.android.mms (pid 15197 / activities)
               23236 kB: nz.co.softwarex.hundredpushupsfree (pid 20599 / activities)
               22483 kB: org.wikipedia (pid 11895 / activities)
               18044 kB: com.commonsware.books.android (pid 12036 / activities)
               16895 kB: com.google.android.gms (pid 1651)
               15822 kB: com.evernote (pid 26284)
               15219 kB: android.process.acore (pid 11926)
                9575 kB: com.google.android.youtube (pid 31932)
                7669 kB: org.mozilla.firefox (pid 20839)
                6599 kB: com.google.android.gallery3d (pid 31894)
                5916 kB: com.google.android.apps.genie.geniewidget (pid 22781)
                4308 kB: com.csipsimple (pid 28166)
                4145 kB: com.google.android.deskclock (pid 12379)
                3472 kB: com.guywmustang.silentwidget (pid 14616)

Total PSS by category:
   200246 kB: Dalvik
   172738 kB: Native
   151232 kB: Graphics
    89516 kB: Dalvik Other
    65741 kB: .dex mmap
    62904 kB: GL
    59426 kB: .so mmap
    58237 kB: Other dev
    24084 kB: Unknown
    15480 kB: .apk mmap
     8404 kB: Stack
     7562 kB: Other mmap
     1112 kB: Ashmem
     1099 kB: .ttf mmap
      160 kB: .jar mmap
       16 kB: Cursor
        0 kB: code mmap
        0 kB: image mmap
        0 kB: Memtrack

Total RAM: 1878788 kB
 Free RAM: 1258215 kB (402275 cached pss + 625628 cached + 230312 free)
 Used RAM: 780542 kB (515682 used pss + 192112 buffers + 3180 shmem + 69568 slab)
 Lost RAM: -159969 kB
   Tuning: 192 (large 512), oom 122880 kB, restore limit 40960 kB (high-end-gfx)
However, if you add a package name to the command (e.g., adb shell dumpsys meminfo com.commonsware.books.android),
you will get a more detailed report about that specific app:
Applications Memory Usage (kB):
Uptime: 96120803 Realtime: 788242449

** MEMINFO in pid 12036 [com.commonsware.books.android] **
                   Pss  Private  Private  Swapped     Heap     Heap     Heap
                 Total    Dirty    Clean    Dirty     Size    Alloc     Free
                ------   ------   ------   ------   ------   ------   ------
  Native Heap     7642     7616        0        0     8732     8553      178
  Dalvik Heap     1920     1472        0        0     9860     9819       41
 Dalvik Other     1568     1428        0        0
        Stack      316      316        0        0
       Ashmem      128       68        0        0
    Other dev        4        0        4        0
     .so mmap     2372      528      116        0
    .apk mmap      130        0        8        0
    .ttf mmap       18        0        0        0
    .dex mmap     1232       12      936        0
   Other mmap      198        4        8        0
      Unknown     2516     2516        0        0
        TOTAL    18044    13960     1072        0    18592    18372      219

 Objects
               Views:       48         ViewRootImpl:        1
         AppContexts:        3           Activities:        1
              Assets:        2        AssetManagers:        2
       Local Binders:        8        Proxy Binders:       17
    Death Recipients:        0
     OpenSSL Sockets:        0

 SQL
         MEMORY_USED:       75
  PAGECACHE_OVERFLOW:        3          MALLOC_SIZE:       62

 DATABASES
      pgsz     dbsz   Lookaside(b)          cache  Dbname
         1     6263             17         0/16/1  /data/data/com.commonsware.books.android/databases/booksearch.db
This can show you:
.dex mmap), native
libraries used directly by you or by framework components (.so mmap), etc.Note that the combination of the Private Dirty and Private Clean columns is
roughly analogous to the USS reported by procstats, in that it represents the amount
of memory private to your process and that would be released should your process be
terminated.
Some of the same information that the aforementioned reports contain is available
at runtime via ActivityManager and other framework classes.
getMemoryInfo() on ActivityManager
will fill in a supplied ActivityManager.MemoryInfo object. This
will report to you:
totalMem)availMem)threshold)lowMemory)ActivityManager also has a getMyMemoryState() method, on API Level 16+, that will
populate an ActivityManager.RunningAppProcessInfo object with information about
your process. While not everything in this object will be filled in, you will be
able to get:
Application via
onTrimMemory() (lastTrimLevel)importance), such
as IMPORTANCE_FOREGROUND and IMPORTANCE_EMPTY
IMPORTANCE_BACKGROUND category — meaning the process has
outstanding activities but is not in the foreground and has no service — the relative
standing of the process compared to other background processes from a least-recently-used
standpoint (lru), where lower numbers mean more recent usageThe getProcessMemoryInfo() method on ActivityManager returns an array of
Debug.MemoryInfo objects corresponding to the array of int process IDs (pids)
that you pass in. The Debug.MemoryInfo objects report
how much memory those identified processes are consuming. Of particular note, getTotalPss() returns the
PSS for that process.
To get the Debug.MemoryInfo for your own process, you can use getMemoryInfo()
on the Debug class, rather than find your own process ID and use getProcessMemoryInfo().
Or, on API Level 14+, you can simply call getPss() on Debug directly to find out
your PSS.
Part of the reason for worrying a bit about your system RAM consumption is simply to “play nice” with the other apps that the user wants to use. However, since part of Android’s decision-making about what processes to terminate tie into how much RAM those processes take up, the lower your system RAM footprint, the more likely it is that you can hang around for a while.
Part of reducing your system RAM consumption involves cleaning up your heap.
The reason the framework calls callback methods like onTrimMemory() is to help you
reduce your heap usage to avoid OutOfMemoryError exceptions. However, allowing objects
to be garbage-collected not only gives you more heap space, but it
also may reduce your system RAM footprint.
To limit your system RAM usage, your process is not allocated all of its possible heap when the process is started up. Instead, the heap starts small and expands as you allocate more and more memory. However, the reverse is also true: if you release memory, the heap can shrink, returning RAM to the system. Android expands the heap on a “paged” basis, allocating more system RAM to add more pages to the heap. If, as a result of garbage collection, Dalvik sees that there are too many totally empty pages, Dalvik can free up those pages, returning them to the OS for use by other processes.
As noted in the chapter on the application heap, Dalvik’s garbage collector is non-compacting, meaning that it does not move objects around to try to clean up pages or otherwise coalesce free memory blocks. Hence, a fragmented heap not only limits how well you can allocate new memory, but it also inhibits Dalvik’s ability to reduce your system RAM usage.