Chapter 7
System Design Techniques
Chapter Points
• A deeper look into design methodologies, requirements, specification, and system analysis.
7.1 Introduction
In this chapter we consider the techniques required to create complex embedded systems. Thus far, our design examples have been small so that important concepts can be conveyed relatively simply. However, most real embedded system designs are inherently complex, given that their functional specifications are rich and they must obey multiple other requirements on cost, performance, and so on. We need methodologies to help guide our design decisions when designing large systems.
In the next section we look at design methodologies in more detail. Section 7.3 studies requirements analysis, which captures informal descriptions of what a system must do, while Section 7.4 considers techniques for more formally specifying system functionality. Section 7.5 focuses on details of system analysis methodologies. Section 7.6 discusses quality assurance, which must be considered throughout the design process to ensure a high-quality design.
7.2 Design Methodologies
This section considers the complete design methodology—a design process—for embedded computing systems. We will start with the rationale for design methodologies, then look at several different methodologies.
7.2.1 Why Design Methodologies?
Process is important because without it, we can’t reliably deliver the products we want to create. Thinking about the sequence of steps necessary to build something may seem superfluous. But the fact is that everyone has their own design process, even if they don’t articulate it. If you are designing embedded systems in your basement by yourself, having your own work habits is fine. But when several people work together on a project, they need to agree on who will do things and how they will get done. Being explicit about process is important when people work together. Therefore, because many embedded computing systems are too complex to be designed and built by one person, we have to think about design processes.
Product metrics
The obvious goal of a design process is to create a product that does something useful. Typical specifications for a product will include functionality (e.g., personal digital assistant), manufacturing cost (must have a retail price below $200), performance (must power up within 3 seconds), power consumption (must run for 12 hours on two AA batteries), or other properties. Of course, a design process has several important goals beyond function, performance, and power:
• Time-to-market. Customers always want new features. The product that comes out first can win the market, even setting customer preferences for future generations of the product. The profitable market life for some products is three to six months—if you are three months late, you will never make money. In some categories, the competition is against the calendar, not just competitors. Calculators, for example, are disproportionately sold just before school starts in the fall. If you miss your market window, you have to wait a year for another sales season.
• Design cost. Many consumer products are very cost sensitive. Industrial buyers are also increasingly concerned about cost. The costs of designing the system are distinct from manufacturing cost—the cost of engineers’ salaries, computers used in design, and so on must be spread across the units sold. In some cases, only one or a few copies of an embedded system may be built, so design costs can dominate manufacturing costs. Design costs can also be important for high-volume consumer devices when time-to-market pressures cause teams to swell in size.
• Quality. Customers not only want their products fast and cheap, they also want them to be right. A design methodology that cranks out shoddy products will soon be forced out of the marketplace. Correctness, reliability, and usability must be explicitly addressed from the beginning of the design job to obtain a high-quality product at the end.
Processes evolve over time. They change due to external and internal forces. Customers may change, requirements change, products change, and available components change. Internally, people learn how to do things better, people move on to other projects and others come in, and companies are bought and sold to merge and shape corporate cultures.
Software engineers have spent a great deal of time thinking about software design processes. Much of this thinking has been motivated by mainframe software such as databases. But embedded applications have also inspired some important thinking about software design processes.
A good methodology is critical to building systems that work properly. Delivering buggy systems to customers always causes dissatisfaction. But in some applications, such as medical and automotive systems, bugs create serious safety problems that can endanger the lives of users. We discuss quality in more detail in Section 7.6. As an introduction, Example 7.1 describes problems that led to the loss of an unmanned Martian space probe.
Example 7.1 Loss of the Mars Climate Observer
In September 1999, the Mars Climate Observer, an unmanned U.S. spacecraft designed to study Mars, was lost—it most likely exploded as it heated up in the atmosphere of Mars after approaching the planet too closely. The spacecraft came too close to Mars because of a series of problems, according to an analysis by IEEE Spectrum and contributing editor James Oberg [Obe99]. From an embedded systems perspective, the first problem is best classified as a requirements problem. The contractors who built the spacecraft at Lockheed Martin calculated values for flight controllers at the Jet Propulsion Laboratory (JPL). JPL did not specify the physical units to be used, but they expected them to be in newtons. The Lockheed Martin engineers returned values in units of pound force. This discrepancy resulted in trajectory adjustments being 4.45 times larger than they should have been. The error was not caught by a software configuration process nor was it caught by manual inspections. Although there were concerns about the spacecraft’s trajectory, errors in the calculation of the spacecraft’s position were not caught in time.
7.2.2 Design Flows
A design flow is a sequence of steps to be followed during a design. Some of the steps can be performed by tools, such as compilers or computer-aided design (CAD) systems; other steps can be performed by hand. In this section we look at the basic characteristics of design flows.
Waterfall model
Figure 7.1 shows the waterfall model introduced by Royce [Dav90], the first model proposed for the software development process. The waterfall development model consists of five major phases: requirements analysis determines the basic characteristics of the system; architecture design decomposes the functionality into major components; coding implements the pieces and integrates them; testing uncovers bugs; and maintenance entails deployment in the field, bug fixes, and upgrades. The waterfall model gets its name from the largely one-way flow of work and information from higher levels of abstraction to more detailed design steps (with a limited amount of feedback to the next-higher level of abstraction). Although top-down design is ideal because it implies good foreknowledge of the implementation during early design phases, most designs are clearly not quite so top down. Most design projects entail experimentation and changes that require bottom-up feedback. As a result, the waterfall model is today cited as an unrealistic design process. However, it is important to know what the waterfall model is to be able to understand how others are reacting against it.
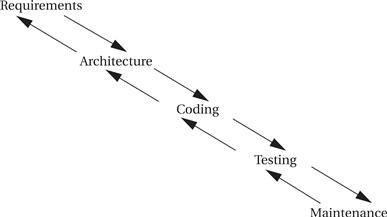
Figure 7.1 The waterfall model of software development.
Spiral model
Figure 7.2 illustrates an alternative model of software development, called the spiral model[Boe87]. While the waterfall model assumes that the system is built once in its entirety, the spiral model assumes that several versions of the system will be built. Early systems will be simple mock-ups constructed to aid designers’ intuition and to build experience with the system. As design progresses, more complex systems will be constructed. At each level of design, the designers go through requirements, construction, and testing phases. At later stages when more complete versions of the system are constructed, each phase requires more work, widening the design spiral. This successive refinement approach helps the designers understand the system they are working on through a series of design cycles. The first cycles at the top of the spiral are very small and short, while the final cycles at the spiral’s bottom add detail learned from the earlier cycles of the spiral. The spiral model is more realistic than the waterfall model because multiple iterations are often necessary to add enough detail to complete a design. However, a spiral methodology with too many spirals may take too long when design time is a major requirement.
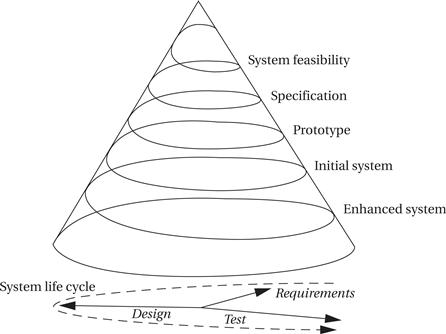
Figure 7.2 The spiral model of software design.
Successive refinement
Figure 7.3 shows a successive refinement design methodology. In this approach, the system is built several times. A first system is used as a rough prototype, and successive models of the system are further refined. This methodology makes sense when you are relatively unfamiliar with the application domain for which you are building the system. Refining the system by building several increasingly complex systems allows you to test out architecture and design techniques. The various iterations may also be only partially completed; for example, continuing an initial system only through the detailed design phase may teach you enough to help you avoid many mistakes in a second design iteration that is carried through to completion.
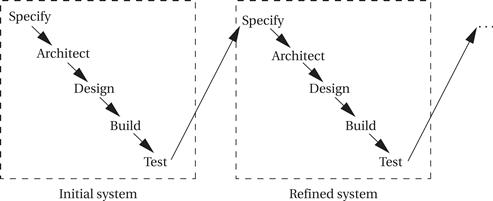
Figure 7.3 A successive refinement development model.
Embedded computing systems often involve the design of hardware as well as software. Even if you aren’t designing a board, you may be selecting boards and plugging together multiple hardware components as well as writing code. Figure 7.4 shows a design methodology for a combined hardware/software project. Front-end activities such as specification and architecture simultaneously consider hardware and software aspects. Similarly, back-end integration and testing consider the entire system. In the middle, however, development of hardware and software components can go on relatively independently—while testing of one will require stubs of the other, most of the hardware and software work can proceed relatively independently.
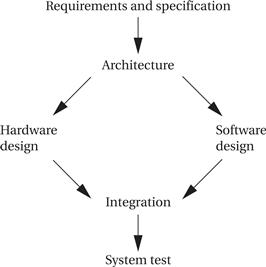
Figure 7.4 A simple hardware/software design methodology.
Hierarchical design flows
In fact, many complex embedded systems are themselves built of smaller designs. The complete system may require the design of significant software components, application-specific integrated circuits (ASICs), and so on, and these in turn may be built from smaller components that need to be designed. The design flow follows the levels of abstraction in the system, from complete system design flows at the most abstract to design flows for individual components. The design flow for these complex systems resembles the flow shown in Figure 7.5. The implementation phase of a flow is itself a complete flow from specification through testing. In such a large project, each flow will probably be handled by separate people or teams. The teams must rely on each other’s results. The component teams take their requirements from the team handling the next higher level of abstraction, and the higher-level team relies on the quality of design and testing performed by the component team. Good communication is vital in such large projects.
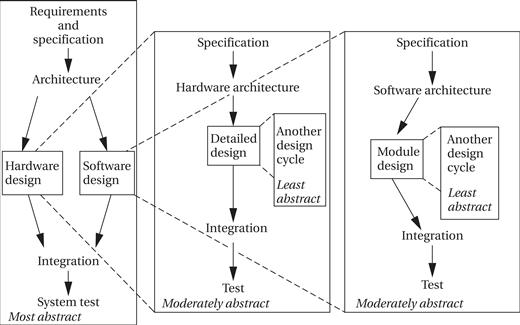
Figure 7.5 A hierarchical design flow for an embedded system.
Concurrent engineering
When designing a large system along with many people, it is easy to lose track of the complete design flow and have each designer take a narrow view of his or her role in the design flow. Concurrent engineering attempts to take a broader approach and optimize the total flow. Reduced design time is an important goal for concurrent engineering, but it can help with any aspect of the design that cuts across the design flow, such as reliability, performance, power consumption, and so on. It tries to eliminate “over-the-wall” design steps, in which one designer performs an isolated task and then throws the result over the wall to the next designer, with little interaction between the two. In particular, reaping the most benefits from concurrent engineering usually requires eliminating the wall between design and manufacturing. Concurrent engineering efforts are comprised of the elements described below.
• Cross-functional teams include members from various disciplines involved in the process, including manufacturing, hardware and software design, marketing, and so forth.
• Concurrent product realization process activities are at the heart of concurrent engineering. Doing several things at once, such as designing various subsystems simultaneously, is critical to reducing design time.
• Incremental information sharing and use helps minimize the chance that concurrent product realization will lead to surprises. As soon as new information becomes available, it is shared and integrated into the design. Cross-functional teams are important to the effective sharing of information in a timely fashion.
• Integrated project management ensures that someone is responsible for the entire project, and that responsibility is not abdicated once one aspect of the work is done.
• Early and continual supplier involvement helps make the best use of suppliers’ capabilities.
• Early and continual customer focus helps ensure that the product best meets customers’ needs. Example 7.2 describes the experiences of a telephone system design organization with concurrent engineering.
Example 7.2 Concurrent Engineering Applied to Telephone Systems
A group at AT&T applied concurrent engineering to the design of PBXs (telephone switching systems) [Gat94]. The company had a large existing organization and methodology for designing PBXs; their goal was to re-engineer their process to reduce design time and make other improvements to the end product. They used the seven-step process described below.
1. Benchmarking. They compared themselves to competitors and found that it took them 30% longer to introduce a new product than their best competitors. Based on this study, they decided to shoot for a 40% reduction in design time.
2. Breakthrough improvement. Next, they identified the factors that would influence their effort. Three major factors were identified: increased partnership between design and manufacturing; continued existence of the basic organization of design labs and manufacturing; and support of managers at least two levels above the working level. As a result, three groups were established to help manage the effort. A steering committee was formed by midlevel managers to provide feedback on the project. A project office was formed by an engineering manager and an operations analyst from the AT&T internal consulting organization. Finally, a core team of engineers and analysts was formed to make things happen.
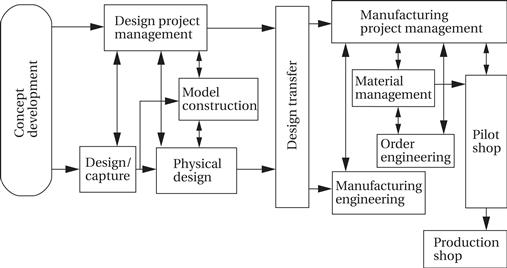
3. Characterization of the current process. The core team built flowcharts and used other techniques to understand the current product development process. The existing design and manufacturing process resembled this process:
The core team identified several root causes of delays that had to be remedied. First, too many design and manufacturing tasks were performed sequentially. Second, groups tended to focus on intermediate milestones related to their narrow job descriptions, rather than trying to take into account the effects of their decisions on other aspects of the development process. Third, too much time was spent waiting in queues—jobs were handed off from one person to another very frequently. In many cases, the recipient of a set of jobs didn’t know how to best prioritize the incoming tasks. Fixing this problem was deemed to be fundamentally a managerial problem, not a technical one. Finally, the team found that too many groups had their own design databases, creating redundant data that had to be maintained and synchronized.
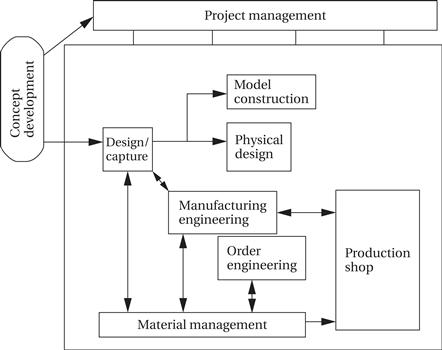
4. Create the target process. Based on its studies, the core team created a model for the new development process:
5. Verify the new process. The team undertook a pilot product development project to test the new process. The process was found to be basically sound. Some challenges were identified; for example, in the sequential project the design of circuit boards took longer than that of the mechanical enclosures, while in the new process the enclosures ended up taking longer, pointing out the need to start designing them earlier.
6. Implement across the product line. After the pilot project, the new methodology was rolled out across the product lines. This activity required training of personnel, documentation of the new standards and procedures, and improvements to information systems.
7. Measure results and improve. The performance of the new design flow was measured. The team found that product development time had been reduced from 18–30 months to 11 months.
7.3 Requirements Analysis
Before designing a system, we need to know what we are designing. The terms “requirements” and “specifications” are used in a variety of ways—some people use them as synonyms, while others use them as distinct phases. We use them to mean related but distinct steps in the design process. Requirements are informal descriptions of what the customer wants, while specifications are more detailed, precise, and consistent descriptions of the system that can be used to create the architecture. Both requirements and specifications are, however, directed to the outward behavior of the system, not its internal structure.
The overall goal of creating a requirements document is effective communication between the customers and the designers. The designers should know what they are expected to design for the customers; the customers, whether they are known in advance or represented by marketing, should understand what they will get.
Functional and nonfunctional requirements
We have two types of requirements: functional and nonfunctional. A functional requirement states what the system must do, such as compute an FFT. A nonfunctional requirement can be any number of other attributes, including physical size, cost, power consumption, design time, reliability, and so on.
A good set of requirements should meet several tests [Dav90]:
• Correctness: The requirements should not mistakenly describe what the customer wants. Part of correctness is avoiding overrequiring—the requirements should not add conditions that are not really necessary.
• Unambiguousness: The requirements document should be clear and have only one plain language interpretation.
• Completeness: All requirements should be included.
• Verifiability: There should be a cost-effective way to ensure that each requirement is satisfied in the final product. For example, a requirement that the system package be “attractive” would be hard to verify without some agreed upon definition of attractiveness.
• Consistency: One requirement should not contradict another requirement.
• Modifiability: The requirements document should be structured so that it can be modified to meet changing requirements without losing consistency, verifiability, and so forth.
• Traceability: Each requirement should be traceable in the following ways:
• We should be able to trace backward from the requirements to know why each requirement exists.
• We should also be able to trace forward from documents created before the requirements (e.g., marketing memos) to understand how they relate to the final requirements.
• We should be able to trace forward to understand how each requirement is satisfied in the implementation.
• We should also be able to trace backward from the implementation to know which requirements they were intended to satisfy.
How do you determine requirements? If the product is a continuation of a series, then many of the requirements are well understood. But even in the most modest upgrade, talking to the customer is valuable. In a large company, marketing or sales departments may do most of the work of asking customers what they want, but a surprising number of companies have designers talk directly with customers. Direct customer contact gives the designer an unfiltered sample of what the customer says. It also helps build empathy with the customer, which often pays off in cleaner, easier-to-use customer interfaces. Talking to the customer may also include conducting surveys, organizing focus groups, or asking selected customers to test a mock-up or prototype.
7.4 Specifications
In this section we take a look at some advanced techniques for specification and how they can be used.
7.4.1 Control-Oriented Specification Languages
SDL
We have already seen how to use state machines to specify control in UML. An example of a widely used state machine specification language is the SDL language[Roc82], which was developed by the communications industry for specifying communication protocols, telephone systems, and so forth. As illustrated in Figure 7.6, SDL specifications include states, actions, and both conditional and unconditional transitions between states. SDL is an event-oriented state machine model because transitions between states are caused by internal and external events.
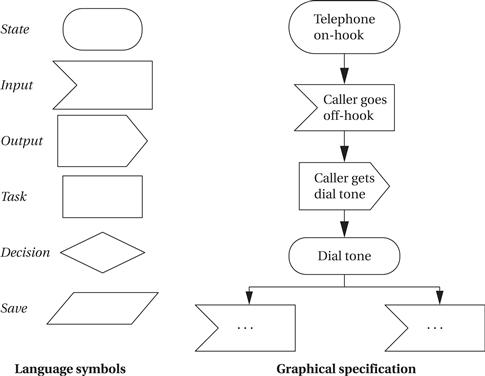
Figure 7.6 The SDL specification language.
Statecharts
Other techniques can be used to eliminate clutter and clarify the important structure of a state-based specification. The Statechart[Har87] is one well-known technique for state-based specification that introduced some important concepts. The Statechart notation uses an event-driven model. Statecharts allow states to be grouped together to show common functionality. There are two basic groupings: OR and AND. Figure 7.7 shows an example of an OR state by comparing a traditional state transition diagram with a Statechart described via an OR state. The state machine specifies that the machine goes to state s4 from any of s1, s2, or s3 when they receive the input i2. The Statechart denotes this commonality by drawing an OR state around s1, s2, and s3 (the name of the OR state is given in the small box at the top of the state). A single transition out of the OR state s123 specifies that the machine goes into state s4 when it receives the i2 input while in any state included in s123. The OR state still allows interesting transitions between its member states. There can be multiple ways to get into s123 (via s1 or s2), and there can be transitions between states within the OR state (such as from s1 to s3 or s2 to s3). The OR state is simply a tool for specifying some of the transitions relating to these states.
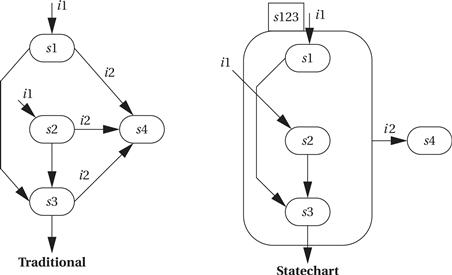
Figure 7.7 An OR state in Statecharts.
Figure 7.8 shows an example of an AND state specified in Statechart notation as compared to the equivalent in the traditional state machine model. In the traditional model, there are numerous transitions between the states; there is also one entry point into this cluster of states and one exit transition out of the cluster.
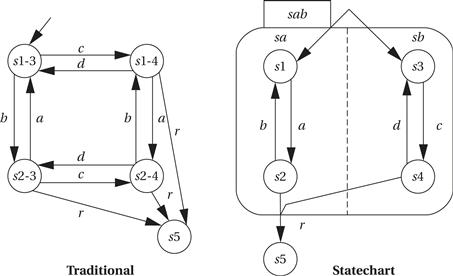
Figure 7.8 An AND state in Statecharts.
In the Statechart, the AND state sab is decomposed into two components, sa and sb. When the machine enters the AND state, it simultaneously inhabits the state s1 of component sa and the state s3 of component sb. We can think of the system’s state as multidimensional. When it enters sab, knowing the complete state of the machine requires examining both sa and sb.
The names of the states in the traditional state machine reveal their relationship to the AND state components. Thus, state s1-3 corresponds to the Statechart machine having its sa component in s1 and its sb component in s3, and so forth. We can exit this cluster of states to go to state s5 only when, in the traditional specification, we are in state s2-4 and receive input r. In the AND state, this corresponds to sa in state s2, sb in state s4, and the machine receiving the r input while in this composite state. Although the traditional and Statechart models describe the same behavior, each component has only two states, and the relationships between these states are much simpler to see.
AND/OR tables
Leveson et al. [Lev94] used a different format, the AND/OR table, to describe similar relationships between states. An example AND/OR table and the Boolean expression it describes are shown in Figure 7.9. The rows in the AND/OR table are labeled with the basic variables in the expression. Each column corresponds to an AND term in the expression. For example, the AND term (cond2 and not cond3) is represented in the second column with a T for cond2, an F for cond3, and a dash (don’t-care) for cond1; this corresponds to the fact that cond2 must be T and cond3 F for the AND term to be true. We use the table to evaluate whether a given condition holds in the system. The current states of the variables are compared to the table elements. A column evaluates to true if all the current variable values correspond to the requirements given in the column. If any one of the columns evaluates to true, then the table’s expression evaluates to true, as we would expect for an AND/OR expression. The most important difference between this notation and Statecharts is that don’t-cares are explicitly represented in the table, which was found to be of great help in identifying problems in a specification table.
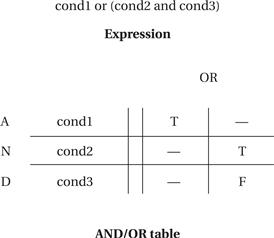
Figure 7.9 An AND/OR table.
7.4.2 Advanced Specifications
This section is devoted to a single example of a sophisticated system. Example 7.3 describes the specification of a real-world, safety-critical system used in aircraft. The specification techniques developed to ensure the correctness and safety of this system can also be used in many applications, particularly in systems where much of the complexity goes into the control structure.
Example 7.3 The TCAS II Specification
TCAS II (Traffic Alert and Collision Avoidance System) is a collision avoidance system for aircraft. Based on a variety of information, a TCAS unit in an aircraft keeps track of the position of other nearby aircraft. If TCAS decides that a mid-air collision may be likely, it uses audio commands to suggest evasive action—for example, a prerecorded voice may warn “DESCEND! DESCEND!” if TCAS believes that an aircraft above poses a threat and that there is room to maneuver below. TCAS makes sophisticated decisions in real time and is clearly safety critical. On the one hand, it must detect as many potential collision events as possible (within the limits of its sensors, etc.). On the other hand, it must generate as few false alarms as possible, because the extreme maneuvers it recommends are themselves potentially dangerous.
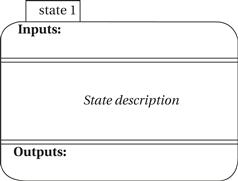
Leveson et al. [Lev94] developed a specification for the TCAS II system. We won’t cover the entire specification here, but just enough to provide its flavor. The TCAS II specification was written in their RSML language. They use a modified version of Statechart notation for specifying states, in which the inputs to and outputs of the state are made explicit. The basic state notation looks like this:
They also use a transition bus to show sets of states in which there are transitions between all (or almost all) states. In this example, there are transitions from a, b, c, or d to any of the other states:
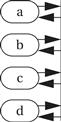
The top-level description of the collision avoidance system (CAS) is relatively simple:
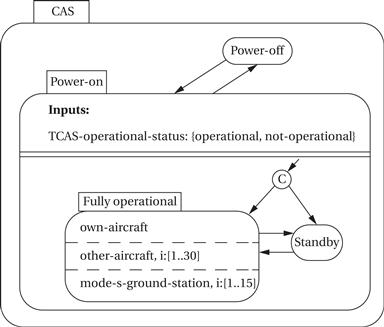
This diagram specifies that the system has Power-off and Power-on states. In the power-on state, the system may be in Standby or Fully operational mode. In the Fully operational mode, three components are operating in parallel, as specified by the AND state: the own-aircraft subsystem, a subsystem to keep track of up to 30 other aircraft, and a subsystem to keep track of up to 15 Mode S ground stations, which provide radar information.
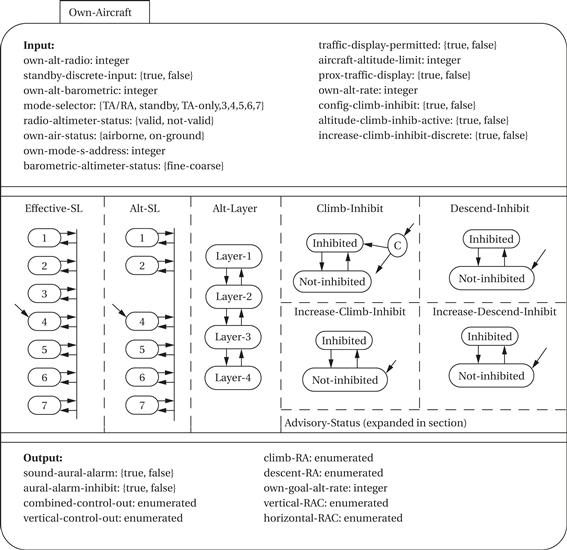
The next diagram shows a specification of the Own-Aircraft AND state. Once again, the behavior of Own-Aircraft is an AND composition of several subbehaviors. The Effective-SL and Alt-SL states are two ways to control the sensitivity level (SL) of the system, with each state representing a different sensitivity level. Differing sensitivities are required depending on distance from the ground and other factors. The Alt-Layer state divides the vertical airspace into layers, with this state keeping track of the current layer. Climb-Inhibit and Descent-Inhibit states are used to selectively inhibit climbs (which may be difficult at high altitudes) or descents (clearly dangerous near the ground), respectively. Similarly, the Increase-Climb-Inhibit and Increase-Descend-Inhibit states can inhibit high-rate climbs and descents. Because the Advisory-Status state is rather complicated, its details are not shown here.
7.5 System Analysis and Architecture Design
In this section we consider how to turn a specification into an architecture design. We already have a number of techniques for making specific decisions; in this section we look at how to get a handle on the overall system architecture. The CRC card methodology for system analysis is one very useful method for understanding the overall structure of a complex system.
7.5.1 CRC Cards
The CRC card methodology is a well-known and useful way to help analyze a system’s structure. It is particularly well suited to object-oriented design because it encourages the encapsulation of data and functions.
The acronym CRC stands for the following three major items that the methodology tries to identify:
• Classes define the logical groupings of data and functionality.
• Responsibilities describe what the classes do.
• Collaborators are the other classes with which a given class works.
The name CRC card comes from the fact that the methodology is practiced by having people write on index cards. (In the United States, the standard size for index cards is 3″ × 5″, so these cards are often called 3 × 5 cards.) An example card is shown in Figure 7.10; it has space to write down the class name, its responsibilities and collaborators, and other information. The essence of the CRC card methodology is to have people write on these cards, talk about them, and update the cards until they are satisfied with the results.
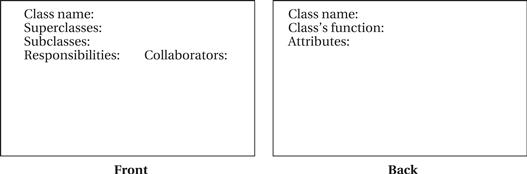
Figure 7.10 Layout of a CRC card.
This technique may seem like a primitive way to design computer systems. However, it has several important advantages. First, it is easy to get non-computer people to create CRC cards. Getting the advice of domain experts (automobile designers for automotive electronics or human factors experts for PDA design, for example) is very important in system design. The CRC card methodology is informal enough that it will not intimidate non-computer specialists and will allow you to capture their input. Second, it aids even computer specialists by encouraging them to work in a group and analyze scenarios. The walkthrough process used with CRC cards is very useful in scoping out a design and determining what parts of a system are poorly understood. This informal technique is valuable to tool-based design and coding. If you still feel a need to use tools to help you practice the CRC methodology, software engineering tools are available that automate the creation of CRC cards.
Before going through the methodology, let’s review the CRC concepts in a little more detail. We are familiar with classes—they encapsulate functionality. A class may represent a real-world object or it may describe an object that has been created solely to help architect the system. A class has both an internal state and a functional interface; the functional interface describes the class’s capabilities. The responsibility set is an informal way of describing that functional interface. The responsibilities provide the class’s interface, not its internal implementation. Unlike describing a class in a programming language, however, the responsibilities may be described informally in English (or your favorite language). The collaborators of a class are simply the classes that it talks to, that is, classes that use its capabilities or that it calls upon to help it do its work.
The class terminology is a little misleading when an object-oriented programmer looks at CRC cards. In the methodology, a class is actually used more like an object in an OO programming language—the CRC card class is used to represent a real actor in the system. However, the CRC card class is easily transformable into a class definition in an object-oriented design.
CRC card analysis is performed by a team of people. It is possible to use it by yourself, but a lot of the benefit of the method comes from talking about the developing classes with others. Before beginning the process, you should create a large number of CRC cards using the basic format shown in Figure 7.10. As you are working in your group, you will be writing on these cards; you will probably discard many of them and rewrite them as the system evolves. The CRC card methodology is informal, but you should go through the following steps when using it to analyze a system:
1. Develop an initial list of classes. Write down the class name and perhaps a few words on what it does. A class may represent a real-world object or an architectural object. Identifying which category the class falls into (perhaps by putting a star next to the name of a real-world object) is helpful. Each person can be responsible for handling a part of the system, but team members should talk during this process to be sure that no classes are missed and that duplicate classes are not created.
2. Write an initial list of responsibilities and collaborators. The responsibilities list helps describe in a little more detail what the class does. The collaborators list should be built from obvious relationships between classes. Both the responsibilities and collaborators will be refined in the later stages.
3. Create some usage scenarios. These scenarios describe what the system does. Scenarios probably begin with some type of outside stimulus, which is one important reason for identifying the relevant real-world objects.
4. Walk through the scenarios. This is the heart of the methodology. During the walkthrough, each person on the team represents one or more classes. The scenario should be simulated by acting: people can call out what their class is doing, ask other classes to perform operations, and so on. Moving around, for example, to show the transfer of data, may help you visualize the system’s operation. During the walkthrough, all of the information created so far is targeted for updating and refinement, including the classes, their responsibilities and collaborators, and the usage scenarios. Classes may be created, destroyed, or modified during this process. You will also probably find many holes in the scenario itself.
5. Refine the classes, responsibilities, and collaborators. Some of this will be done during the course of the walkthrough, but making a second pass after the scenarios is a good idea. The longer perspective will help you make more global changes to the CRC cards.
6. Add class relationships. Once the CRC cards have been refined, subclass and superclass relationships should become clearer and can be added to the cards.
Once you have the CRC cards, you need to somehow use them to help drive the implementation. In some cases, it may work best to use the CRC cards as direct source material for the implementors; this is particularly true if you can get the designers involved in the CRC card process. In other cases, you may want to write a more formal description, in UML or another language, of the information that was captured during the CRC card analysis, and then use that formal description as the design document for the system implementors. Example 7.4 illustrates the use of the CRC card methodology.
Example 7.4 CRC Card Analysis
Let’s perform a CRC card analysis of the elevator system of Section 8.8. First, we need the following basic set of classes:
• Real-world classes: elevator car, passenger, floor control, car control, and car sensor.
• Architectural classes: car state, floor control reader, car control reader, car control sender, and scheduler.
For each class, we need the following initial set of responsibilities and collaborators. (An asterisk is used to remind ourselves which classes represent real-world objects.)
| Class | Responsibilities | Collaborators |
| Elevator car* | Moves up and down | Car control, car sensor, car control sender |
| Passenger* | Pushes floor control and car control buttons | Floor control, car control |
| Floor control* | Transmits floor requests | Passenger, floor control reader |
| Car control* | Transmits car requests | Passenger, car control reader |
| Car sensor* | Senses car position | Scheduler |
| Car state | Records current position of car | Scheduler, car sensor |
| Floor control reader | Interface between floor control and rest of system | Floor control, scheduler |
| Car control reader | Interface between car control and rest of system | Car control, scheduler |
| Car control sender | Interface between scheduler and car | Scheduler, elevator car |
| Scheduler | Sends commands to cars based upon requests | Floor control reader, car control reader, car control sender, car state |
Several usage scenarios define the basic operation of the elevator system as well as some unusual scenarios:
1. One passenger requests a car on a floor, gets in the car when it arrives, requests another floor, and gets out when the car reaches that floor.
2. One passenger requests a car on a floor, gets in the car when it arrives, and requests the floor that the car is currently on.
3. A second passenger requests a car while another passenger is riding in the elevator.
4. Two people push floor buttons on different floors at the same time.
5. Two people push car control buttons in different cars at the same time.
At this point, we need to walk through the scenarios and make sure they are reasonable. Find a set of people and walk through these scenarios. Do the classes, responsibilities, collaborators, and scenarios make sense? How would you modify them to improve the system specification?
7.6 Quality Assurance
The quality of a product or service can be judged by how well it satisfies its intended function. A product can be of low quality for several reasons, such as it was shoddily manufactured, its components were improperly designed, its architecture was poorly conceived, and the product’s requirements were poorly understood. Quality must be designed in. You can’t test out enough bugs to deliver a high-quality product. The quality assurance (QA) process is vital for the delivery of a satisfactory system. In this section we will concentrate on portions of the methodology particularly aimed at improving the quality of the resulting system.
The software testing techniques described earlier in the book constitute one component of quality assurance, but the pursuit of quality extends throughout the design flow. For example, settling on the proper requirements and specification cannot be overlooked as an important determinant of quality. If the system is too difficult to design, it will probably be difficult to keep it working properly. Customers may desire features that sound nice but in fact don’t add much to the overall usefulness of the system. In many cases, having too many features only makes the design more complicated and the final device more prone to breakage.
In this section, we review the quality assurance process in more detail:
• we introduce the quality assurance process;
• we focus on verifying requirements and specifications; and
To help us understand the importance of quality assurance, Example 7.5 describes serious safety problems in one computer-controlled medical system. Medical equipment, like aviation electronics, is a safety-critical application; unfortunately, this medical equipment caused deaths before its design errors were properly understood. This example also allows us to use specification techniques to understand software design problems. In the rest of the section, we look at several ways of improving quality: design reviews, measurement-based quality assurance, and techniques for debugging large systems.
Example 7.5 The Therac-25 Medical Imaging System
The Therac-25 medical imaging system caused what Leveson and Turner called “the most serious computer-related accidents to date (at least nonmilitary and admitted)” [Lev93]. In the course of six known accidents, these machines delivered massive radiation overdoses, causing deaths and serious injuries. Leveson and Turner analyzed the Therac-25 system and the causes for these accidents.
The Therac-25 was controlled by a PDP-11 minicomputer. The computer was responsible for controlling a radiation gun that delivered a dose of radiation to the patient. It also runs a terminal that presents the main user interface. The machine’s software was developed by a single programmer in PDP-11 assembly language over several years. The software includes four major components: stored data, a scheduler, a set of tasks, and interrupt services. The three major critical tasks in the system follow:
• A treatment monitor controls and monitors the setup and delivery of the treatment in eight phases.
• A servo task controls the radiation gun, machine motions, and so on.
• A housekeeper task takes care of system status interlocks and limit checks. (A limit check determines whether some system parameter has gone beyond preset limits.)
The code was relatively crude—the software allowed several processes access to shared memory, there was no synchronization mechanism aside from shared variables, and test-and-set for shared variables were not indivisible operations.
Let us examine the software problems responsible for one series of accidents. Leveson and Turner reverse-engineered a specification for the relevant software as follows:
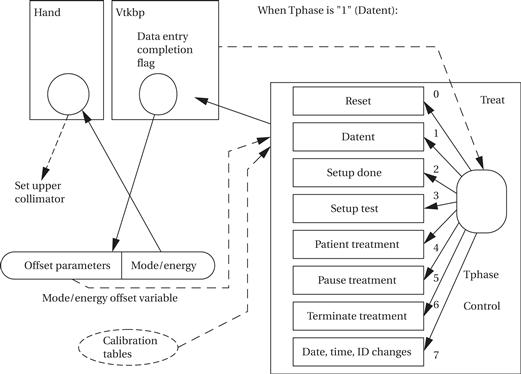
Treat is the treatment monitor task, divided into eight subroutines (Reset, Datent, and so on). Tphase is a variable that controls which of these subroutines is currently executing. Treat reschedules itself after the execution of each subroutine. The Datent subroutine communicates with the keyboard entry task via the data entry completion flag, which is a shared variable. Datent looks at this flag to determine when it should leave the data entry mode and go to the Setup test mode. The Mode/energy offset variable is a shared variable: The top byte holds offset parameters used by the Datent subroutine, and the low-order byte holds mode and energy offset used by the Hand task.
When the machine is run, the operator is forced to enter the mode and energy (there is one mode in which the energy is set to a default), but the operator can later edit the mode and energy separately. The software’s behavior is timing dependent. If the keyboard handler sets the completion variable before the operator changes the Mode/energy data, the Datent task will not detect the change—once Treat leaves Datent, it will not enter that subroutine again during the treatment. However, the Hand task, which runs concurrently, will see the new Mode/energy information. Apparently, the software included no checks to detect the incompatible data.
After the Mode/energy data are set, the software sends parameters to a digital/analog converter and then calls a Magnet subroutine to set the bending magnets. Setting the magnets takes about 8 seconds and a subroutine called Ptime is used to introduce a time delay. Due to the way that Datent, Magnet, and Ptime are written, it is possible that changes to the parameters made by the user can be shown on the screen but will not be sensed by Datent. One accident occurred when the operator initially entered Mode/energy, went to the command line, changed Mode/energy, and returned to the command line within 8 seconds. The error therefore depended on the typing speed of the operator. Because operators become faster and more skillful with the machine over time, this error is more likely to occur with experienced operators.
Leveson and Turner emphasize that the following poor design methodologies and flawed architectures were at the root of the particular bugs that led to the accidents:
• The designers performed a very limited safety analysis. For example, low probabilities were assigned to certain errors with no apparent justification.
• Mechanical backups were not used to check the operation of the machine (such as testing beam energy), even though such backups were employed in earlier models of the machine.
• Programmers created overly complex programs based on unreliable coding styles.
In summary, the designers of the Therac-25 relied on system testing with insufficient module testing or formal analysis.
7.6.1 Quality Assurance Techniques
The International Standards Organization (ISO) has created a set of quality standards known as ISO 9000. ISO 9000 was created to apply to a broad range of industries, including but not limited to embedded hardware and software. A standard developed for a particular product, such as wooden construction beams, could specify criteria particular to that product, such as the load that a beam must be able to carry. However, a wide-ranging standard such as ISO 9000 cannot specify the detailed standards for every industry. Consequently, ISO 9000 concentrates on processes used to create the product or service. The processes used to satisfy ISO 9000 affect the entire organization as well as the individual steps taken during design and manufacturing.
A detailed description of ISO 9000 is beyond the scope of this book; several books [Sch94, Jen95] describe ISO 9000’s applicability to software development. We can, however, make the following observations about quality management based on ISO 9000:
• Process is crucial. Haphazard development leads to haphazard products and low quality. Knowing what steps are to be followed to create a high-quality product is essential to ensuring that all the necessary steps are in fact followed.
• Documentation is important. Documentation has several roles: The creation of the documents describing processes helps those involved understand the processes; documentation helps internal quality monitoring groups to ensure that the required processes are actually being followed; and documentation also helps outside groups (customers, auditors, etc.) understand the processes and how they are being implemented.
• Communication is important. Quality ultimately relies on people. Good documentation is an aid for helping people understand the total quality process. The people in the organization should understand not only their specific tasks but also how their jobs can affect overall system quality.
Many types of techniques can be used to verify system designs and ensure quality. Techniques can be either manual or tool based. Manual techniques are surprisingly effective in practice. In Section 7.6 we discussed design reviews, which are simply meetings at which the design is discussed and which are very successful in identifying bugs. Many of the software testing techniques described in Chapter 5 can be applied manually by tracing through the program to determine the required tests. Tool-based verification helps considerably in managing large quantities of information that may be generated in a complex design. Test generation programs can automate much of the drudgery of creating test sets for programs. Tracking tools can help ensure that various steps have been performed. Design flow tools automate the process of running design data through other tools.
Metrics are important to the quality control process. To know whether we have achieved high levels of quality, we must be able to measure aspects of the system and our design process. We can measure certain aspects of the system itself, such as the execution speed of programs or the coverage of test patterns. We can also measure aspects of the design process, such as the rate at which bugs are found. Section 7.6 describes ways in which measurements can be used in the quality assurance process.
Tool and manual techniques must fit into an overall process. The details of that process will be determined by several factors, including the type of product being designed (e.g., video game, laser printer, air traffic control system), the number of units to be manufactured and the time allowed for design, the existing practices in the company into which any new processes must be integrated, and many other factors. An important role of ISO 9000 is to help organizations study their total process, not just particular segments that may appear to be important at a particular time.
One well-known way of measuring the quality of an organization’s software development process is the Capability Maturity Model (CMM) developed by Carnegie Mellon University’s Software Engineering Institute [SEI99]. The CMM provides a model for judging an organization. It defines the following five levels of maturity:
1. Initial. A poorly organized process, with very few well-defined processes. Success of a project depends on the efforts of individuals, not the organization itself.
2. Repeatable. This level provides basic tracking mechanisms that allow management to understand cost, scheduling, and how well the systems under development meet their goals.
3. Defined. The management and engineering processes are documented and standardized. All projects make use of documented and approved standard methods.
4. Managed. This phase makes detailed measurements of the development process and product quality.
5. Optimizing. At the highest level, feedback from detailed measurements is used to continually improve the organization’s processes.
The Software Engineering Institute has found very few organizations anywhere in the world that meet the highest level of continuous improvement and quite a few organizations that operate under the chaotic processes of the initial level. However, the Capability Maturity Model provides a benchmark by which organizations can judge themselves and use that information for improvement.
7.6.2 Verifying the Specification
The requirements and specification are generated very early in the design process. Verifying the requirements and specification is very important for the simple reason that bugs in the requirements or specification can be extremely expensive to fix later on. Figure 7.11 shows how the cost of fixing bugs grows over the course of the design process (we use the waterfall model as a simple example, but the same holds for any design flow). The longer a bug survives in the system, the more expensive it will be to fix. A coding bug, if not found until after system deployment, will cost money to recall and reprogram existing systems, among other things. But a bug introduced earlier in the flow and not discovered until the same point will accrue all those costs and more costs as well. A bug introduced in the requirements or specification and left until maintenance could force an entire redesign of the product, not just the replacement of a ROM. Discovering bugs early is crucial because it prevents bugs from being released to customers, minimizes design costs, and reduces design time. While some requirements and specification bugs will become apparent in the detailed design stages—for example, as the consequences of certain requirements are better understood—it is possible and desirable to weed out many bugs during the generation of the requirements and spec.
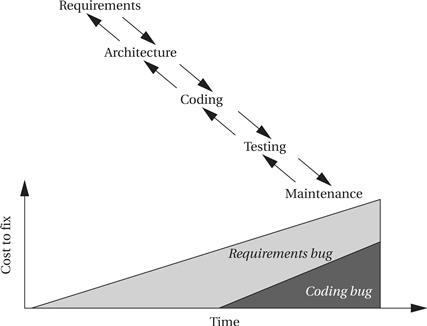
Figure 7.11 Long-lived bugs are more expensive to fix.
The goal of validating the requirements and specification is to ensure that they satisfy the criteria we originally applied in Section 7.3 to creating the requirements, including correctness, completeness, consistency, and so on. Validation is in fact part of the effort of generating the requirements and specification. Some techniques can be applied while they are being created to help you understand the requirements and specifications, while others are applied on a draft, with results used to modify the specs.
Requirements validation
Because requirements come from the customer and are inherently somewhat informal, it may seem like a challenge to validate them. However, there are many things that can be done to ensure that the customer and the person actually writing the requirements are communicating. Prototypes are a very useful tool when dealing with end users—rather than simply describe the system to them in broad, technical terms, a prototype can let them see, hear, and touch at least some of the important aspects of the system. Of course, the prototype will not be fully functional because the design work has not yet been done. However, user interfaces in particular are well suited to prototyping and user testing. Canned or randomly generated data can be used to simulate the internal operation of the system. A prototype can help the end user critique numerous functional and nonfunctional requirements, such as data displays, speed of operation, size, weight, and so forth. Certain programming languages, sometimes called prototyping languages or specification languages, are especially well suited to prototyping. Very high-level languages (such as Matlab in the signal processing domain) may be able to perform functional attributes, such as the mathematical function to be performed, but not nonfunctional attributes such as the speed of execution. Preexisting systems can also be used to help the end user articulate his or her needs. Specifying what someone does or doesn’t like about an existing machine is much easier than having them talk about the new system in the abstract. In some cases, it may be possible to construct a prototype of the new system from the preexisting system.
Validation of specifications
The techniques used to validate requirements are also useful in verifying that the specifications are correct. Building prototypes, specification languages, and comparisons to preexisting systems are as useful to system analysis and designers as they are to end users. Auditing tools may be useful in verifying consistency, completeness, and so forth. Working through usage scenarios often helps designers fill out the details of a specification and ensure its completeness and correctness. In some cases, formal techniques (that is, design techniques that make use of mathematical proofs) may be useful. Proofs may be done either manually or automatically. In some cases, proving that a particular condition can or cannot occur according to the specification is important. Automated proofs are particularly useful in certain types of complex systems that can be specified succinctly but whose behavior over time is complex. For example, complex protocols have been successfully formally verified.
7.6.3 Design Reviews
The design review[Fag76] is a critical component of any quality assurance process. The design review is a simple, low-cost way to catch bugs early in the design process. A design review is simply a meeting in which team members discuss a design, reviewing how a component of the system works. Some bugs are caught simply by preparing for the meeting, as the designer is forced to think through the design in detail. Other bugs are caught by people attending the meeting, who will notice problems that may not be caught by the unit’s designer. By catching bugs early and not allowing them to propagate into the implementation, we reduce the time required to get a working system. We can also use the design review to improve the quality of the implementation and make future changes easier to implement.
Design review format
A design review is held to review a particular component of the system. A design review team has several types of members:
• The designers of the component being reviewed are, of course, central to the design process. They present their design to the rest of the team for review and analysis.
• The review leader coordinates the pre-meeting activities, the design review itself, and the post-meeting follow-up.
• The review scribe records the minutes of the meeting so that designers and others know which problems need to be fixed.
• The review audience studies the component. Audience members will naturally include other members of the project for which this component is being designed. Audience members from other projects often add valuable perspective and may notice problems that team members have missed.
The design review process begins before the meeting itself. The design team prepares a set of documents (code listings, flowcharts, specifications, etc.) that will be used to describe the component. These documents are distributed to other members of the review team in advance of the meeting, so that everyone has time to become familiar with the material. The review leader coordinates the meeting time, distribution of handouts, and so forth.
During the meeting, the leader is responsible for ensuring that the meeting runs smoothly, while the scribe takes notes about what happens. The designers are responsible for presenting the component design. A top-down presentation often works well, beginning with the requirements and interface description, followed by the overall structure of the component, the details, and then the testing strategy. The audience should look for all types of problems at every level of detail:
• Is the design team’s view of the component’s specification consistent with the overall system specification, or has the team misinterpreted something?
• Is the interface specification correct?
• Does the component’s internal architecture work well?
The notes taken by the scribe are used in meeting follow-up. The design team should correct bugs and address concerns raised at the meeting. While doing so, the team should keep notes describing what they did. The design review leader coordinates with the design team, both to make sure that the changes are made and to distribute the change results to the audience. If the changes are straightforward, a written report of them is probably adequate. If the errors found during the review caused a major reworking of the component, a new design review meeting for the new implementation, using as many of the original team members as possible, may be useful.
7.7 Summary
System design takes a comprehensive view of the application and the system under design. To ensure that we design an acceptable system, we must understand the application and its requirements. Numerous techniques, such as object-oriented design, can be used to create useful architectures from the system’s original requirements. Along the way, by measuring our design processes, we can gain a clearer understanding of where bugs are introduced, how to fix them, and how to avoid introducing them in the future.
What we Learned
• Design methodologies and design flows can be organized in many different ways.
• Building a system mock-up is one good way to help understand system requirements.
• Statecharts are valuable in the specification of control and are part of UML.
• CRC cards help us understand the system architecture in the initial phases of architecture design.
Further reading
Pressman [Pre97] provides a thorough introduction to software engineering. Davis [Dav90] gives a good survey of software requirements. Beizer [Bei84] surveys system-level testing techniques. Leveson [Lev86] provides a good introduction to software safety. Schmauch [Sch94] and Jenner [Jen95] both describe ISO 9000 for software development. A tutorial edited by Chow [Cho85] includes a number of important early papers on software quality assurance. Cusumano [Cus91] provides a fascinating account of software factories in both the United States and Japan.
Questions
Q7-1 Briefly describe the differences between the waterfall and spiral development models.
Q7-2 What skills might be useful in a cross-functional team that is responsible for designing a set-top box?
Q7-3 Provide realistic examples of how a requirements document may be:
Q7-4 How can poor specifications lead to poor quality code—do aspects of a poorly-constructed specification necessarily lead to bad software?
Q7-5 What are the main phases of a design review?
Lab exercises
L7-1 Draw a diagram showing the developmental steps of one of the projects you recently designed. Which development model did you follow (waterfall, spiral, etc.)?
L7-2 Find a detailed description of a system of interest to you. Write your own description of what it does and how it works.