SLAVERY ESTIMATES
Table A.1 provides my estimates of the number of slaves in the world at the end of 2016. I have divided slavery into three categories: bonded labor/debt bondage, human trafficking, and other forced labor. Other forced labor captures those cases of slavery for which the person is not trafficked or bonded by debt into the servitude, and which meet the definition of forced labor established under ILO Convention No. 29. One person can theoretically meet criteria for all three of these conditions, so my hierarchy of categorization is (1) human trafficking, (2) debt bondage, and (3) other forced labor. When deciding between human trafficking and debt bondage for migrants, I categorized the case as being debt bondage if there was a formal debt agreement relating to up-front training, fees, or arranging the work opportunity abroad prior to the migrant’s departure, and that they were specifically informed that the debt would be repaid through wage deductions. If the debts were imposed on the migrant after arrival in the destination country as a way to pressure the person into forced labor, I categorize the case as human trafficking. The lines between these two categories are particularly blurry, and I used my best judgment with categorization based on the available facts.
TABLE A.1 Number of Slaves in the World, 2016
| |
MEAN (MILLIONS OF SLAVES) |
PERCENT OF TOTAL (%) |
| Bonded Labor/Debt Bondage |
19.1 |
61.2 |
| Human Trafficking |
| Sex Trafficking |
1.8 |
5.8 |
| Labor Trafficking |
3.0 |
9.6 |
| Total Human Trafficking |
4.8 |
15.4 |
| Other Forced Labor |
7.3 |
23.4 |
| Total |
31.2 |
100.0 |
The data in table A.1 present the mean of a range for each category of slavery based on an extrapolation model I built and have been refining for several years.
The mean estimate of total number of slaves in the world is 31.2 million: 19.1 million debt bondage slaves, 4.8 million trafficked slaves, and 7.3 million other forced laborers. The data used to calculate these estimates are based on two sources: (1) ongoing direct data sampling that I began conducting in 2004, and (2) the aggregation of as much reliable secondhand data on slavery estimates as possible (weighted downward by virtue of being secondhand). These data sources were fed into a highly conservative model that uses certain assumptions to calculate total global slavery numbers by type. As compared to my previous estimates in Sex Trafficking and Bonded Labor, the level of debt bondage in the world has remained relatively static, whereas my estimate of the number of human trafficking victims has increased by approximately 60 percent (+1.8 million), with a 15 percent decrease in the number of other forced laborers (−1.0 million). These changes are largely due to recategorization as well as an organic growth rate in the human trafficking category unleashed by several mass migration events from 2012 to 2016.
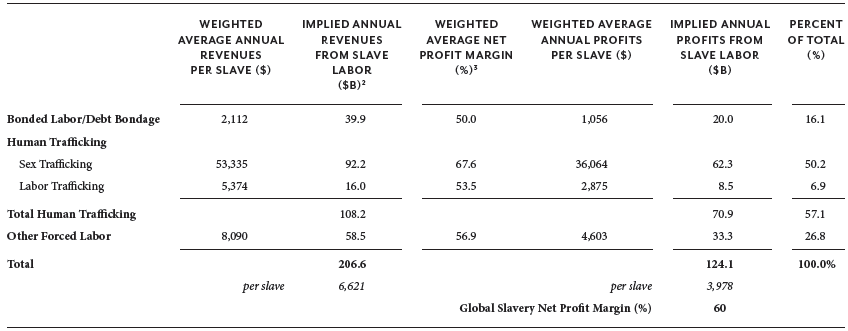
Tables A.2, A.3, and A.4 provide my updated calculations on slavery economics and profits for the year 2016. Slave labor generated revenues of $206.6 billion in 2016, with total profits of $124.1 billion accruing to the exploiters of these slaves: $20.0 billion from bonded labor, $70.9 billion from trafficked slaves (of which $62.3 billion is from trafficked sex slaves), and $33.3 billion from other forced labor.1 Worldwide, the average slave generated $3,978 in net profits for his or her exploiter during 2016, at an average net profit margin of 60 percent. Debt bondage slaves are the least profitable, at $1,056 per year per slave, and trafficked sex slaves are by far the most profitable, at $36,064 per year per slave. Just over 50 percent of all slavery profits are generated by sex trafficking victims, even though they represent only 5.8 percent of the total number of slaves in the world.
TABLE A.2 Summary of Global Slavery Profits, 2016 (in 2016 U.S. dollars)1
1 2016 US dollar valuation is based on average of relevant CPI and GDP deflator adjustments from the dates of slave’s acquisition(s).
2 Based on average of starting and ending number of slaves during 2016.
3 For bonded labor, some forms of forced labor, and where the sale of commercial sex is legal, this is a pretax profit margin, although it includes an assumption of minimal tax payments or bribes paid to avoid full tax rates.
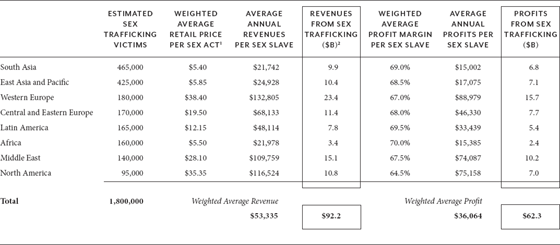
TABLE A.3 Global Sex Trafficking Metrics, 2016
1 Average price of a sex act in each region is derived from sampling various venues of exploitation, including brothel, club, street, hotel, massage parlor, and home/apartment.
2 Based on average of starting and ending number of sex trafficking victims during 2016.
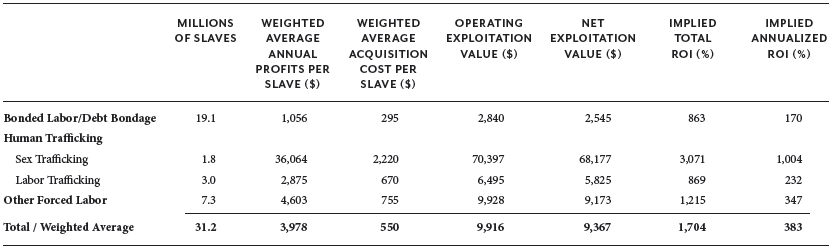
TABLE A.4 Key Slavery Metrics, 2016 (in 2016 U.S. dollars)1
1 2016 US dollar valuation is based on the average of relevant CPI and GDP deflator adjustments from the dates of slave’s acquisition(s).
Given the immense profitability of sex trafficking, it is important to take a closer look at the specific economics of this form of slavery, which are detailed in table A.3. Revenues for sex trafficking vary significantly in terms of dollar values by region, with a low of $21,742 per victim in South Asia and a high of $132,805 in western Europe. The total revenues generated by sex trafficking in 2016 were $92.2 billion, and total profits were $62.3 billion at a 67.6 percent global weighted average profit margin (or a global weighted average of $36,064) per victim. Contemporary sex trafficking is the most profitable form of slavery the world has ever seen.
Table A.4 summarizes key economic metrics on slavery, in particular the return on investment (ROI) and the exploitation value (EV) of a slave. The first column of this table is carried over from table A.1, and the second column is carried over from table A.2. The weighted average acquisition costs for each category of slavery are based on data from the 5,439 cases I have documented. The acquisition costs range from $295 for debt bondage slaves to $2,220 for trafficked sex slaves. The weighted average acquisition price of today’s 31.2 million slaves is $550. This compares to a global weighted average acquisition price of approximately $4,900 to $5,500 in 2016 dollars for a slave roughly two hundred years ago in 1810. This value was calculated through a sampling of acquisition prices of slaves around the world in 1810, which on average ranged from approximately $7,000 to $10,500 in 2016 dollars (depending on age, gender, health, time of year, geography, skill, and other factors) for African slaves in or trafficked to/within the Americas, to $900 to $3,500 in 2016 dollars for slaves in or trafficked to/within South Asia, Africa, East Asia, and the Middle East (prices determined by similar factors as in the Americas). In addition to these average ranges for the prices of slaves sold in 1810, it is important to note that some slaves were sold for much less—in some cases for less than the price of a cup of tea—and others were born into slavery, which renders their acquisition costs close to nil.2 Even though the weighted average cost of a slave has decreased substantially across time, some slaves are purchased today for several thousand dollars, and some slaves were purchased 200 years ago for a few dollars. The ban on European slave trading from Africa to the Americas is one of many reasons for a sharp increase (up to 100 percent) in the market value of a slave in the Americas between 1810 and 1860. Prices in Africa, the Middle East, and Asia did not increase as sharply, primarily because slave trading continued within and to/from many of these regions through the 1800s and into the early 1900s (especially in Asia).
Perhaps the most important metric in table A.4 is the exploitation value (EV) of each slave category. Without knowing this value, it is impossible to understand just how profitable contemporary slavery is; in turn, it is challenging to design effective laws against those who seek to engage in human enslavement. The weighted average net EVs by category of slavery range from $2,545 for debt bondage slaves to a startling $68,177 for trafficked sex slaves. When a slave exploiter acquires a debt bondage slave for a global weighted average of $295, he can expect to enjoy net profits from the exploitation of that slave of $2,545 before the individual escapes, is freed, or perishes. These global debt bondage numbers provide a percentage total ROI of 863 percent, or 170 percent per year for the average duration of enslavement (~5.1 years). Trafficked sex slaves have the highest percentage ROI of 3,071 percent, or 1,004 percent per year for the average duration of enslavement (~3.1 years). The annual ROI for other forced labor is 347 percent, and the global weighted average annual ROI for all forms of slavery is 383 percent for the average duration of enslavement (~4.5 years). This aggregate data is based on a global weighted average acquisition cost of a slave of $550, after which the exploiter can expect to enjoy net profits generated through the exploitation of that slave of $9,367, before that slave escapes, is freed, or perishes. This net cash return per slave demonstrates the powerful demand-side forces to acquire and exploit slaves of all kinds.
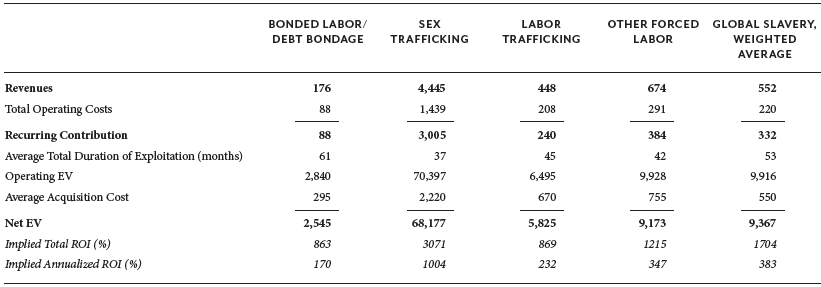
Table A.5 includes summary calculations of the EVs of each of the primary forms of slavery in the world today, including a global weighted average for all those forms combined. The EV is calculated by deducting operating costs from revenues, which provides a monthly recurring contribution. This figure is multiplied by the aggregate average number of months of enslavement to generate an operating EV. Deducting the weighted average acquisition cost of each type of slave from operating EV provides the net EV of the slave.3
TABLE A.5 Exploitation Value (EV) of a Slave, 20161
1 Dollar values in 2016 U.S. dollars.