Chapter 7
Knowing Your Big Data Tools
In This Chapter
![]() Identifying the tools you need to know
Identifying the tools you need to know
![]() Delving into data storage and access tools
Delving into data storage and access tools
![]() Staying current in the evolving big data world
Staying current in the evolving big data world
This chapter gives you a high-level view of the technologies that companies use for building big data infrastructures. I cover the application of technologies like Hadoop, NoSQL, and visualization tools, as well as the role of traditional relational database management systems (RDBMSs). The ecosystem of big data tools is expanding fast. If I tried to list every category, type, and vendor, this chapter would be out of date as soon as the book goes to print. So, I cover the core technologies you need to know, and from there, you can build your skill sets as the field continues to grow.
Large data sets are common in biological or environmental research (human genome, anyone?), Internet search engine queries, financial markets, information-sensing technologies (for example, wireless and radiofrequency identification [RFID]), and data streams such as those used by aerial drones. As healthcare and health records move from analog to digital, expect manipulation of large datasets to become a challenge there as well.
 Big data has exploded due in large part to machine-generated data and social media. In the past, data was created by data-entry people and end-users. There is only so much data a human can create at a company, but machines can create endless volumes of data. With everyone in the world creating data on social media, the data volumes have exploded.
Big data isn’t just about volume; it’s also about variety, veracity, and velocity (see Chapter 3). The speed at which data must be analyzed to make informed decisions has rapidly increased. The influx of different data formats coupled with the unstructured nature of these datasets has increased our potential for analytic capabilities. To that end, we need to employ tools in order to realize this potential.
Database Tools You Need to Know
When people think about big data tools, the first tools that come to mind are often technologies like Hadoop, MapReduce, and slick visualization tools. These tools are an essential part of the ecosystem, but they all rely on a foundation of traditional data stores. In this section, I show you these foundational technologies as well as the emerging technologies often associated with big data.
 The big data field continues to expand. In 2010, there were about 100 companies making products supporting the big data space. By 2014, that number grew to almost 1,000.
Table 7-1 compares the different types of storage systems and how they fare in terms of performance (how fast work can get done), scalability (the capability for the system to grow), flexibility (the capability to store lots of different kinds of data formats), and complexity (how hard it is to implement). I cover each of these systems in greater detail in the following sections.

Relational databases and SQL
Relational database management systems (RDBMS) make up the foundation of any big data project.
RDBMS systems were originally used for OLTP systems before the advent of data warehousing.
Relational databases are systems that organize data into very logical tables, much like a Microsoft Excel spreadsheet. Systems are built around tables, columns, and unique keys to access that data stored in rows using a database access language called Structured Query Language (SQL). People use RDBMSs to store structured data. Figure 7-1 shows a simple example of a RDBMS set of tables to describe students, classes, and their grades.
To access these databases, programmers utilize SQL to construct a query to ask for information.
The following code is an example of SQL. This SQL statement, or query, calls out the required columns and tables linked by a unique ID to get a result of the two students who happened to have grades above a 90. The key here is that unique ID, which is used to identify discrete rows within the database system.
Select student.first, student.last from student where grade.grade > 90 and student.id=grade.id
Result:
Mark Brown
John Good

Figure 7-1: An example of a set of relational tables.
This example illustrates two important points about database systems:
- Storage: Data must be collected and stored in a defined, or structured format (refer to Figure 7-1).
- Access: You must have a programmatic method to access that data. That is done through SQL. SQL is not a database management system; it’s a standard language for access data.
This extremely simple example is the framework for how most of the world’s data is stored and accessed. Even if you don’t plan on becoming a database programmer, a good grasp of SQL will be required for any big data work.
A few key vendors today store most of the world’s data. IBM Db2, Oracle, and Microsoft’s SQL Server hold almost 90 percent of commercially available database management systems. Open-source products include MySQL, which is curated by Oracle and PostgreSQL.
NoSQL
A vast amount of information is stored on RDBMSs, but what about all the other technology you hear about? The huge amount of data and the need to access it quickly, as well as store unstructured data, requires an array of other systems that enable speed and agility. The advent of Not Only SQL (NoSQL) — not to be read as a negative comment on SQL but in addition to SQL — provided users with a more flexible and scalable way to store and access data to accommodate the demands of big data. Often, NoSQL systems lack the ACID transactions supported by traditional systems. ACID stands for automaticity, consistency, isolation, and durability; it refers to a set of attributes that ensures transaction integrity (the correct recording of a transaction) in a database — for example, a bank withdrawal is correctly recorded. The following sections discuss common NoSQL technologies.
Key-value-pair data stores
This system does not require a highly structured model like a relational system. The key-value-pair (KVP) system focuses on tables and keys, allows for great flexibility, and can grow to a very large sizes without sacrificing performance. This is called scale. Scaling, or adding millions or billions of items to a data store, can impact performance negatively in a traditional system. KVP stores that “scale well” can get very, very big and still perform fast.
A key is a identifier that is used to find a value, the thing you want to store. Together they’re considered a pair.
Figure 7-2 shows how these tables work. Say you want to store user preferences like favorite fruit, car, color, and sport. To access that information, you would simply query the key, which could have been retrieved from a browser cookie (a piece of code put in the user’s browser by a company to determine what the user does when he visits the user’s site) and retrieve that data. The “system” in this case allows you to programmatically store and query the key-value-pair. Querying a key simply means looking it up and getting the value. The KVP system offers enormous flexibility for a situation like this where you don’t want to restrict storage choices. When you need to store billions of items of data, a traditional RDMS can perform poorly.
The hard part is trying to make sense of that table on the right in Figure 7-2. Let’s take the browser cookie example a little further. Say you manage a very popular website and need to track where users are coming from. Do they originate from Google, Yahoo!, or somewhere else? You would be able to store an IP address of a user as a key and the value could be the originating web page. This table could contain a snapshot of millions of users, and combing through that information could be a challenge.

Figure 7-2: The key-value pair model.
KVP solutions for big data are designed to be highly scalable and resilient. These technologies are typically stored entirely in random access memory (RAM), so access is fast and doesn’t require the query to access data stored on a physical device like a disc drive, which takes much longer to access. These systems also utilize grid computing and parallel processing, which spreads simultaneous jobs across many computers to share the workload while ensuring fault tolerance if one section of a grid happens to fail.
 Grid computing is a concept of spreading jobs across many computers to get the jobs done faster, as well as provide a high level of availability or fault tolerance. Fault tolerance is making sure a system can still run if something breaks. If you have many computers, or nodes, working together, and one fails, the entire job can still continue.
Prevalent KVP implementations include the following:
- Amazon DynomoDB (http://aws.amazon.com/dynamodb): A KVP NoSQL data store offered as a cloud service from Amazon.
- FoundationDB (https://foundationdb.com): A KVP NoSQL data store that ensures ACID transactions.
- MemcacheDB (http://memcachedb.org): A distributed (grid based) data store that resided in RAM.
- Redis (http://redis.io): A key-value cache with the capability to store all types of data — structured and unstructured. In the industry people refer to Redis as a data structure server.
- Riak (http://basho.com/riak): An open-source NoSQL KVP based on concepts from the Amazon DynomoDB product.
Refer to Table 7-1, earlier in this chapter, for how the KVP system compares with the other systems discussed in this section.
Document-oriented databases
Document-oriented databases allow for the storage and retrieval of semistructured data — data that’s somewhere between unstructured (like a tweet) and structured (like you would see on a bank statement). Web pages and documents are a great example of semistructured data.
Whereas the RDBMSs are oriented around tables and keys, the document-oriented systems use a document paradigm. Instead of storing data in rows and columns, the document model defines information in a document and stores that information logically. This is a very flexible and simplified approach to data storage and retrieval. These model definitions are created by the programmer and accessed through the programming system. Plus, as with big data, users can more readily support real-time information capture, updates, and analysis that is more difficult in a tightly structured relational system.
Many of these NoSQL document databases store data in JSON format.
For example, in a case study published by MongoDB (a document-oriented database company), Intuit (a software company) needed to analyze website data from thousands of websites that Intuit hosted for its customers. With that analysis, Intuit would then make recommendations and improvements and help customers with lead generation and more access for potential customers. Traditional databases like MySQL and Oracle couldn’t easily handle the variety of data that needed to be stored, and querying the data took a very long time. The document-centric nature of MongoDB allowed Intuit to take ten years of customer data and derive insights quickly without increasing complexity. These insights allowed Intuit’s website clients to better sell to their own customers.
Popular document-oriented implementations include the following:
- Cassandra (http://cassandra.apache.org): A part of the Apache open-source project, this is a distributed (grid-based) document-oriented database system.
- CouchDB (http://couchdb.apache.org): An open-source document-oriented database system that has ACID capabilities.
- MarkLogic (www.marklogic.com): A commercially available document-oriented database system touted as enterprise ready. This is highly secure, reliable, and used by many Fortune 1,000 companies for customer-facing processes.
- MongoDB (www.mongodb.org): Perhaps the leading NoSQL database system that uses a document-oriented approach. This is also open-source under the Apache license model.
Refer to Table 7-1, earlier in this chapter, to see how the document-oriented system compares with the other systems discussed in this section.
Graph-oriented databases
Graph-oriented databases leverage graph theory from mathematics. This type of database uses concepts of nodes, edges, and properties to store information and relationships. Directed graphs are especially useful when thinking about complex relationships like schedules with multiple dependencies, or in a social network, where you need to store information about people and their connectedness. In Figure 7-3, you see how people connect to one another. For example, if this were a graph of people connected in Facebook, you can see how sending information to one person would radiate out to others.
Graph theory is the science of viewing mathematical models in terms of graphs to relate objects with one another. A social network picture is an example of a graph. Nodes are people, and the edge connects these people. The properties can define the edges, or relationships.

Figure 7-3: A graph of a social network.
This type of database storage is especially useful for sites like LinkedIn or Facebook. We can see that the nodes are people with edges connecting those people. The properties of those edges show how they’re related and for how long. Consider a project where you want to capture relationships of people from many different types of sites and see how they relate together across all social media. Storing this type of data in a traditional data store would be challenging not only for the relational connection, but in how you query that data.
One example of a popular graph technology is GraphDB (http://neo4j.com/product), which is used to map special data relationships call RDF Triples. The tool takes objects and facts, and graphically relates them.
Refer to Table 7-1, earlier in this chapter, for how the graph-oriented system compares with the other systems discussed in this section.
Column-oriented databases
These systems are distributed column-oriented data stores. They orient information not in rows, like traditional RDBMSs, but in columns. This allows for the natural grouping of data, which speeds up analysis.
Traditional RDBMSs must follow a very defined way to organize information called table normalization, which avoids repeating column types and breaks information down to an atomic nature. So, to assemble a report, a programmer has to link these atomic elements, using SQL, into groupings that make sense to a human. This can take a very long time when dealing with huge amounts of data. Traditional RDMBSs are much slower because they must make complicated and time-consuming linkages to assemble large swaths of data into reports.
Apache HBase (http://hbase.apache.org) is a popular distributed column-oriented data store that was modeled after Google’s Bigtable system (http://research.google.com/archive/bigtable.html). HBase is built upon the Hadoop file system, which I cover later in this chapter. HBase allows fast access to tables that are billions of rows by millions of columns.
With column databases, you can aggregate information vertically in column families, as shown in Figure 7-4, allowing for fast access of massive amounts of data. Unlike relational models, which are row focused, large columns and summary data on those columns can be done much faster. This figure shows how a document-oriented database creates groups of things, often called families. Documents are detailed within these families and are stored within a column family and accessed via a key-value pair.

Figure 7-4: The column-oriented model.
Big Data Framework Technologies
Aside from storing information, there are several important frameworks for organizing, accessing, and analyzing big data. In this section, I cover four important technologies that you need to be familiar with or skilled in, depending on the big data role you’re pursuing.
The Hadoop framework
The Hadoop framework is an Apache open-source project — not standalone technology, but a collection of technologies. Hadoop has many implementations used by popular big data vendors like, Amazon Web Services, Cloudera, Hortonworks, and MapR.
Hadoop allows for very high-speed processing of big data by using a MapReduce strategy. MapReduce is a programming model used to process large amounts of data across parallel clustered systems. This does its workloads on files that are stored within a files system framework, like the Hadoop Distributed File System (HDFS) or even structured datasets. As you may have guessed from the name MapReduce, there are two steps in the process:
- Mapping: There is a master node that takes large jobs and maps those to smaller worker nodes to do the work. In some cases, a worker node could further simplify the workload to smaller nodes. (A map step is like a WHERE clause in a SQL statement.)
- Reducing: When the work is done by the worker nodes, the master node collects the “answers” and assembles the results. (A reduce step is like a GROUP clause in a SQL statement.)
The power is in the parallelization (working multiple jobs at the same time) of the mapping step. You can sort through petabytes of data in hours instead of days, as would be the case for traditional database queries running SQL.
The objective of Hadoop is to take lots and lots of data and derive some set of answers, or results. This is done through a map/reduce process in parallel. The data is “mapped” according to some sorting algorithm and then “reduced” through an additional summary algorithm to derive a set of results. The magic is in the parallel part. Many mapping jobs can be done at the same time across a network of computers, or nodes. The nodes are independent resources within a network of computer systems. By sharing the load, the job of sorting though massive amounts of data can be done quickly.
Pig
Pig and its language, Pig Latin (you can’t accuse geeks of having no sense of humor), are a platform for analyzing large datasets originally created at Yahoo! for access to Hadoop clusters and later moved to the Apache open-source community. Pig Latin is the access language that is used to access the runtime environment of Pig. It’s designed to make the work of creating MapReduce jobs easier. You don’t have to build your own map and reduce functions, but it’s another language to learn.
Hive
The challenge for traditional database programmers who move to new technologies is that they have to learn new languages and paradigms, like Pig. They’ve been programming in SQL for years, and moving to more pure computer science models is a challenge. Enter the Hive.
Hive allows programmers comfortable with SQL to write Hive Query Language (HQL) to query Hadoop clusters. By using a language very similar to SQL, Hive can translate SQL type calls into Hadoop-speak, which makes the usability of Hadoop much more palatable to traditional RDMBS programmers. Think of it as a translation engine. If a programmer doesn’t know how to program in Hadoop, but knows how to use SQL to access data, Hive acts as that bridge and translates SQL type calls into Hadoop.
Spark
Spark is an emerging platform which is also built upon HDFS. In addition to being able to leverage HDFS, Spark can access HBase, Cassandra, and other inputs. Spark leverages grid computing for large parallel processing and can store information in RAM, which provides ultra-fast access to data and compute resources for analysis. Programmers can access Spark using Python, Scala, or Java. Spark can also be used in conjunction with graphing analytics like GraphX and MLib, which is Apache’s machine learning library. The next section covers additional big data technologies like machine learning.
Analysis Tools You Should Know
In the construction industry, it’s often said that the kitchen sells the house. If the end result is to communicate information to take action, then analysis and visualization tools are the kitchen of big data.
Business analytics or business intelligence tools
Business analytics (BA) or business intelligence (BI) tools can be used to directly connect to data stores, both structured and unstructured, to help in the analysis and interpretation. Appendix A fills you in on some resources for staying up to date on widely used BA and BI tools. Here are a few tools you may want to investigate:
- Birst (www.birst.com): Birst technologies is an on-demand, or cloud based, business intelligence and analytical tool for data analysis.
- IBM Cognos (www-01.ibm.com/software/analytics/cognos): Cognos is the primary product for business intelligence from IBM. It was acquired in 2008.
- Jaspersoft (www.jaspersoft.com): Jaspersoft is an open-source business intelligence platform.
- MicroStrategy (www.microstrategy.com): MicroStrategy, based in Washington, D.C., is a publicly traded business intelligence software firm that has been in business since 1989.
- Oracle Business Intelligence (www.oracle.com/us/solutions/business-analytics/business-intelligence/overview/index.html): Oracle has a suite of business intelligence tools, some built in-house and some acquired from Hyperion. Oracle business intelligence is a suite of tools that can work on any relational database platform.
- Pentaho (www.pentaho.com): Pentaho is an open-source business intelligence software firm based in Florida, in operation since 2004.
- QlikView (www.qlik.com): QlikView is an analytical visualization and business intelligence software firm.
- RapidMiner (http://rapidminer.com): Rapid Miner is tool for predictive analytics. It provides an environment for machine learning and text analytics and is offered in both a commercial and open-source model.
- SAP (www.sap.com): SAP is large multinational software firm based in Germany. Products like SAP HANA allow users to process and analyze big datasets.
- Tableau (www.tableausoftware.com): Tableau is a software firm that offers visualization and business intelligence tools.
There is a lot of debate about the terms business analytics (BA) and business intelligence (BI). Both BA tools and BI tools are used to access data, process it, analyze it, and then communicate the results to the end-user. Many vendors and pundits argue over the terms and even use them interchangeably. As of this writing, business analytics appears to be growing in popularity and the term business intelligence is receding.
Visualization tools
Not all information can be communicated in two-dimensional graphs and charts. Data can be viewed beyond the two dimensions of X and Y. When data is viewed in a third dimension, it can be connected in ways that show various relationships, patterns, and correlations.
Remember graph theory? That’s where the edges and properties are applicable in a tangible way. This is where visualization tools come into play. These tools are able to communicate information, connectedness, and correlation in ways that are deep and dynamic. Data journalist David McCandless gave a famous TED talk on visualization, in which he said, “By visualizing information, we turn it into a landscape that you can explore with your eyes, a sort of information map. And when you’re lost in information, an information map is kind of useful.” He goes on to give some really great examples of how data visualization of big data can reveal insights that we may not have otherwise been able to understand. (You can watch the whole talk at www.ted.com/talks/david_mccandless_the_beauty_of_data_visualization.)
Figure 7-5 is a simple but commonly used word cloud of the U.S. Constitution. The most commonly used words are larger in size and reveal themes, trends, and main topics.
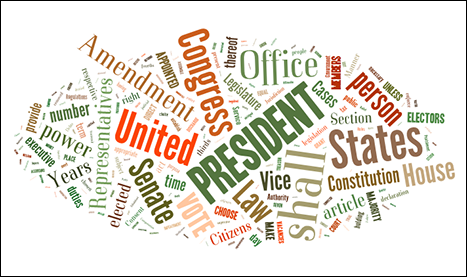
Figure 7-5: A visualization of the U.S. Constitution.
The following is a list of great visualization tools:
- Dygraphs (http://dygraphs.com): A free JavaScript-based library for building complicated charting in web browsers.
- Exhibit (www.simile-widgets.org/exhibit): Interactive mapping tool created by MIT. Free to use.
- Google Charts (https://developers.google.com/chart): A Google-powered online charting tool.
- jQuery Visualize (www.filamentgroup.com/lab/update-to-jquery-visualize-accessible-charts-with-html5-from-designing-with.html): An open-source charting engine supporting jQuery.
- Kartograph (http://kartograph.org): Build interactive mapping without Google Maps that can run across any browser.
- Many Eyes (www.ibm.com/manyeyes): IBM-developed tools for analyzing publically available data sets.
- R (www.r-project.org): A free, open-source environment for graphing statistical analysis.
- WolframAlpha (www.wolframalpha.com): Ask this engine anything. This knowledge engine comes back with information, charts, and data. It also supports an API to programmatically retrieve charting and information.
- ZingChart (www.zingchart.com): A JavaScript library supporting more than 100 chart types; supports Flash or HTML5
Sentiment analysis tools
Sentiment analysis tools and processes attempt to measure how people feel about a certain thing, event, or product. Marketers like to take the pulse of people to know in near real time what a given response may be. For example, if a technology company releases a new phone product, the company may be able to measure how people feel about it by combing people’s tweets, blog posts, Facebook updates, or other social media outlets.
The big data challenges include the following:
- Volume: Sifting through millions of tweets looking for relevant hashtags while mashing that up with Instagram pictures can be time-consuming to say the least.
- Interpretation: How do you interpret feeling when there is no structured way to communicate? On Twitter, spelling and grammar are almost worthless.
That’s where sentiment analysis helps out. Great advances have been made in text and speech analysis, and innovation continues. But text and speech analysis aren’t the only ways to measure sentiment. We can measure things like followers, retweets, likes, and other properties associated with social media moods.
There are a few levels here to consider when thinking about your place in the market. If you’re a data scientist or a programmer, you can contribute to this type of technology by advancing research on text analysis, mapping human language to feeling, and building the algorithms to sort it all out.
Twitter is a common target for sentiment analysis, primarily because Twitter can give near real-time reaction to events. Other tools you can use include Google Alerts (www.google.com/alerts), Hootsuite (http://hootsuite.com), and Facebook Insights (www.facebook.com/help/336893449723054).
Machine learning
Machine learning is a focus within computer science that uses artificial intelligence (AI) to allow computers to automatically learn from data. A very simple example of this is the autocorrect or autocomplete feature on your smartphone. Your personal device “learns” the common words and phrases that you use to help with spelling correction and typing tasks. Another example is how companies like Shazam are using music data to predict the next hits by learning from historical music patterns, arrangements, and beats. Patterns emerge that tend to produce winning music formulas.
Machine learning jobs are not limited to innovative firms like Shazam. Any company that has to think about frequent user interaction and predicting future patterns can use machine learning specialists.
Keeping Current with Market Developments
You may feel as though you’re hopelessly drowning in a list of technologies to tackle while new ones keep popping up. Although there is a lot to learn, you can do a few things to make sure you’re staying current:
- Don’t worry about trends. You’re probably not a stock analyst, technology writer, or any other person who makes money by predicting the technology future. Don’t worry too much. Settle into these foundational technologies and let the trends come to you.
If you’re interested in trends, one way to keep up with them is to join LinkedIn groups and see what others in your field are reporting.
- Stay plugged into the community. All the major technologies I discuss in this chapter have thriving online communities, active blogs, rich tutorials, and a glut of white papers. Find the ones you think will add value to your career path and stick to it.
- Watch the innovators. The innovative Internet companies like Amazon, Google, Yahoo!, Facebook, LinkedIn, and others have pioneered many of these technologies to enable their services for the public. They work within a very collaborative environment, and many of their contributions make it to the open-source community.
This is an exciting, dynamic, and growing field. Learning, discovery, and curiosity are core values of big data and those who aim to master it.